Nuclear activity and massive star formation in the low luminosity AGN NGC 4303: Chandra X-ray observations
Abstract
We present evidence of the co-existence of either an AGN or an ultraluminous X-ray source (ULX), together with a young super stellar cluster in the 3 central parsecs of NGC 4303. The galaxy contains a low luminosity AGN and hosts a number of starburst regions in a circumnuclear spiral, as well as in the nucleus itself. A high spatial resolution Chandra image of this source reveals that the soft X-ray emission traces the ultraviolet nuclear spiral down to a core, which is unresolved both in soft and hard X-rays. The astrometry of the X-ray core coincides with the UV core within the Chandra positioning accuracy. The total X-ray luminosity of the core, erg s-1, is similar to that from some LINERs or from the weakest Seyferts detected so far. The soft X-rays in both the core and the extended structure surrounding it can be well reproduced by evolutionary synthesis models (which include the emission expected from single stars, the hot diffuse gas, supernova remnants and binary systems), consistent with the properties of the young stellar clusters identified in the UV. The hard X-ray tail detected in the core spectrum, however, most likely requires the presence of an additional source. This additional source could either be a weak active nucleus black hole or an ultraluminous X-ray object. The implications of these results are discussed.
1 Introduction
Seyfert 2 galaxies are a sub-class of Active Galactic Nuclei (AGN) whose observed properties suggest that the supermassive black hole that is widely accepted to power AGN is obscured to our line of sight. Several Seyfert 2 galaxies are known to host intense starbursts in their nuclear regions, (Heckman et al., 1997; González Delgado et al., 1998; Levenson, Weaver, and Heckman, 2001), which emit a significant part of their energy in the UV and X-ray energy ranges. In most cases the star formation episodes contribute with a large fraction of the total UV emission while the relative contributions of both components to X-rays remain still to be disentangled. This is naturally explained in the unified model frame as due to absorption of the intrinsic AGN emission by matter in the line of sight, probably a dusty molecular torus. The energy required for the nuclear photons to show up after going through the obscuring matter mainly depends on its effective HI column density. For columns of cm-2, the intrinsic AGN emission is completely absorbed in the UV and softer X-rays, but can be detected at medium to hard X-rays. The AGN emission can also be seen as a result of reflection. Seyfert 2 galaxies and other type-2 low luminosity AGN hosting circumnuclear star-formation knots provide therefore an ideal laboratory to investigate the starburst-AGN connection, to characterize the intrinsic X-ray AGN emission and quantify the contribution of starbursts to the whole X-ray emission. On one side, the UV and soft X-ray starburst emission can be properly analysed thanks to the torus which shields (at least partially) the brightest AGN radiation which in Seyfert 1 and quasars is completely hiding possible starbursts. On the other side, the AGN itself can still be characterized via the analysis of the hard X-ray emission, provided the torus column density is lower than .
NGC 4303, M61, is a nearby (distance 16.1 Mpc) widely studied barred galaxy harbouring a low luminosity AGN. The properties of the optical emission line ratios classify it as a Seyfert 2/LINER border line AGN (Filippenko & Sargent, 1985; Colina and Arribas, 1999). A young massive stellar cluster and a low luminosity active nucleus seem to coexist within the central 3 pc of the galaxy (1″= 78 pc), with the starburst contribution being the dominant one in the UV spectral region. In particular, the STIS-HST UV spectrum of the core (diameter 3 pc) shows characteristic broad absorption lines produced by massive young star winds and it can be reproduced by a young massive stellar cluster, (Colina et al., 2002), with no need for additional contributions. STIS-HST UV images show a circumnuclear spiral-shaped structure of star-forming regions spread out to a radius of 250-300 pc (i.e. 35-4″). HRI-ROSAT images show that about 80 per cent of the total soft X-ray emission from NGC 4303, i.e. from 0.1 to 2.4 keV, (Tschöke, Hensler, and Junkes, 2000), comes from the central (″) region of the galaxy. The X-ray contours reveal that this central source is possibly extended, but the detailed (and smaller scale) circumnuclear spiral discovered in the UV cannot be resolved with HRI. The question whether this central X-ray emission is from pure star-forming massive clusters or a composition of these star clusters plus a low luminosity AGN is not solved, although the second explanation is suggested by Tschöke, Hensler, and Junkes (2000).
We have obtained Chandra images of NGC 4303, aiming to resolve the X-ray emission from the core and from the circumnuclear star-forming spiral. In this paper, we discuss the spectral properties of both regions and model the X-ray emission associated to the known star-forming knots with evolutionary synthesis models. In Sect. 2 we present the Chandra data and their analysis. In Sect. 3 we discuss the origin of the X-ray emission and its relation to the star-forming episodes. In Sect. 4 we summarize the main conclusions of our work.
2 Data analysis and results
2.1 Observations
In this paper we present the Chandra Advanced CCD Imaging Spectrometer (ACIS) observation of NGC 4303. ACIS covers the energy range between 0.2-10 keV. Each of the 6 active CCDs of the instrument observed a 8383 field of view. NGC 4303 was chosen to be placed in the S3 back illuminated ACIS chip. Around 90 of the encircled energy lies within 4 pixel in diameter (2″). The observation was performed on August 7th 2001 with a total duration of the standard good time intervals of 28380 s. Data processing and calibration was performed with the Chandra software CIAO 2.1. The analysis has been done using the the level 2 event lists as generated by the standard processing system, on August 20, 2001. The only further correction that was needed and applied was the use of improved gain maps made available after the processing date.
2.2 Morphology of the X-ray emission
2.2.1 Off-nuclear emission
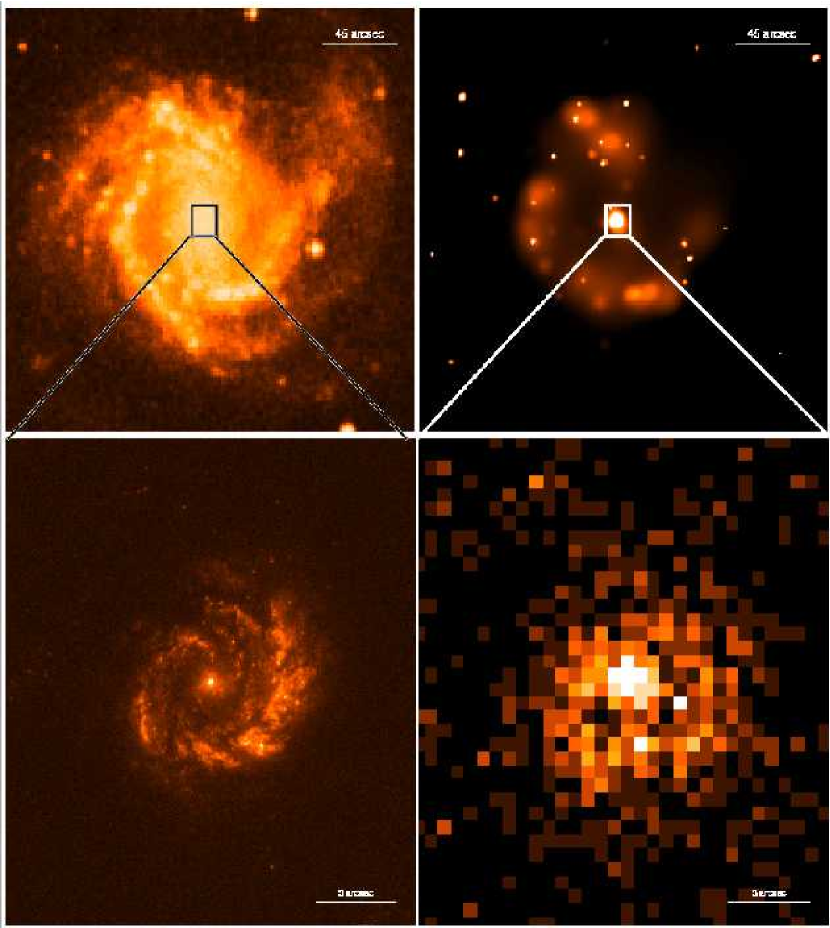
The high spatial resolution of the ACIS image allows us to distinguish many features. The image shows structure in the intense nuclear region of NGC 4303, surrounded by a dim halo with an extension of about 2′, mapping the most luminous arm of the galaxy. The 5′5′ Chandra image of NGC 4303 can be seen in Figure 1, compared with a Digital Sky Survey (DSS) image of the same region (top panel). The dim structure in the Chandra image is mapping the spiral arms seen in the DSS image. As discussed bellow, in Sections 2.4 and 3, the total diffuse emission is erg s-1.
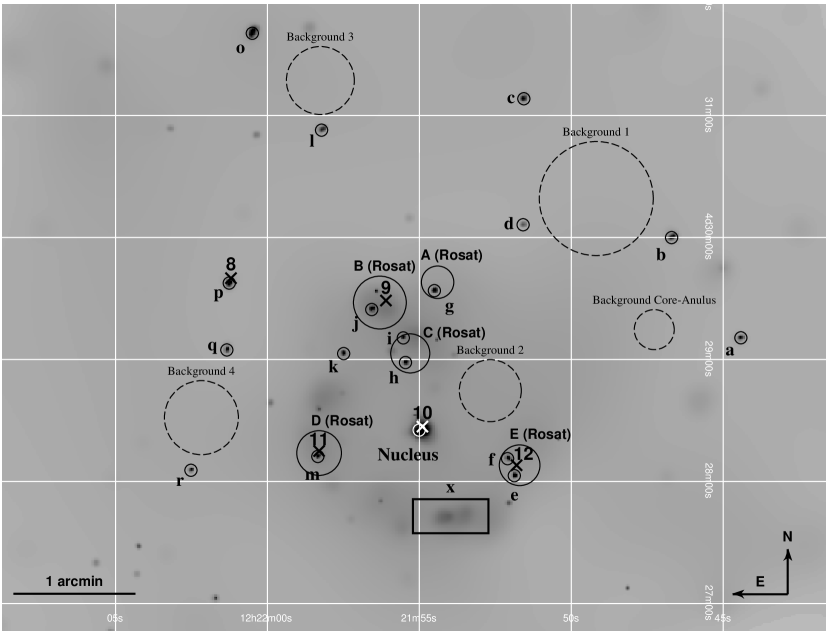
In addition to the diffuse emission, some point-like sources are seen in X-rays, probably associated with star-forming knots or binary systems. These sources are shown in in Fig. 2 together with their ROSAT identifications, following the nomenclature of Tschöke, Hensler, and Junkes (2000), when applicable. The location, net counts and net count rate of each detected source is shown in Table 1. The sources have been detected using the CIAO 2.1 celldetect detection tool. The counts of each source have been calculated integrating over a circle of 4 Chandra pixels. Four different background regions have been considered in order to obtain the net counts, see Table 1 and Figure 2. The errors considered for the count calculation are poissonian, i.e. using the Gehrels approximation , Gehrels (1986). The errors for the net counts were calculated assuming that the count error for the source and for the background are independent. Unfortunately, the signal to noise is not high enough to allow individual spectral analysis for all the sources. To compute their luminosities in the 2–10 keV energy range, we have used the count rate estimator tool, PIMMS 3.2d. The point like sources detected in the Chandra image are located in the spiral arms of NGC 4303. The sources coincide with the HII regions studied by Martin & Roy (1992) or are located near them. These regions seem to be photoionized by OB stars related to starbursts episodes,Martin & Roy (1992). Since these sources are located within star-forming regions, they are likely to be high mass X-ray binaries (HMXB). According to Persic and Rephaeli (2002), HMXB spectra can be modeled by a power law with index 1.20.2 in the 2–10 keV range. This value is also in agreement with the indexes found for HMXBs in Large Magellanic Cloud, (, Haberl, Dennerl, and Pietsch (2002)) and in the Small Magellanic Cloud,(, Sasaki, Pietsch, and Haberl (2003)), observed with XMM-Newton. However, the luminosities for these sources are one or two orders of magnitude lower than the luminosites calculated for the NGC 4303 point-like sources. We have used this model, power law with , to derive the luminosities of the sources in this energy band. The computed luminosities were corrected by line-of-sight absorption using the Galactic column density of (Schlegel, Finkbeiner, and Davis, 1998) and are shown in Table 1. The errors in the luminosities have been estimated using the error in the power law index. The previous power law model does not apply in the soft, 0.23–2 keV, band. We have therefore computed an energy conversion factor, ECF, by performing an spectral analysis of the brightest point-like source detected within the central 2 ′ region. This is source m in Fig. 2, for which we have extracted the spectrum and fitted an absorbed, nH=, Raymond-Smith thermal model, kT= with fixed Galactic absorption. We have obtained a value for the ECF0.23-2 of erg cm-2 s-1counts-1, where the error has been estimated using the uncertainty in the flux of the source m obtained from the fit.
The luminosities found in both energy bands are for the majority of the sources, i.e. above the Eddigton limit for a typical neutron star, and these sources could be associated to intermediate X-ray objects, (IXOs) or ultraluminous X-ray sources, (ULXs). Recent works find that this kind of sources can be explained by a power law with index within the range 1.6-2.9111Chandra data of two of the brightest point-like sources in nearby galaxies, NGC 5204 X-1 and NGC 4559 X-1, shows indexes of and , respectively, (Roberts et al., 2002). Strickland et al. (2001) found a value of the power law index of for an ULX in NGC 3628, observed with Chandra. Foscahini et al. (2002) studied with XMM-Newton a sample of 8 ULXs, finding that 5 of them could be model by a power law with . The fits have been preformed with XMM-Newton and Chandra data, so they are valid in both energy bands: 0.23-2 keV and 2-10 keV., also in agreement with the values for soft and very hard states of black hole X-ray binaries, (BHXBs), . We have therefore computed also the luminosities in the two energy bands considered using the power law index and . The resulting values are shown in Table 1 with the luminosities marked with L2 and L3. Unfortunately, the quality of the data does not allow to perform an individual spectral analysis of each source, necessary to determine the nature of the off-nuclear point-like sources.
In addition to the point sources, we have also measured the counts and estimated the fluxes and luminosities of an extended region in the circumnuclear ring. This is the region labeled with an x in Fig. 2, centred at RA=12 and DEC=+4. The value of the net counts detected in this region in the 0.23–2 keV band is 29119, suggesting, using the above ECF, a soft X-ray luminosity of erg s-1.
2.2.2 Spatial analysis of the nuclear region
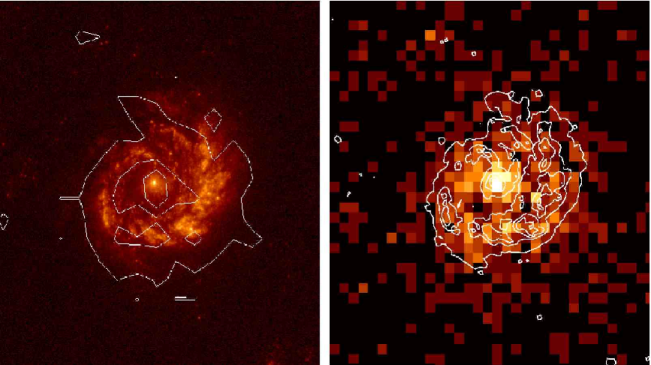
The central region of the galaxy shows a well defined X-ray structure when looked closer, (see Figure 3, on the right). The X-ray image has been compared with a high resolution STIS-HST UV image (Colina et al., 2002). The UV image shows a luminous nucleus surrounded by a nuclear spiral structure of star forming regions. The Chandra contour map superimposed on the STIS-HST image (or, similarly, the STIS contours superimposed on the Chandra image) shows that there is a good match between UV and X-ray emission regions (see Figure 3, on the left). Moreover, the positions of the unresolved core in both ranges agree better than the Chandra astrometric accuracy of 06 (90% confidence): whereas the core location in the HST image is RA (J2000)=12h 21m 5496 and Dec(J2000)=+04°28′2552 (Colina et al., 2002), in the X-ray image it is located at RA (J2000)=12h21m 5495 and Dec(J2000)=+04°28′257. This means that the UV nucleus of NGC 4303 is coincident with the soft and hard X-ray nucleus within the astrometric accuracy of Chandra the STIS-HST accuracy being much better than this.
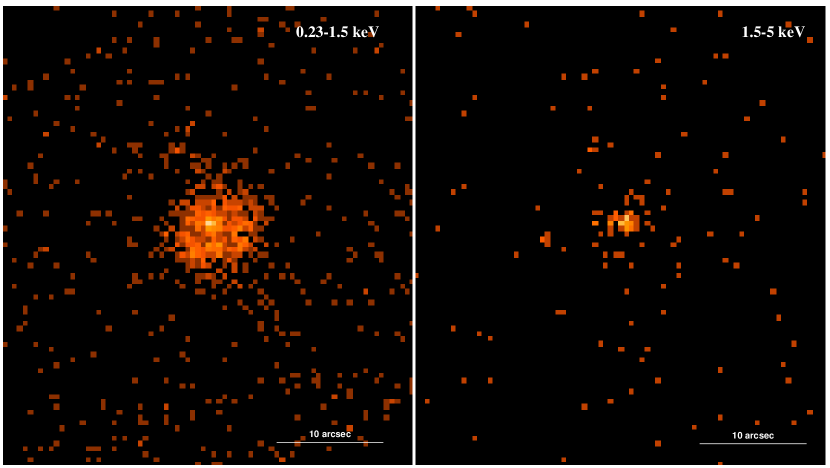
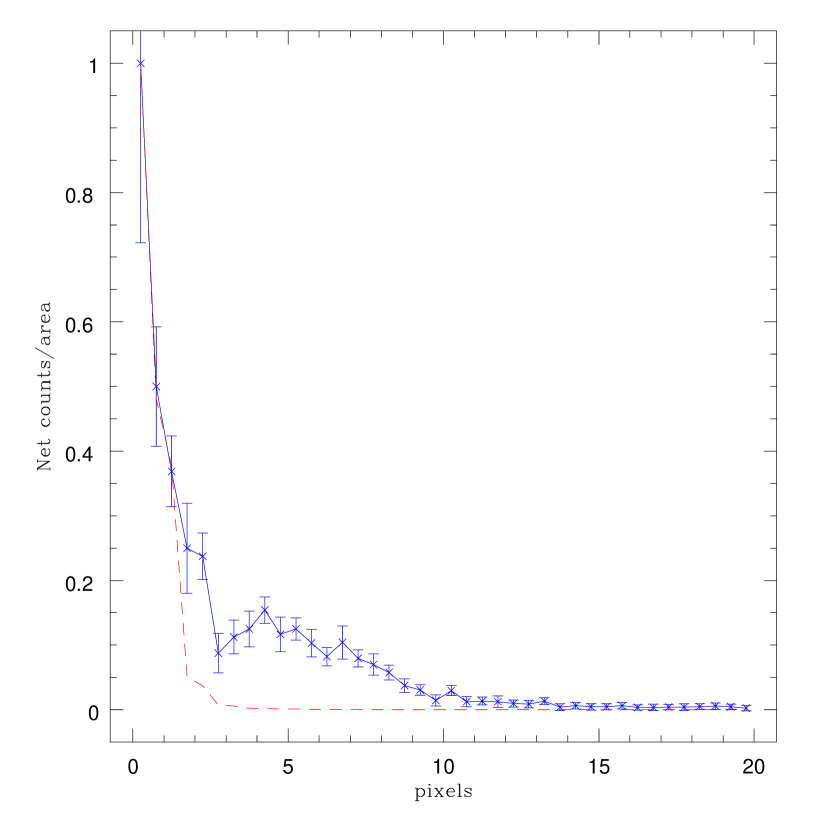
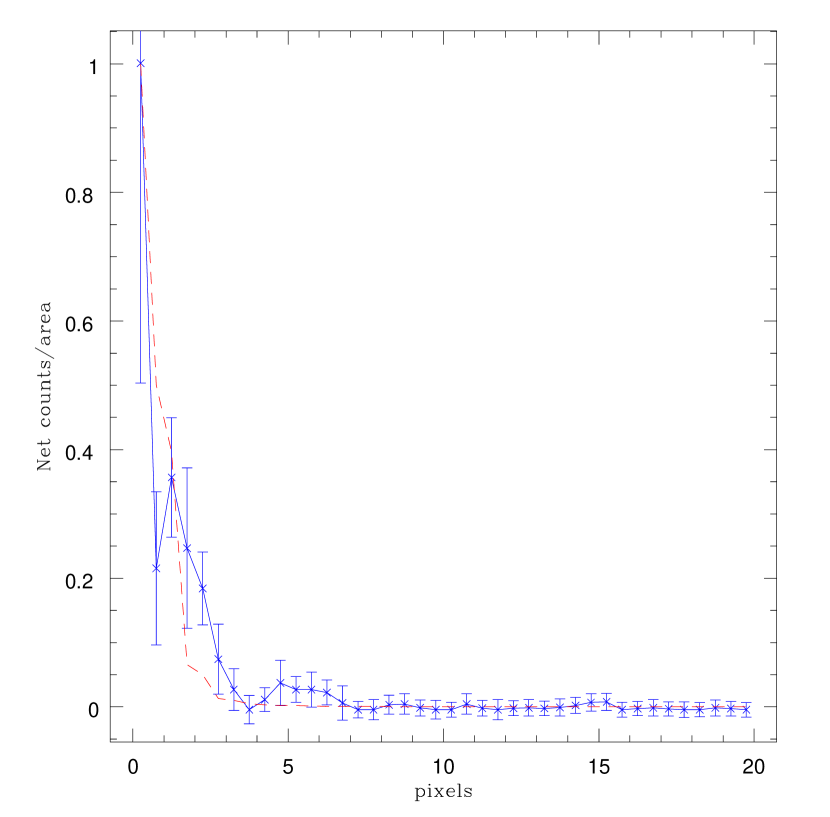
As a first step for the spatial analysis of the nuclear region, broad band soft, 0.23-1.5 keV, and hard, 1.5-5 keV, X-ray images have been compared. The energy ranges have been chosen according to the observed spectrum and Chandra effective area, to better separate the soft and the hard emission while maintaining a high enough effective area and measured counts in the hardest band to allow computation of hardness ratios. The radial profiles have also been extracted and compared with the point spread function. The results are shown in Figure 4. In the hard X-ray image only the most central region is present and no significant difference is found between the central NGC 4303 profile and the PSF; this means that the hard X-ray source is unresolved. Meanwhile, the spatial structure of the NGC 4303 central region clearly shows up in the soft X-rays. The radial distribution of the low energy emission is clearly different from what is expected from a point-like source. The position of the peak intensity coincides with the unresolved hard X-ray one, but there is a secondary peak close to 2″ from it and extending at least to 8″ away. Based on these results, we have defined two regions: the core and the annular region as the 148 (3 Chandra pixels) radius circle and the annulus between 246 and 787 (i.e. 5 and 16 Chandra pixels, in radius), respectively. The inner radius of the annular region has been set to 5 pixels to avoid overlapping pixels between the two zones. The outer radius is big enough to consider all the emission originating in the annulus, but excluding the external halo.
2.3 Spectral analysis
2.3.1 Broad band properties
In order to quantify the spectral differences between the core and the annulus, we have computed the hardness ratios as: , where soft and hard are the net count rates integrated in the 0.23–1.5 keV and 1.5–5. keV energy bands, respectively. We have measured soft values of and counts, for the core and annulus, respectively and, similarly, hard values of and counts. With these values, we obtain and . This means that about 25% of the X-ray counts from the core have energies above 1.5 keV, in contrast to 7% of the detected counts from the annulus. The errors on the have been calculated assuming the count rates of each band to be independent measurements. The difference between the two values of equals to 5.7, with its error.
2.3.2 Core region
The total net counts and net count rate in the core region are 188 counts and , respectively. We have extracted the spectrum and grouped it based on a requirement for 25 counts per channel to allow use of statistics. The analysis has been performed with the Xspec software package, using as background the spectrum of a 3 pix radius circular region centered about 2 ′ NW of the nucleus, see Fig. 2.
The first trial has been to fit single component models, either a power law or a thermal Raymond-Smith model, absorbed by the Galactic column density, N (Schlegel, Finkbeiner, and Davis, 1998), and with only the normalization and the relevant parameter (photon index of the power law, , or temperature of the thermal component, T), left free, as the abundance has been frozen to the solar value. None of the fits were statistically acceptable with (6 degrees of freedom, dof), see Table 2. In both cases, the residuals of the fit are larger in the soft energy range, 2 keV. Two-component models have therefore being tested, though keeping the number of free parameters to the very minimum, given the small number of bins available.
The best fitting model found for this region, =1.1 (4 dof), includes two components: the emission of a hot and diffuse gas, Raymond-Smith emission, and a power law, with only the two normalizations, T and let free. Photoelectric absorption due to our galaxy has been added with nH fixed to the above value. We have tested the possibility of an additional internal absorption for the thermal component, obtaining a very low value, n; therefore, it can be neglected and it is not considered any further. The values of and dof of the single component models and the best fitting model have been compared using the F-test. The value of F obtained is 4.54, assuring the improvement obtained with the two component fit is statistically significant with a probability of 90%. Figure 5 shows a plot of the Chandra spectrum, the best fit model and the residuals.
An alternative model, with a thermal Raymond-Smith plus a bremsstrahlung component, as generally used for AGN accreting with low radiative efficiency, is formally compatible with the above fit. The is 0.99 for 4 dof, the Raymond-Smith has the same temperature as in the previous fit: kT= and accounts for the soft X-rays, while the hard X-rays are explained with a bremsstrahlung temperature of kT=. The main problem of this model is the very large uncertainty on the latter parameter. Another fit was tried with a thermal component and a power law whose photon index was fixed to 1.9, the mean value found in radio quiet type 1 AGN, and allowing variable power law absorption. The best fit parameters were a higher column density, , as expected for type 2 AGNs, and a thermal component temperature of 0.6 keV, similar to the result in the previous fits. However, it failed to give an statistically acceptable result, for 4 dof and therefore it cannot be considered as an adequate model.
Last, we have also tried to fit models that give good results with spectra of ultraluminous X-ray sources, ULX. These models consider an optically thick accretion disk consisting on multiple blackbody components, the multicolor disks (MCD), and can often explain either alone or in combination with a power law, the ULX emission (Makishima et al., 2000). Neither a single MCD fit, nor MCD plus a power law fit have given statistically acceptable results, nor even if some of the parameters have been fixed to typical values found for other ULX (e.g. temperature at the inner disk radius, , in the range of 1–1.8 keV (Mitsuda et al., 1984) or power law index 1.5–2.). The best fit obtained with MCD has a for 6 dof, and it improves adding a power law component, but the value of is still unacceptable, . The values of the parameters of each model and the goodness of the fits are shown in Table 2.
2.3.3 Annular Region
The total net counts and net count rate in the annulus are 477 counts and , respectively. The spectrum has been extracted and binned to a minimum of 35 counts per bin. The background spectrum has been extracted from a region centred in the same position as the background used for the core spectrum, but with different geometry, i.e. a ring of inner and outer radius of 5 and 16 pixels, respectively, Fig. 2.
Similarly to the core, single model fits give unacceptable results. A fit with a combination of a thermal model plus a power law gives a for 7 dof. The best 2-component fit uses two thermal Raymond-Smith models, and , both absorbed by the Galactic column density, but the first one requiring an additional internal absorption, n. The was 0.70 for 7 degrees of freedom. The values of all model parameters are shown in Table 3. The data, the best fit model and the residuals are plotted in Figure 6.
2.4 Fluxes and luminosities
We have computed the fluxes and luminosities of the core and the annular regions. Table 4 shows the luminosities and fluxes in two different bands, 0.23-2 keV and 2-10 keV, for each region, corrected from absorption, as well as the contributions of each component to the total emission. The bands have been chosen to allow comparison with ASCA and ROSAT data, either for NGC 4303 or for other objects of some different classifications. The analysis shows that the emission from the annulus dominates the total emission of the 8″ internal region in the soft range, contributing with 80 of the total flux in this range, and it is thermal in origin. On the contrary, in the 2-10 keV band, the emission is strongly dominated by the core which contributes with of the hard flux, and follows a power law distribution. This result is supported by the images in Figure 4.
In order to compare our results with previous ROSAT analysis, a spectrum of a region of the same extraction radius as the PSPC-ROSAT spectrum, r=100″, has been analyzed and fitted in the 0.23–2 keV energy range. The goodness of the fit obtained was for 50 degrees of freedom. The best model combines a power law with and 2 Raymond-Smith thermal components with temperatures and keV, the second one absorbed by a column density of . The flux measured by Chandra in the 0.23-2 keV is shown in Table 4. The unabsorbed luminosity measured by the ROSAT PSPC, in the 0.07-2.4 keV band (Tschöke, Hensler, and Junkes, 2000), is consistent within the statistical uncertainties with the Chandra 0.23-2 keV measurement across the same aperture ().
3 Discussion
As presented above, NGC 4303 Chandra images reveal that a significant part of its resolved X-ray emission comes from the central (″) region. There is, in addition, a diffuse component extending to about a radius of ″ plus several point-like sources. The luminosity of the 9 sources detected within the 100″(see Fig. 2) adds up to 1.2 times the luminosity of the central, core plus annulus, region in the in the 0.23–2 keV band and to 1.6 times of the central 2-10 keV band luminosity. The total extended, diffuse, soft X-ray emission, ( erg s-1), is a factor larger than the central soft X-ray luminosity.
Mas-Hesse et al. (1995) have analyzed a sample of 111 galaxies, including QSO, Seyfert 1 and 2 and star forming galaxies, studying the ratio of the soft X-ray, L, and Far Infrared luminosities, LFIR. This parameter spans over almost 3 orders of magnitude for the different types of galaxies. In order to compare with the average ratios given by these authors, we have computed it for the whole NGC 4303 galaxy: the soft X ray flux has been integrated from the Chandra spectrum for an 100″ region, while the Far Infrared flux FFIR corresponds to the IRAS flux at 60 (as assumed by (Mas-Hesse et al., 1995)), obtaining F and F Jy (Moshir et al., 1990). These values yield a ratio , in very good agreement with the average value for galaxies dominated by star formation, . NGC 4303 as a whole looks therefore like a normal spiral galaxy.
The X-ray emission of the central region shows a clear structure that matches very closely the nuclear spiral seen in STIS-HST UV images. As explained in the previous section, the spectral analysis has been performed in two separate regions: the annulus, defined as a ring with inner radius of 5 and outer radius of 9, and the unresolved Chandra core, with r15. While the first region contains the individual star forming knots that trace the UV nuclear spiral, the position of the unresolved Chandra core coincides with that of the UV nuclear star cluster to better than the Chandra astrometric accuracy of 06.
3.1 The unresolved core
Very recent STIS-HST ultraviolet imaging and spectroscopy of the core region of NGC 4303 have unambiguously identified a compact, massive and luminous stellar cluster, i.e. a nuclear super star cluster or SSC (Colina et al., 2002). No further contribution is required to explain its UV emission, neither further ionizing flux is needed to account for the observed nuclear H luminosity. Therefore, using only UV observations it could not be inferred whether the NGC 4303 nucleus is hosting an AGN. The AGN classification is based on optical line ratios which have large uncertainties due to the weakness of some lines. The last revision of the NGC 4303 classification is from Colina et al. (2002), using one-dimensional high-resolution spectra, the result being a [OI]-weak LINER. The ultimate origin of the activity in LINERs is still a matter of discussion. High energy and multifrequency data are needed to check whether the stellar cluster itself can account for the observed properties, or an additional source of energy -an accreting black hole- is required. If a black hole was needed, this could be the first time, to our knowledge, in which it would be probed that a black hole coexists with a stellar cluster within the central 3 central pc of a galaxy. The first step is then to establish the contribution of the SSC to the overall spectral energy distribution, SED, of the core in NGC 4303.
3.1.1 X-ray emission associated to the core stellar population
The unresolved-core spectrum of NGC 4303 has a clear contribution from a thermal plasma whose temperature, T, of keV, agrees well with the temperatures found in other star-forming regions. In particular, this temperature agrees with the temperature found for one of the thermal components of the annular spectrum, kT. Its natural explanation is then that it corresponds to the X-ray emission of the nuclear star cluster detected in the UV.
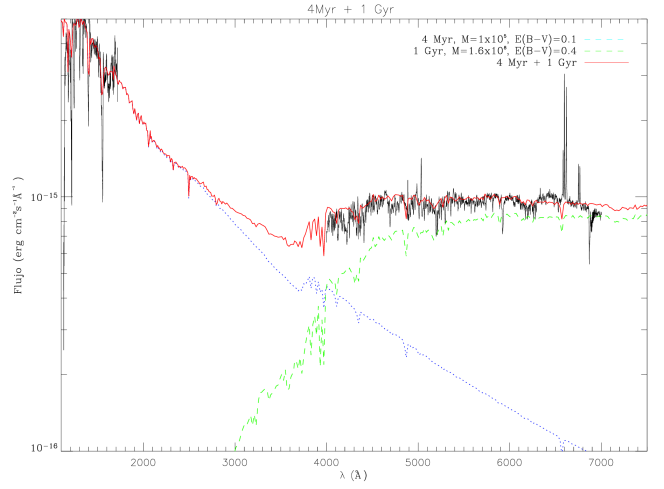
We present in Figure 7 the UV to optical spectral energy distribution of the core of NGC 4303 nuclear region (see Colina et al. (2002)). The UV STIS slit ( in diameter) is smaller than the optical aperture (1″1″), but since the central UV SSC is not resolved by STIS, we can assume that the STIS slit contains most of the core UV continuum. The analysis of the UV–optical SED clearly shows that different populations of stars are co-existing in this region: the very young super stellar cluster found by Colina et al. (2002), dominating the UV continuum, and an older population dominating the optical range.
According to Colina et al. (2002), the core SSC UV spectrum is well reproduced by a 4 Myr old synthetic instantaneous starburst of solar metallicity and with an initial mass of (for a Salpeter initial mass function, IMF, between 1 and 100 ) and obscured with E(B-V)=0.10 (Large Magellanic Cloud extinction law). This synthetic ultraviolet spectrum has been plotted in Figure 7 over the observed one. It can be seen in the figure that while the SSC completely dominates the UV continuum of the core region, it provides only a small fraction of the optical continuum and is negligible at IR wavelengths.
The optical continuum corresponds to an evolved population 1–5 Gyr old. We have plotted in Figure 7 a synthetic SED corresponding to a 1 Gyr old population, with initial mass around (for a Salpeter IMF between 1 and 100 ) and obscured with E(B-V)=0.4. The evolutionary synthesis models by Bruzual and Charlot have been used to perform the analysis (see Bruzual and Charlot (1993) and the ftp site ftp://gemini.tuc.noao.edu/pub/charlot/bc96). The fact that the young cluster is less affected by reddening than the old population seems to be normal in massive star-forming regions: the ionizing radiation and the release of mechanical energy by the massive cluster effectively ’clean up’ the surroundings of the massive stars, blowing the dust to certain distances (Maíz-Apellániz et al., 1998). We can see in the figure that the combination of the 4 Myr starburst and the 1 Gyr old population reproduces very well the UV–optical spectral energy distribution. Similar fits can be obtained assuming an older population up to 5 Gyr and different star formation scenarios (instantaneous, medium duration, continuously decreasing,…), with the initial mass of this old population being constrained in any case to the range 1–5 . The procedure shows that, in any case, an older population is dominating the optical continuum within the central 1″1″. Nevertheless, this combination of young and old population underestimates the observed near infrared emission. Colina and Wada (2000) measured an V–H around +3.5 in the core region, while an evolved population affected by a colour excess around 0.4 would have V–H around +2.5, at most.
This excess in H-band luminosity could be due to the presence of some red supergiant stars, as discussed in Colina et al. (2002). According to the predictions of evolutionary synthesis models (Cerviño and Mas-Hesse, 1994; Leitherer et al., 1999), the UV central cluster would be too young (around 4 Myr) to host a significant amount of red supergiants. The presence of red supergiants in a massive young cluster at solar metallicity peaks at around 10 Myr. This could be a hint that a previous star formation episode had taken place in the core of NGC 4303 nucleus some 10 Myr ago. If such a starburst would be present, it could contribute significantly to the hard X-ray emission, since at this age there is also a peak in the population of active high mass X-ray binaries (Cerviño, 1998). The initial mass of such a starburst, as required to reproduce the H band luminosity, would be around 5 . Such a starburst would produce a strong UV and optical continuum which has not been detected at all. If a 10 Myr old starburst were present, it should be completely obscured in the UV and optical ranges, which does not seem to be consistent with the extinctions derived from the young and old stellar populations. We conclude therefore that, although some red supergiants associated to the young cluster could already be present, there are no reliable hints of the presence of an intermediate age starburst around 10 Myr old.
Once the different populations within the core of NGC 4303 nucleus have been identified, we are able to estimate their associated X-ray emission. We have used for this purpose the CMHK evolutionary synthesis models (Cerviño (1998); Cerviño, Mas-Hesse, and Kunth (2002)222The models have been computed using tracks with enhanced mass-loss rates for a self-consistent comparison with Colina et al. (2002) and references therein; the results are available in the WWW server http://www.laeff.esa.es/users/mcs/SED/), which compute the expected X-ray emission (up to 10 keV) produced during a massive star formation episode, and originated by the diffuse gas heated by the release of mechanical energy, supernova remnants and binary systems. A correction factor of 0.735 has been applied to the model results for the transformation between the 2–120 M⊙ mass range to the 1–100 M⊙ mass range used in Colina et al. (2002), for a Salpeter IMF.
We have computed the X-ray luminosity associated to the 4 Myr cluster in the core of NGC 4303 nucleus. For this we have assumed the properties of the starburst derived by Colina et al. (2002) from the UV continuum, as discussed above. The total UV continuum within the core provides the absolute normalization for the CMHK models. The total X-ray emission is parameterized by 2 additional factors: the fraction of stars evolving in binary systems and the efficiency in conversion of mechanical energy into X-ray luminosity (by heating the diffuse gas). As discussed in Cerviño, Mas-Hesse, and Kunth (2002), the fraction of binary stars affects mainly the hard X-ray emission, while the efficiency parameters constrains basically the soft X-rays.
The predictions are compared in Table 5 with the soft and hard X-ray luminosities derived in previous sections. It can be seen that this young cluster could easily account for all the soft X-ray luminosity detected with Chandra, assuming a mechanical energy to X-rays conversion efficiency of around 15%. On the other hand, the observed hard X-ray emission would be underestimated by the models by around 2 orders of magnitude. Nevertheless, as discussed above, we can identify 2 different spectral components in the X-ray emission of NGC 4303 core, a thermal one well reproduced by a Raymond-Smith model, and a power law component. We show in Table 5 that the evolutionary synthesis model can reproduce in a consistent way both the soft and hard X-ray luminosity associated to the Raymond-Smith component in the core, assuming a rather low efficiency of around 3%. Cerviño, Mas-Hesse, and Kunth (2002) found values of this efficiency between around 10% and 90% (after correction from UV continuum reddening) in a sample of star forming galaxies. CMHK models do not include the details of the interaction between the high velocity gas released during a starburst episode and the interstellar medium. In principle, values of the efficiency between 0% (no interaction, and therefore no diffuse gas heating) and 100% (all the released mechanical heating the gas and being so converted in X-ray luminosity) would be physically possible. In the context of the analysis of the starburst–AGN connection, the CMHK models allow to estimate the maximum X-ray energy that could be attributed to a starburst episode (i.e., the luminosity obtained assuming a 100% efficiency). If the observed luminosity is below this value, no additional energy sources would be needed to explain it. Otherwise, if the predictions underestimate clearly the observations, even allowing for a 100% efficiency, this would support strongly the presence of an additional energy source, not directly related to the starburst process. We conclude therefore that the thermal X-ray emission in the core of NGC 4303 is most likely originated by the starburst episode taking place there.
On the other hand, a starburst episode at 4 Myr would be just starting to form high-mass X-ray binaries (HMXB). For a massive binary system to become active in X-ray emission, the more massive star should have finished its lifetime, leaving a compact component on which mass from the lower mass secondary would be able to accrete. HMXBs would therefore not be present in the cluster until the more massive stars have exploded as supernovae, i.e., not before the first 4–5 Myr. The evolution of HMXBs is included in the CMHK models (Cerviño, 1998; Cerviño, Mas-Hesse, and Kunth, 2002), but our results show that the X-ray luminosity associated to them will not be enough to account for the observed hard X-ray emission, whatever the binary fraction is assumed. Nevertheless, since the formation of the individual most massive stars, and thus HMXBs, is a highly stochastic process, Poissonian fluctuations might be very important. In Table 5 we have given the 90% confidence interval for the predicted X-ray luminosities (Cerviño, Valls-Gabaud, Luridiana, & Mas-Hesse (2002) describe how the sampling and Poissonian errors have been considered in the models). It can be seen that the range of luminosities within this confidence level is very large, so that the upper limit of the predictions could be marginally consistent with the observations.
We have checked the predictions of the CMHK models with the empirical calibration of the number of HMXB with erg s-1 vs. the star formation rate presented by Grimm, Gilfanov, and Sunyaev (2002). From the H luminosity within a aperture of 1.2 erg s-1 (Colina and Arribas, 1999), we derive a star formation rate yr-1, using the semiempirical calibration of Rosa-González, Terlevich, & Terlevich (2002). The calibration by Grimm, Gilfanov, and Sunyaev (2002) gives then a number of bright HMXB of around 0.04, which we consider negligible. Therefore, we conclude that the hard component detected in the core of NGC 4303 nucleus is probably not related to the 4 Myr starburst episode, although the high degree of uncertainty in these estimates does not allow us to reject this possibility.
Similarly, we have estimated the total X-ray luminosity that could be produced by the expected population of low-mass X-ray binaries (LMXBs) associated to the old 1–5 Gyr stellar population. We have done this by comparing with the known population of active LMXBs in our galaxy, which is estimated around 100, with X-ray luminosities erg s-1 (Persic and Rephaeli, 2002). Scaling the mass of the old population (, the exact value depends on the extrapolation of the IMF to low masses) with the mass of stars in the Galaxy (), we would expect at most 1 active LMXB, if any, associated to the old population in the core of NGC 4303. We conclude therefore that LMXBs are not the dominant contributors to the hard X-ray luminosity in the core of NGC 4303.
More detailed X-ray spectroscopy would be needed to identify the origin of this hard component. Our results favor an origin not connected with the core SSC, nor with the old population, although we cannot completely reject the possibility that it could be originated by some high-luminosity X-ray binaries.
3.1.2 Does the core of NGC 4303 also harbour an active nucleus?
The strongest evidence for the presence of a (hidden) active nucleus in NGC 4303 comes indeed from the X-ray observations presented here, as already advanced in Colina et al. (2002). The hard X-ray emission arising only from the unresolved core could well be due to a hidden AGN. However, both its luminosity ( erg s-1) and the flatness of its spectral shape (see the discussion below) can be used either as an argument or as a counter-argument for that hypothesis. In the following we discuss evidence for and against the co-existence of a nuclear black hole and the super star cluster in the nucleus of NGC 4303. We analyse the implications of the Chandra X-ray data by themselves, and also through a wider analysis of the multiwavelength spectrum of the core of this galaxy.
The hard X-ray tail of the core spectrum is formally fitted by a power law with photon index , which also contributes to the soft X-ray emission. This spectrum is rather flat when compared to typical radio quiet AGN and LINERs, i.e. in the range 1.7–2.3 e.g. (Reeves and Turner (2000); George et al. (2000); Georgantopoulos et al. (2002) and references therein). However, it is still formally compatible with 1.9 at 90% confidence level, given the large uncertainty. A fit with fixed to 1.9, to test the possibility of a highly absorbed AGN emission, gives statistically worse results, hence prevents us to take further conclusions. The low photons statistics does not allow either testing more sophisticated models like reflection by either cold or ionized warm gas. No counts are detected at the energy of the iron K emission. No sign of variability has been detected in the energy range between 1.5–10 keV during the 28600 s Chandra observation elapsed integration time.
The observed hard X-ray luminosity, after correction for line-of-sight absorption, erg s-1, is quite low for Seyfert 1 galaxies or quasars, that typically exceed erg s-1. Nevertheless, similar luminosities have been measured for a few low luminosity AGN or LINERS. The soft X-ray luminosities of LINERs as measured with ROSAT are in the range erg s-1 (Komossa et al., 1999). The ASCA, 2–10 keV, luminosity of a sample of 21 LINERs and 17 low-luminosity Seyferts range from to erg s-1, with part of the flux coming from a soft thermal component and part from a power law with (Terashima, Iyomoto, Ho, & Ptak, 2002). The lower end of the X-ray luminosity distribution is erg s-1 if only the power law contribution is considered. BeppoSAX observations of 6 type-2 LINER and transition galaxies show 2–10 keV luminosities in the range to erg s-1 (Georgantopoulos et al., 2002). Chandra has detected weak X-ray sources in the nuclei of some Seyfert galaxies, LINERs and LINER/H II transition objects (Ho et al., 2001). The 2–10 keV luminosities of their detected sources range from to erg s-1 and most of the non-detected ones are transition type objects. The median 2-10 keV luminosity of the objects which have clear classification as either LINER or Seyfert in the Ho et al. (2001) sample is erg s-1. The median luminosity of the clear Ho et al. (2001) LINERs is erg s-1 and of the Seyferts in their sample erg s-1. The core luminosity of NGC 4303 is at the lower end of the above distributions, compatible with low luminosity Seyfert or LINERs. The black hole mass requested to explain the observed X-ray luminosity is quite low for an AGN, only of M⊙. This mass is inferred using the bolometric correction () of 10 and an Eddington ratio () of 0.01, both quantities considered typical for low luminosity AGN (Awaki et al., 2001), together with the luminosity emitted by a black hole accreting at its Eddington luminosity: . An alternative possibility is that a higher mass black hole, with mass M⊙, similar to known Seyfert nuclei, does exist in the core of NGC 4303, but accreting with low radiative efficiency. Indeed, the flatness of the X-ray spectrum, , suggests the possibility that the nuclear emission could be due to the so-called Advection Dominated Accretion Flows, ADAF, (Rees et al., 1982; Narayan & Yi, 1995; Fabian & Rees, 1995). In this scenario, the hard X-ray component would be dominated by a bremsstrahlung thermal emission from a population of keV electrons which is therefore much harder than typically observed in Seyfert galaxies. This kind of accretion has been suggested as the origin of the hard X-ray emission detected in the elliptical galaxy NGC 1052, characterized by a flat spectrum with (Guainazzi et al., 2000). As shown above, a fit to the hard X-rays in NGC 4303 that includes a bremsstrahlung model gives an acceptable result. However, the best fit bremsstrahlung temperature, keV, is lower than the predictions of the ADAF scenario, although the uncertainties in the temperature make it compatible with a higher value, 70 keV, within 90% confidence. Therefore an ADAF is not favoured by the current data but cannot be discarded. The presence of spectral components with high absorption (N cm-2) cannot be excluded either, but there is at present no clear evidence for it as no good fit was achieved with the current Chandra data.
The data presented until now are not enough to elucidate between AGN or starburst origin of the hard X-ray core emission in NGC 4303. Multifrequency information is therefore needed.
A formal comparison of the UV-optical luminosity to the X-ray luminosity can be made through the so-called optical-to-X-ray spectral index . Using the UV emission at 2500 Å from Colina et al. (2002) and the 2 keV core emission from this paper, we obtain . The mean value of in radio quiet AGN is 1.48 (Laor et al., 1997), with typical values in the range 1.4 to 1.65 (Green et al., 1995). The value obtained for the core in NGC 4303 is therefore quite large, indicative of relatively weak X-ray emission compared to radio quiet AGN, either due to high absorption in the X-rays only or to a different origin of one or two of the components. This result is, of course, not surprising as Colina et al. (2002) have already shown that the UV flux in the core of NGC 4303 comes from starburst emission only. Another possible comparison is the 2–10 keV X-ray to H luminosity ratio. There is a good correlation between both quantities in Seyfert 1 galaxies and quasars that has been shown to extend down to low luminosity AGNs (Ho et al. (2001, and references therein) ). This is consistent with the optical lines being explained by photoionization from the central AGN continuum in both high and low luminosity AGNs. Ho et al. (2001), however, find that in some narrow-line objects in their sample of low luminosity AGN, the ratio is a factor 10 lower than expected by the above correlation. We have measured the ratio in the core of NGC 4303 using the H luminosity within a aperture of 1.2erg s-1 (Colina and Arribas, 1999) and the 2–10 keV flux in this paper. We obtain a value of , a factor 8 lower than expected from the best fit for type 1 objects in Ho et al. (2001), and also lower than their mean value for the type 2 objects in their sample with median and a large scatter. This result can be interpreted as the need of an additional ionizing source other than the X-ray emitting source to produce the observed H luminosity. This result is, again, not surprising, given that Colina et al. (2002) explain that the observed UV flux from the nuclear starburst provides enough ionizing photons to account for the observed H emission.
3.1.3 Can the hard X-ray emission be attributed to other sources?
As shown in Sec. 3.1.1, according to our current knowledge of the stellar evolution, there is only a marginal probability that in a very young cluster, as the one in the core of NGC 4303, high mass X-ray binaries have formed.
Nevertheless, non-nuclear point sources with similar hard X-ray luminosities have been detected in some X-ray images of nearby galaxies. Examples are the two brightest point sources in NGC 253 with mean luminosities of 9.5 and erg s-1, and flux variations of factor (Pietsch et al., 2001) and the most luminous X-ray source in M82 which is highly variable with a peak X-ray luminosity erg s-1 (Kaaret et al., 2001). Recently, Foscahini et al. (2002) have performed a study of ultraluminous X-rays sources in a sample of 10 nearby Seyfert galaxies. They have found 18 such sources, 10 of which have 2-10 keV luminosities similar to or larger than erg s-1, in some cases providing a larger contribution to the overall X-ray flux of the host galaxy than the active nucleus itself. The most plausible explanation for these bright sources according to Foscahini et al. (2002) is that they are accreting black holes X-ray binaries. If one of such sources is in the core of NGC 4303, in order to account for the hard X-ray emission detected with Chandra, the black hole component in the binary system should have a mass of M⊙, assuming it is radiating at its Eddington limit and isotropically. The black hole mass should be higher if the ratio of the bolometric to the hard X-ray luminosity is greater than 1, e.g. it is in AGN, or if the accretion is sub-Eddington.
The origin of ULX is nevertheless controversial, with different options listed, e.g. by Taniguchi et al. (2000) and commented here. Most of the ULX are located in regions of active star formation suggesting that there might be a physical link between both phenomena. It has already been suggested that those that are located near the dynamical centre of the host galaxy can be low luminosity AGN. This possibility for the NGC 4303 core has already been discussed in the previous subsection. Alternatives are related with very luminous supernova remnants expanding in a very dense medium and with accretion-powered binaries. In the latter case the compact component can either be similar to Galactic black hole candidates with masses up 10 M⊙ or a new population of intermediate-mass black holes (Colbert and Mushotzky, 1999). Most of the ULX detected so far are best explained in the context of accreting black holes, mainly because of the detection of flux variations in some of them and the fact that observed spectra are usually well fitted with multicolor disk blackbody emission and/or a power law as is the case for Galactic black holes. The unusually high innermost disk temperatures, 1.2–1.8 keV, are explained with black hole rotation (Makishima et al., 2000). There remains the question on whether the mass is similar to that in ordinary stellar mass black holes or whether it is higher, up to . The first case requires that the binary system is observed in an epoch of unusually high, even supercritical, accretion rate, and/or with a preferred orientation assuming beamed radiation (King et al., 2001; Zezas and Fabbiano, 2002; Roberts et al., 2002). In the second case, the main problem is how such intermediate-mass black holes can be formed. Taniguchi et al. (2000) propose that they are formed in very dense circumnuclear regions of galaxies where several hundreds of massive stars have evolved. The continuous merging of these compact remnants in years can led to the formation of intermediate-mass black holes. Alternative models proposed by Taniguchi et al. (2000) are interaction with a satellite galaxy or gas accretion onto a seed black hole.
We discuss here the possibility that the hard X-ray emission, in the core of NGC 4303 is an ULX due to one of such sources. Although we have discussed in Sect. 2.3.2 that models including multicolor disks do not reproduce satisfactorily the observations, Strickland et al. (2001) and Roberts et al. (2002) show that the analysis of ULX Chandra spectra favors simple power laws with index spaned in a range of 1.8-2.9, which would be consistent with the index of the power law of the best fit model for the core region, . The position of the ULX is coincident with the stellar cluster located in the very centre of the galaxy, but as has been discussed in Sec. 3.1.1, the cluster is too young and even the most massive stars are not expected to have exploded as supernovae. Therefore it is very unlikely that the origin of the ULX is from the young stellar cluster itself. There remains still the possibility that the black hole is the remnant from a supernova explosion from the 1-5 Gyr old population also present in the nucleus of the galaxy (Sec. 3.1.1). If this population contained a few stars of more than , they should have completed their evolution in the first yr and left a few compact remnants of at least 2 M⊙. Then it is possible that at least one of them has experienced disk accretion in the remaining life time of the cluster and increased its mass to . The strong star formation activity in the nuclear region of NGC 4303 suggests that there is enough gas to feed the black hole accretion. One can also speculate that intermediate-mass black holes could have been formed in one of the stellar clusters in the vicinity of the NGC 4303 core, following the mechanism suggested by Taniguchi et al. (2000) provided there is at least one cluster that is old and dense enough, and sink down to the core via dynamical friction.
We can therefore conclude that, even if there is no definite evidence for it, the hard X-ray source in the core of NGC 4303 could be similar to the ULX found in other galaxies and explained in most of the cases with accreting binaries, in which the compact object is either a or an intermediate-mass black hole.
3.2 The annular region
We have also applied the CMHK models to the annular region. Colina et al. (2002) found that the brightest circumnuclear star-forming knot could be fitted by a M⊙ 3.5 Myr old starburst, affected by an internal absorption with E(B-V) around 0.1 (Large Magellanic Cloud extinction law). As a first approximation, we have assumed a similar evolutionary stage for all circumnuclear starburst, and have normalized the UV luminosity to the overall luminosity at 2117 Å within an annulus with internal and external radii of 05 and 4″, respectively, as measured by Colina et al. (1997). This region contains indeed most of the UV continuum luminosity, as can be appreciated in Figure 3.
We compare in Table 5 the observed soft and hard X-ray luminosities of this annular region, as measured on Chandra images, with the predictions from the CMHK models for a young 3.5 Myr star formation episode having transformed 5 into stars. It can be seen that the emission associated to these star formation knots accounts for both the soft and hard X-ray emission observed with Chandra, assuming a mechanical energy to X-rays conversion efficiency of around 30% . While the model predictions seem to underestimate the hard X-ray emission by a factor around 2.5, we consider the discrepancy negligible when compared to the accuracy of both the hard X-ray measurements and the model estimates (the observed hard X-ray luminosity given in Table 5 comes from the model extrapolation of the thermal components detected in soft X-rays). No additional components would be required to explain the X-ray emission from the annulus. Moreover, the fact that there are no high-luminosity binaries associated to the circumnuclear starbursts, although the total mass and age is similar to that of the core SSC, supports our previous conclusion that the hard X-ray core component is not associated to the core starburst, either.
We want finally to stress that most of the soft X-ray emission in the nuclear region of NGC 4303 (including both the annulus and the core) seems therefore to be associated with star formation episodes. As concluded by Cerviño, Mas-Hesse, and Kunth (2002), this could be the case for many low luminosity active galaxies, especially for a significant fraction of Seyfert 2 galaxies. The presence of a hidden active nucleus in these galaxies could therefore be inferred only from its emission at higher energies, or from its indirect effects on the optical emission line spectra. Jiménez-Bailón, Mas-Hesse, and Santos-LLeó (2003) show indeed that even in the case of the prototype of Seyfert 2 galaxy, NGC 1068, both the UV continuum and the soft X-ray emission seem to be dominated (or at least contributed with a significant fraction) by compact star forming episodes within less than 10 pc from its core. Georgantopoulos et al. (2002) also conclude that the bulk of the nuclear X-ray emission in the low luminosity AGN NGC 3627 and NGC 5195 originates in their (circum-)nuclear star-forming regions.
4 Conclusions
Chandra X-ray images of the low luminosity AGN NGC 4303 have allowed to resolve the X-ray emission originated in the core (5) from the surrounding annular region (9). The astrometry of the Chandra core coincides to less than 03 with the position of the ultraviolet core. While the X-ray emission of the annular region is well reproduced assuming 2 thermal Raymond-Smith components, the best fit for the core region requires both a thermal and a power law component. Most of the overall soft X-ray luminosity from the nucleus of NGC 4303 is emitted by the surrounding annular region (70%), with a minor fraction originating within the core. On the other hand, more than 90% of the hard X-ray nuclear emission is produced within the unresolved core.
Our results show that most of the soft X-ray energy from the central region of NGC 4303 is associated to massive star-forming episodes. Evolutionary synthesis models show that the total soft and hard X-ray emission originated in the annular region is associated to the massive star-forming knots identified there by STIS-HST UV imaging and spectroscopy. Similarly, the young massive stellar cluster identified within the core region can also account for the emission from the Raymond-Smith core component. On the other hand, evolutionary synthesis models underestimate by at least one order of magnitude the core hard X-ray emission which is modeled by a rather flat power law. It should be noted, however, that the large uncertainties, both in the measurements and in the predictions of the evolutionary synthesis model hard X-ray values, make both luminosities marginally compatible at the 90% confidence level.
The most striking result is the detection of the hard X-ray tail in the core emission of NGC 4303, with a luminosity of erg s-1, intermediate between the expected values in standard AGN and pure starburst galaxies and normal for LINERs. The results of the evolutionary synthesis models do not allow to exclude the presence of a few high-luminosity black-hole binaries within the core (the predictions within a 90% confidence level would be marginally consistent with the observations), but the models show that this is not a very likely scenario. We have to look for other alternatives. One obvious solution for the origin of the hard X-rays is the presence of a hidden low luminosity AGN. It has been discussed that the observed properties (luminosity, spectral shape, X-ray to H luminosity ratios) are similar to some type-2 low luminosity LINERs or even low luminosity Seyfert 2, like those in the Ho et al. (2001) sample. We have shown that the observations are just compatible with different AGN scenarios: a highly absorbed (N cm-2) nuclear emission, a low mass AGN (M) or a higher mass black hole, but accreting with very low radiative efficiency like in the ADAF scenario. If NGC 4303 indeed harbours a low luminosity AGN, it would be the first one to our knowledge where an additional source, a super stellar cluster, has been detected in the very nucleus and co-exists with the AGN in the central 3 pc.
The alternative to a low luminosity AGN is that the nuclear stellar cluster is the only ionizing source, while the hard X-ray luminosity comes from a source similar to the ultraluminous X-ray point-like off-nuclear sources, ULX, detected in a number of nearby galaxies. The suggested origin for such ULX sources is accretion onto a black hole binary, which for NGC 4303 requires a black hole mass of at least M⊙. In this context it is interesting to note that recently, Weaver (2001) speculated with the idea that such ULX black holes may be the precursors to AGN activity. According to Weaver (2001) (and the references she mentions), if born in dense star clusters near the centers of galaxies, ULX black holes could sink to the core via dynamical friction, eventually growing into a supermassive black hole. In NGC 4303 the dense stellar cluster is already at the core of the galaxy and an ULX might also be there and ready to grow fed by the starburst itself. Are we looking at the nucleus of a galaxy in the phase preceding the birth of a ’normal’-luminosity AGN powered by a supermassive black hole ? Only better signal to noise observations of its high-energy emission and its indirect effects on the emission lines could provide further clues.
References
- Awaki et al. (2001) Awaki, H., Terashima, Y., Hayashida, K., Sakano, M., 2001, PASP 53, 647
- Bruzual and Charlot (1993) Bruzual A., G. & Charlot, S. 1993, ApJ, 405, 538
- Cerviño and Mas-Hesse (1994) Cerviño, M. & Mas-Hesse, J.M. 1994, A&A, 284, 749
- Cerviño (1998) Cerviño, M. 1998, Doctoral Thesis, Universidad Complutense, Madrid
- Cerviño, Valls-Gabaud, Luridiana, & Mas-Hesse (2002) Cerviño, M., Valls-Gabaud, D., Luridiana, V., & Mas-Hesse, J. M. 2002, A&A, 381, 51
- Cerviño, Mas-Hesse, and Kunth (2002) Cerviño M., Mas-Hesse. J. M. & Kunth, D. 2002 A&A,392, 19,(CMHK)
- Colbert and Mushotzky (1999) Colbert, E.J.M., Mushotzky, R.F., 1999, ApJ, 519, 89
- Colina et al. (1997) Colina, L., Garcia-Vargas, M. L., Mas-Hesse, J. M., Alberdi, A. & Krabbe A. 1997 ApJ, 484, L41
- Colina and Arribas (1999) Colina, L.& Arribas, S. 1999 ApJ, 514, 637
- Colina and Wada (2000) Colina, L.& Wada, K. 2000 ApJ, 529, 845
- Colina et al. (2002) Colina, L. & Gonzalez Delgado, R., Mas-Hesse, M., Leitherer, C., Jimenez-Bailón, E., 2002, ApJ, 579, 545
- Fabian & Rees (1995) Fabian, A.C., Rees, M.J., 1995, MNRAS, 277, L55
- Filippenko & Sargent (1985) Filippenko, A.V., Sargent, W.L.W., 1985, ApJS, 57, 503
- Foscahini et al. (2002) Foschini, L., Di Cocco, G., Ho, L.C., et al., 2002, A&A, 392, 817
- Gehrels (1986) Gehrels, N. 1986, ApJ, 303, 336
- George et al. (2000) George, I.M., Turner, T.J., Yaqoob, T., Netzer, H., Laor, A., Mushotzky, R.F., Nandra, K., Takahashi, T., 2000, ApJ, 531, 52
- Georgantopoulos et al. (2002) Georgantopoulos, I., Panessa, F., Akylas, A., Zezas, A., Cappi, M. Comastri, A. 2002, A&A, 386, 60
- Green et al. (1995) Green, P.J., et al. 1995, ApJ 450, 51
- Grimm, Gilfanov, and Sunyaev (2002) Grimm, H.-J., Gilfanov, M., Sunyaev, R., 2002, MNRAS, in press (astro–ph/0205371)
- González Delgado et al. (1998) González Delgado, R. M., Heckman, T., Leitherer, C., Meurer, G., Krolik, J., Wilson, A. S., Kinney, A., & Koratkar, A. 1998, ApJ, 505, 174
- Guainazzi et al. (2000) Guainazzi, M., Oosterbroek, T., Antonelli, L.A., Matt, G., 2000, A&A, 364, L80
- Haberl, Dennerl, and Pietsch (2002) Haberl, F., Dennerl, K., & Pietsch, W., 2002, A&A, in press, preprint (astro-ph/0212319)
- Heckman et al. (1997) Heckman, T. M., González-Delgado, R., Leitherer, C., Meurer, G. R., Krolik, J., Wilson, A. S., Koratkar, A., & Kinney, A. 1997, ApJ, 482, 114
- Ho et al. (2001) Ho, L.C., Feigelson, E.D., Townsley, L.K., 2001, ApJ, 549, L51
- Jiménez-Bailón, Mas-Hesse, and Santos-LLeó (2003) Jiménez-Bailón, E., Mas-Hesse, J.M. & Santos-Lleó, M. 2003, in preparation
- Kaaret et al. (2001) Kaaret, P., Prestwich, A. H., Zezas, A., Murray, S. S., Kim, D.-W., Kilgard, R. E., Schlegel, E. M., & Ward, M. J. 2001, MNRAS, 321, L29
- King et al. (2001) King, A., Davies, M.B., Ward, M.J., Fabbiano, G., Elvis, M., 2001, ApJ, 552, L109
- Komossa et al. (1999) Komossa, S., Böhringer, H., & Huchra, J. P. 1999, A&A, 349, 88
- Laor et al. (1997) Laor, A., Fiore, F., Elvis, M., Wilkes, B.J., McDowell, J.C. 1997, ApJ 477, 93
- Leitherer et al. (1999) Leitherer, C., Schaerer, D., Goldader, Jeffrey D., González-Delgado, R., Robert, C., Kune, D.F., de Mello, D.F.; Devost, D., Heckman, T.M. 1999, ApJS, 123, 3
- Levenson, Weaver, and Heckman (2001) Levenson, N. A., Weaver, K. A., and Heckman, T. M. 2001, ApJS, 133, 269
- Maíz-Apellániz et al. (1998) Maíz-Apellániz, J., Mas-Hesse, J. M., Muñoz-Tuñón, C., Vilchez, J. M. and Castaneda, H. O., Y. 1998, A&A, 329, 409-430
- Makishima et al. (2000) Makishima, K. et al. 2000, ApJ, 535, 632
- Martin & Roy (1992) Martin, P. & Roy, J. 1992, ApJ, 397, 463
- Mas-Hesse et al. (1995) Mas-Hesse, J. M., Rodríguez-Pascual, P. M., Sanz Fernández de Córdoba, L., Mirabel, I. F., Wamsteker, W., Makino, F. Otani, C. 1995, A&A, 298, 22
- Mitsuda et al. (1984) Mitsuda, K. et al. 1984, PASJ, 36, 741
- Moshir et al. (1990) Moshir, M. et al. 1990, BAAS, 22, 1325
- Narayan & Yi (1995) Narayan, R., Kato, S., Honma, F., 1997, ApJ, 452, 710
- Persic and Rephaeli (2002) Persic, M. & Rephaeli, Y. 2002, A&A, 382, 843
- Pietsch et al. (2001) Pietsch, W., Roberts, T.P., Sako, M., et al. 2001 A&A 365, L174
- Rees et al. (1982) Rees, M.J., Phinney, E.S., Begelman, M.C., Blandford, R.D., 1982, Nat, 295, 17
- Reeves and Turner (2000) Reeves, J.N., Turner, M.J.L., 2000, MNRAS, 316, 234
- Roberts et al. (2002) Roberts, T.P., Warwick, R.S., Ward, M.J., Murray, S.S., 2002 MNRAS, 337, 677
- Rosa-González, Terlevich, & Terlevich (2002) Rosa-González, D., Terlevich, E., Terlevich, R. 2002, MNRAS, 332, 283
- Sasaki, Pietsch, and Haberl (2003) Sasaki,M., Pietsch, W., & Haberl,F., 2003, A&A, in press, preprint (astro-ph/0303494)
- Schlegel, Finkbeiner, and Davis (1998) Schlegel, D. J., Finkbeiner, D. P., & Davis, M. 1998, ApJ, 500, 525
- Strickland et al. (2001) Strickland, D. K., Colbert, E. J. M., Heckman, T. M., Weaver, K. A., Dahlem, M., & Stevens, I. R. 2001, ApJ, 560, 707
- Taniguchi et al. (2000) Taniguchi, Y., Shioya, Y., Tsuru, T.G., Ikeuchi, S., 2000, PASJ, 52, 533
- Terashima, Iyomoto, Ho, & Ptak (2002) Terashima, Y., Iyomoto, N., Ho, L. C., & Ptak, A. F. 2002, ApJS, 139, 1
- Tschöke, Hensler, and Junkes (2000) Tschöke, G., Hensler, G. & Junkes, N. 2000 A&A, 360, 447
- Weaver (2001) Weaver, K.A., 2001, in The Central kiloparsec of Starburst and AGN: The La Palma Connection, ASP Conference Series, preprint (astro-ph 0108481)
- Zezas and Fabbiano (2002) Zezas, A. & Fabbiano, G., 2002, ApJ, 577, 726


| Source | RA | DEC | Csoft | CRsoft | L | L | L | Chard | CRhard | L | L | L |
|---|---|---|---|---|---|---|---|---|---|---|---|---|
| (J2000) | (J2000) | |||||||||||
| a∗ | 12 | 4 | 24 6 | 8.6 2.2 | 1.3 | 0.80.2 | 1.20.3 | 9 4 | 3.3 1.6 | 0.8 | 0.50.2 | 0.6 0.3 |
| b∗ | 12 | 4 | 8510 | 30.4 3.7 | 4.7 | 2.80.3 | 4.10.5 | 21 5 | 7.6 2.1 | 1.9 | 1.10.3 | 1.3 0.4 |
| c∗ | 12 | 4 | 35 7 | 12.6 2.6 | 1.9 | 1.20.2 | 1.70.3 | 7 4 | 2.6 1.5 | 0.6 | 0.40.2 | 0.4 0.3 |
| d∗ | 12 | 4 | 12 4 | 4.4 1.7 | 0.7 | 0.40.2 | 0.60.2 | - | - | - | - | - |
| e+(E,12) | 12 | 4 | 8510 | 30.4 3.8 | 4.7 | 2.80.3 | 4.10.5 | 27 6 | 9.8 2.3 | 2.5 | 1.40.3 | 1.7 0.4 |
| f+(E,12) | 12 | 4 | 62 9 | 22.1 3.3 | 3.4 | 2.00.3 | 3.00.4 | 38 7 | 13.7 2.7 | 3.4 | 2.00.4 | 2.4 0.5 |
| g+(A) | 12 | 4 | 8810 | 31.4 3.8 | 4.9 | 2.90.3 | 4.20.5 | 9 4 | 3.4 1.6 | 0.8 | 0.50.2 | 0.6 0.3 |
| h+(C) | 12 | 4 | 9611 | 34.3 4.0 | 5.3 | 3.20.4 | 4.60.5 | 33 7 | 11.9 2.5 | 3.0 | 1.70.4 | 2.0 0.4 |
| i+(C) | 12 | 4 | 31 7 | 11.1 2.5 | 1.7 | 1.00.2 | 1.50.3 | 4 3 | 1.6 1.4 | 0.4 | 0.20.2 | 0.3 0.2 |
| j+(B,9) | 12 | 4 | 11211 | 40.0 4.2 | 6.2 | 3.70.4 | 5.40.6 | 10 4 | 3.7 1.7 | 0.9 | 0.50.2 | 0.6 0.3 |
| k+ | 12 | 4 | 18 5 | 6.4 2.1 | 1.0 | 0.60.2 | 0.90.3 | 22 6 | 8.0 2.2 | 2.0 | 1.20.3 | 1.4 0.4 |
| l† | 12 | 4 | 26 6 | 9.4 2.3 | 1.5 | 0.90.2 | 1.30.3 | 10 4 | 3.8 1.7 | 0.9 | 0.50.2 | 0.6 0.3 |
| m+(D,11) | 12 | 4 | 12512 | 44.6 4.4 | 6.9 | 4.10.4 | 6.00.6 | 19 5 | 6.9 2.1 | 1.7 | 1.00.3 | 1.2 0.4 |
| o† | 12 | 4 | 12412 | 44.4 4.4 | 6.9 | 4.10.4 | 6.00.6 | 18 5 | 6.6 2.1 | 1.7 | 0.90.3 | 1.1 0.4 |
| p††(8) | 12 | 4 | 18014 | 64.4 5.2 | 10.0 | 5.90.5 | 8.70.7 | 34 7 | 12.3 2.6 | 3.1 | 1.80.4 | 2.1 0.4 |
| q†† | 12 | 4 | 41 7 | 14.8 2.7 | 2.3 | 1.40.2 | 2.00.4 | 16 5 | 5.9 2.0 | 1.5 | 0.80.3 | 1.0 0.3 |
| r†† | 12 | 4 | 11 4 | 4.1 1.7 | 0.6 | 0.40.2 | 0.60.2 | 11 4 | 4.1 1.8 | 1.0 | 0.60.3 | 0.7 0.3 |
Note. — The coincidence, if any, with a known ROSAT source is also shown in brackets following the nomenclature in Tschöke, Hensler, and Junkes (2000). The soft band corresponds to 0.23-2 keV and the hard band to 2-10 keV. The luminosities, L1, have been calculated using a power law index of 1.20.2 for the 2-10 keV band, the errors have been derived from the uncertainty in the power law index; for the 0.23-2 keV band, the luminosities have been derived from the ECF, calculated through the spectral analysis of the m source. The luminosities marked with L2 and L3 have been calculated using power law index of 1.6 and 2.9, respectively, (see Section 2.2.1 for details). The errors have been derived from the count rate errors. The net counts of these sources marked with ∗ have been calculated using background 1, + for background 2, † background 3 and †† background 4. Luminosities have been estimated in a different way for the soft and hard band, see the text for details.
| Model | Galactic | Component I | Component I | Component I | Component II | Component II | dof | |
|---|---|---|---|---|---|---|---|---|
| nH | nH | /kT/Tin | Norm | kT | Norm | |||
| (1) | (2) | (3) | (4) | (5) | (6) | (7) | ||
| phabs(pwlw) | 1.67 1020(frozen) | 1.8 | 7.2 | 2.4 | 6 | |||
| phabs(ray) | 1.67 1020(frozen) | 5 | 2.5 | 3.3 | 6 | |||
| phabs(pwlw+ray) | 1.67 1020(frozen) | 1.1 | 4 | |||||
| phabs(ray+bremss) | 1.67 1020(frozen) | 0.99 | 4 | |||||
| phabs(phabs*pwlw+ray) | 1.67 1020(frozen) | 1020 | 1.9(fixed) | 1.34 | 4 | |||
| phabs(mdc) | 1.67 1020(frozen) | 0.9 | 3.9 | 6 | ||||
| phabs(pwlw+mcd) | 1.67 1020(frozen) | 1.9 | 1.4 | 3.5 | 4 |
Note. — Col. (1)- Spectral models: phabs: Photoelectric Absorption, pwlw: Power Law, ray: Raymond-Smith, bremss: Thermal Bremsstrahlung, mcd: Multi-color disk
Col. (2)- Column density in units of cm-2
Col. (3)- Column density in units of cm-2
Col. (4)- Value of relevant parameter of the first component. kT of thermal components and Tin of the Multi-color disk model in units of keV. The index, , for the power law.
Col. (5)- Units of the normalization of the first component. Power Law: , Raymond-Smith: , Thermal Bremsstrahlung: , Multi-color disk:
Col. (6)- Units of the second component in keV
Col. (7)- Units of the normalization of the second component, (see Col 5).
| Model | Galactic | Component I | Component I | Component I | Component II | Component II | dof | |
|---|---|---|---|---|---|---|---|---|
| nH | nH | /kT | Norm | /kT | Norm | |||
| (1) | (2) | (3) | (4) | (5) | (6) | (7) | ||
| phabs(pwlw) | 8 1021 | 7.2 | 1.8 | 7.9 | 9 | |||
| phabs(ray) | 9 1020 | 0.8 | 1.3 | 4.3 | 9 | |||
| phabs(phabs*ray+pwlw) | 1.67 1020(frozen) | 1021 | 0.26 | 1.12 | 7 | |||
| phabs(phabs*ray+ray) | 1.67 1020(frozen) | 1021 | 0.70 | 7 |
Note. — Col. (1)- Spectral models: phabs: Photoelectric Absorption, pwlw: Power Law, ray: Raymond-Smith
Col. (2)- Column density in units of cm-2
Col. (3)- Column density in units of cm-2
Col. (4)- Value of relevant parameter of the first component. kT for thermal components in keV and the index, , for the power law.
Col. (5)- Units of the normalization of the first component. Power Law: , Raymond-Smith:
Col. (6)- Units of the second component, (see Col 4)
Col. (7)- Units of the normalization of the second component, (see Col 5).
| F | F | L | L | |||
|---|---|---|---|---|---|---|
| ( erg cm-2s-1) | ( erg cm-2s-1) | () | ( ) | |||
| Core | ||||||
| Power Law | 70 | 100 | ||||
| Raymond-Smith | 30 | 0.5 | ||||
| Annulus | ||||||
| Raymond-Smith I | 20 | 1 | ||||
| Raymond-Smith II | 80 | 99 | ||||
| Central | ||||||
| Total | - | - |
Note. — The table contains the values for the luminosities and fluxes in the energy bands 0.2-2 keV and 2-10 keV of the two regions and the contributions of each of their components. (*) Fluxes and luminosities estimated by extrapolation of best fit models.
| Region | L | L | Efficiency |
|---|---|---|---|
| ( ) | ( ) | ||
| Core(total) | - | ||
| Core(total) | 0.15 | ||
| Core(RS comp) | - | ||
| Core(RS comp) | 0.03 | ||
| Annulus | - | ||
| Annulus | 0.29 |