Widespread acetaldehyde near the Galactic Centre
Abstract
We present Giant Meterwave Radio Telescope images of the 1065 MHz emission from the 110 rotational transition of acetaldehyde (CH3CHO) in the molecular cloud complex Sgr B2. Our observations are unique in that they have a high spatial resolution (), while still being sensitive to large-scale emission. Most complex organic molecules in this cloud (e.g. acetone, methyl formate, acetic acid) are concentrated in a very small core, pc across. In contrast, acetaldehyde is found to be spread over a region at least 100 times larger in extent. The line emission is confined to regions with radio continuum emission and correlates well (in both position and velocity) with formaldehyde absorption towards this continuum; this is consistent with earlier single dish results suggesting that it is likely to be weakly mased. Our observations also suggest that grain mantle destruction by shocks plays an important role in the observed gas phase abundance of CH3CHO in Sgr B2.
Key Words.:
Galaxy: centre – ISM: clouds – ISM: molecules – Astrochemistry – radio lines: ISM1 Introduction
The giant molecular cloud complex Sgr B2 is one of the most interesting regions in the Galaxy. Located close to the Galactic Centre, the complex is undergoing extensive star formation and hosts a myriad of large molecules, many of which have not been detected elsewhere in the Galaxy. Most of the complex organic molecules found here are confined to a compact (size pc) region called the Large Molecular Heimat (LMH) (e.g. Miao et al. (1995); Mehringer et al. (1997); Snyder et al. (2002)). This is in keeping with models of the formation of complex molecules, according to which these molecules are either directly formed on the surfaces of dust grains or are formed from seed molecules which are themselves formed on grain surfaces (e.g. Charnley et al. (1992, 1995)). When these dust grains are heated (typically by radiation from hot stars that form in molecular cloud cores), the grain mantles evaporate, releasing the molecules in gaseous form. Further, in time dependent astro-chemical models, these molecules are rapidly destroyed either by photodissociation or by collisions with other molecules. As a result, complex organic molecules are generally found only in hot molecular cloud cores.
Recently, however, there have been indications that some large organic molecules are more wide-spread in the Sgr B2 cloud than was hitherto believed. A comparison of the measured flux density from single dish and interferometric observations of the millimetre wavelength emission from glycolaldehyde suggests that the molecule is distributed over a region at least pc in size (Hollis et al. (2001)). However, no direct images of its spatial distribution are available. Similarly, emission studies of ethanol towards selected regions around Sgr B2 indicate that it too is likely to be wide-spread in this region, but again, no direct images are available for this molecule (Martín-Pintado et al. (2001)).
We present here wide field Giant Meterwave Radio Telescope (GMRT) images of the 1065 MHz 110 K transition of acetaldehyde (Kleiner et al. (1996)) towards Sgr B2; this transition was originally detected towards Sgr B2 by Gottleib (1973), using a single dish telescope. Acetaldehyde is one of the molecules whose interstellar production mechanism is presently quite unclear, placing strong constraints on models of interstellar chemistry. It has been found so far in both cold dust clouds as well as in hot cores (Ikeda et al. (2001); Matthews et al. (1985)). Towards the Galactic Centre, it has been detected at mm wavelengths in Sgr B2(N) (Ikeda et al. (2001)), along with its isomers vinyl alcohol and ethylene oxide (Dickens et al. (1997); Turner et al. (2001)). Interferometric observations of the 1065 MHz transition were not possible until very recently, as there were no telescopes equipped with receivers at this frequency. The newly comissioned GMRT does operate at this frequency, however, and, unlike millimetre-wave interferometers, provides both a (relatively) large field of view as well as high spatial resolution. Our images show direct evidence for the presence of acetaldehyde over a large region in Sgr B2.
2 Observations and Data Analysis
The GMRT (Swarup et al. (1991)) observations were carried out on 12 May 2001, during the commissioning phase of the telescope. The array has a hybrid configuration with 14 of its 30 antennas located in a central compact array with size 1 km ( 3.5 k at 1065 MHz) and the remaining antennas distributed in a roughly “Y” shaped configuration, giving a maximum baseline length of 25 km ( 90 k at 1065 MHz). The baselines between antennas in the central array are similar in length to those of the “D” array of the VLA while the baselines between the arm antennas are comparable to those of the VLA “B” array. An observing bandwidth of 1 MHz ( km/s) was used for the CH3CHO observations, centered at 1065.075 MHz, the line rest frequency (Gottlieb (1973); Kleiner et al. (1996)). The band was divided into 128 spectral channels, giving a channel spacing of km s-1. The standard calibrators 3C286 and 3C48 were observed at the start and end of the run respectively in order to set the absolute flux density scale and also to determine the bandpass shape, while the compact source 1751253 was used for phase calibration. The total on-source time was hours. In a later, short observing run, the system temperature was measured towards the calibrators as well as the source by firing noise diodes.
The data were converted from the raw telescope format into FITS and then analyzed in AIPS. After editing the obviously bad data, the flux density scale and instrumental phase were calibrated using standard AIPS procedures. Care was also taken to account for the fact that the system temperature in the direction of Sgr B2 is higher than that towards the flux or phase calibrators (due to the wide-spread continuum emission from the environs of Sgr B2 and its proximity to the Galactic Centre). After the initial calibration, a continuum image was made using the line-free channels and used to self-calibrate the U-V visibilities. This was carried out in an iterative manner until the quality of the image was found to not improve on further self-calibration. The continuum emission was then subtracted from the multi-channel U-V data set and the continuum-subtracted data mapped in all channels; any residual continuum was then subtracted in the image plane by fitting a linear baseline to line-free regions.
The hybrid configuration of the GMRT array implies that a single GMRT observation yields information on both small and large angular scales. Image cubes were therefore made at various (U,V) ranges and analysed separately. The low resolution images (such as Fig. 1) were deconvolved using the standard CLEAN deconvolution algorithm to produce the final spectral cube. However, at the highest resolutions (such as that of Fig. 3), the signal to noise ratio (SNR) is too low and the emission too diffuse for the CLEAN algorithm to work reliably; this image has hence not been deconvolved. Despite this, the low SNR of this image implies that the inability to deconvolve it does not greatly degrade its dynamic range or fidelity; the morphology of the emission should hence be accurately traced, apart from an uncertainty in the scaling factor (this essentially arises because the main effect of deconvolving weak emission at about the noise level corresponds to multiplying by a scale factor; Jörsäter & van Moorsel (1995); Rupen (1999)).
3 Results and Discussion
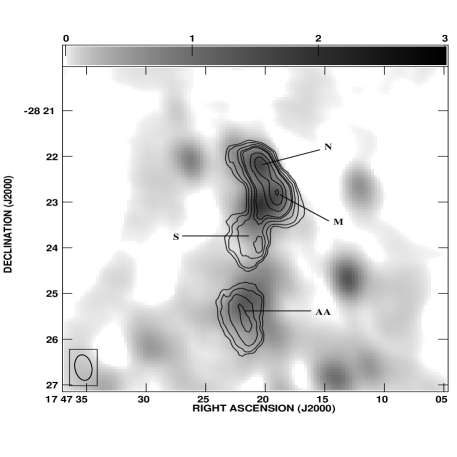

CH3CHO emission was detected from Sgr B2 over the LSR velocity range km s-1. Fig. 1 shows the integrated emission from this entire velocity range (contours) overlaid on the continuum emission at 1065 MHz (grey scale). We detect emission from the regions Sgr B2 north (N), main (M) and south (S), as well as from a location to the south of Sgr B2 (N) (which is labelled AA in Fig. 1 after Mehringer et al. 1993). The spectra of these regions (Fig. 2) show a systematic velocity gradient in the north-south direction, with Sgr B2 (N) showing emission up to an LSR velocity of km s-1 and Sgr B2 (AA) having emission centered at km s-1. A similar gradient is seen in several molecular species associated with Sgr B2, e.g. HC3N and CH3CN (de Vicente et al. (1997)) and H2CO (Rogstad et al. (1974), Martín-Pintado et al. (1990), Mehringer et al. (1995)). We do not detect any CH3CHO emission towards Sgr B1, although it lies within our field of view and our observing frequency band is sufficiently wide to include any emission associated with it.
The other noteworthy feature of Fig. 1 is that the line emission is confined to regions with continuum emission. This implies that either the CH3CHO emission is mased or that the gas which produces the CH3CHO emission is closely associated with that producing the radio continuum. However, the velocities of the CH3CHO emission match those of the formaldehyde (H2CO) absorption in the different regions (Martín-Pintado et al. (1990); Mehringer et al. (1995)), showing that the CH3CHO emitting clouds lie in front of the HII regions which are the source of the radio continuum. In the absence of masing, this would require fine-tuning of physical conditions to ensure the excitation of gas only in clouds in front of the continuum sources (the parent gas cloud, as traced by the CH3CN and HC3N emission, is more extended than the region showing CH3CHO emission; de Vicente et al. (1997)). The observed line to continuum ratio in all four regions is , consistent with the CH3CHO emission being weakly mased (the continuum flux densities of the regions over which the spectra in Fig. 2 were extracted are listed in the figure caption). Note, however, that the continuum emission in Sgr B2 is considerably more extended than the line emission (and hence more resolved out in our interferometric observations); the measured line to continuum ratios in our maps are thus upper limits on the true line to continuum ratios. Our conclusion that the observed emission is mased is consistent with that of Fourikis et al. (1974), who found that the relative intensities of the and lines could only be explained if the former line is weakly mased.
Fig. 3 is a high resolution () image of the velocity integrated CH3CHO emission. Sgr B2 (AA) is not detected at this high resolution. The emission correlates very well with the high resolution images of 4.8 GHz formaldehyde absorption (Whiteoak & Gardener (1983)), the 6.7 GHz methanol absorption (Houghton & Whiteoak (1995)) and the quasi-thermal 44 GHz methanol emission (Mehringer & Menten (1997)). It also overlaps with the star forming ridge recently detected via emission from vibrationally excited HC3N in Sgr B2 (de Vicente et al. (2000)).

Fig. 1 shows clearly that, unlike most other large organic molecules, CH3CHO is wide-spread in Sgr B2. The angular extent of the emission is, in fact, reasonably close to that assumed by Fourikis et al. (1974) in their computation of the excitation temperature and column density of CH3CHO. If we assume that the transition of CH3CHO observed by Fourikis et al. (1974) is thermalized and has an excitation temperature of K, we can use their eqn. (3) to obtain a CH3CHO column density of cm-2 in the level. On the other hand, the column density in the 111 level of H2CO is cm-2 (Martín-Pintado et al. (1990)). For reasonable values of the H2CO excitation temperature (i.e. few K), and under the further assumption that the abundance ratio obtained from these two levels is representative of the actual abundance ratio of the molecules, the ratio of the molecular column densities is N(H2CO)/N(CH3CHO) . This is considerably smaller than the ratio of expected from pure gas phase models for the production of these molecules (Lee et al. (1996)) and suggests that grain chemistry is probably important for the production of CH3CHO.
The enhanced wide-spread abundance of CH3CHO is probably related to the presence of numerous shocks in Sgr B2, for which there are several independent lines of evidence. (1) Sato et al. (2000) postulate a large-scale shock resulting from a cloud-cloud collision. Evidence for such a collision comes from large-scale CO maps as well as the presence of various molecular line masers (e.g. CH3OH, H2CO; Houghton & Whiteoak (1995); Whiteoak & Gardener (1983)) and distorted magnetic fields (Dowell et al. (1998)), all of which are aligned approximately north-south, broadly coincident with the CH3CHO emission of Fig. 1. Further, the eastern edge of the northern section and the western edge of the southern section of the CH3CHO emission seen in Fig. 1 lie along the boundary of this postulated cloud-cloud collission. (2) Mehringer & Menten (1997) argue that the quasi-thermal 44 GHz methanol emission (which is spatially correlated with the CH3CHO emission) probably arises from shocked gas at the boundaries of expanding ionized shells around the young stars in the molecular cloud. (3) Martín-Pintado et al. (1999) have found a large number of hot expanding shells produced by massive evolved stars in the region between Sgr B2 (M) and Sgr B2 (AA), from which we detect bright CH3CHO emission. Again, the expansion of these hot shells into the parent molecular cloud is likely to result in the formation of shocks. Thus, shocks do appear to be present at a number of locations in Sgr B2. These shocks can cause the disruption of the grain mantles on which organic molecules have been formed and thus result in the release of these molecules into the gas phase. This could account for the observed wide-spread emission from CH3CHO.
In time-dependent astro-chemical models, the abundance of complex molecules released from grain mantles rapidly decreases with time, due to their destruction via UV photons or collisions (e.g. Charnley et al. (1992, 1995)). The non-detection of acetaldehyde towards Sgr B1 (which is believed to be considerably older than Sgr B2; Mehringer et al. (1992)) is thus consistent with models in which this molecule is produced by the (possibly shock-induced) disruption of grain mantles. We note, however, that the mechanism for inverting the populations of the CH3CHO and levels is currently unknown; it is thus also possible that CH3CHO is present in Sgr B1, but that physical conditions here are not appropriate to excite the 1065 MHz transition. New interferometers, such as the GMRT, which can yield wide field images of molecular emission, now make it possible to obtain a clearer view of the large-scale distribution of complex organic molecules in the Galaxy.
Acknowledgements.
These observations would not have been possible without the many years of dedicated effort put in by the GMRT staff in order to build the telescope. The GMRT is operated by the National Centre for Radio Astrophysics of the Tata Institute of Fundamental Research. We thank the referee, J. Martín-Pintado, for his comments and suggestions which have improved this paper.References
- Charnley et al. (1992) Charnley, S. B., Tielens, A. G. G. M., & Millar T. J., 1992, ApJ, 399, L71
- Charnley et al. (1995) Charnley, S. B., Kress, M. E., Tielens, A. G. G. M., & Millar T. J., 1995, ApJ, 448, 232
- de Vicente et al. (1997) de Vicente, P., Martín-Pintado, J., & Wilson, T. L. 1997, A&A, 320, 967
- de Vicente et al. (2000) de Vicente, P., Martín-Pintado, J., Neri, R., & Colom, P. 2000, A&A, 361, 1058
- Dickens et al. (1997) Dickens, J. E., Irvine, W. M., Ohishi, M. et al., 1997, ApJ, 489, 753
- Dowell et al. (1998) Dowell, C. D. et al., 1998, ApJ, 504, 588
- Fourikis et al. (1974) Fourikis, N., Sinclair, M. W., Robinson, B. J., Godfrey, P. D. & Brown R. D., 1974, AuJP, 27, 425
- Gottlieb (1973) Gottleib, C. A., 1973, in “Molecules in the Galactic Environment”, Eds. M. A. Gordon and L. E. Snyder (New York: Wiley-Interscience), p. 181.
- Hollis et al. (2001) Hollis, J. M., Vogel, S.N., Snyder, L. E., Jewell, P. R. & Lovas, F. J., 2001, ApJ, 554, L81
- Houghton & Whiteoak (1995) Houghton, S. & Whiteoak, J. B., 1995, MNRAS, 273, 1033
- Ikeda et al. (2001) Ikeda, M., Ohishi, M., Nummelin, A., Dickens, J. E. & Irvine, W. M., 2001, ApJ, 560, 792
- Jörsäter & van Moorsel (1995) Jörsäter S. & van Moorsel G. A., 1995, AJ, 110, 2037
- Kleiner et al. (1996) Kleiner, I., Lovas, F. J. & Godefroid, M., 1996, J. Phys. Chem. Ref. Data., 254, 1113
- Lee et al. (1996) Lee, H-H., Bettens, R. P. A. & Herbest, E., 1996, A&AS, 119, 111
- Martín-Pintado et al. (1990) Martín-Pintado, J., de Vicente, P., Wilson, T. L. & Johnston, K. J., 1990, A&A, 236, 193
- Martín-Pintado et al. (1999) Martín-Pintado, J., Gaume, R. A., Rodríguez-Fernández, N., de Vicente P., Wilson, T. L., 1999, ApJ, 519, 667
- Martín-Pintado et al. (2001) Martín-Pintado, J., Rizzo, J. R., de Vicente, P., Rodríguez-Fernandez, & Fuente, A., 2001, ApJ, 548, L65
- Matthews et al. (1985) Matthews, H. E., Friberg, P. & Irvine, W. M., 1985, ApJ, 290, 609
- Mehringer et al. (1992) Mehringer, D. M., Yusuf-Zadeh, F., Palmer, P. & Goss, W. M., 1992, ApJ, 401, 168
- Mehringer et al. (1993) Mehringer, D. M., Palmer, P. & Goss, W. M., 1993, ApJ, 412, 684
- Mehringer et al. (1995) Mehringer, D. M., Palmer, P. & Goss, W. M., 1995, ApJS, 97, 497
- Mehringer & Menten (1997) Mehringer, D. M. & Menten, K. M., 1997, ApJ, 474, 346
- Mehringer et al. (1997) Mehringer, D. M., Snyder, L. E. & Miao, Y., 1997, ApJ, 480, L71
- Miao et al. (1995) Miao, Y., Mehringer, D. M., Kuan, Y-. J. & Snyder, L., 1995, ApJ, 445, L59
- Rogstad et al. (1974) Rogstad, D. H., Lockhart, I. A. & Whiteoak, J. B., 1974, A&A, 36, 253
- Rupen (1999) Rupen, M. P., 1999, ASP Conf. Ser. 180: Synthesis Imaging in Radio Astronomy II, 229
- Sato et al. (2000) Sato, F., Hasegawa, T., Whiteoak, J. B. & Miyawaki, R., 2000, ApJ, 535, 857
- Snyder et al. (2002) Snyder, L. E., Lovas, F. J., Mehringer, D. M. et al., 2002, ApJ, 578, 245
- Swarup et al. (1991) Swarup, G., Ananthakrishnan, S., Kapahi, V. K., Rao, A. P., Subrahmanya, C. R. & Kulkarni, V. K. 1991, Current Science, 60, 95
- Turner et al. (2001) Turner, B. E. & Apponi, A. J., 2001, ApJ, 561, L207
- Whiteoak & Gardener (1983) Whiteoak, J. B. & Gardener, F. F., 1983, MNRAS, 205, 27