The Optical Emission from Gamma-Ray Quasars
Abstract
We present photometric observations of six radio-loud quasars that were detected by the COMPTEL gamma-ray telescope. The data encompass seven wavebands in the optical and near infrared. After correction for Galactic extinction, we find a wide range in optical slopes. Two sources are as blue as optically-selected quasars, and are likely to be dominated by the accretion disc emission, while three others show colours consistent with a red synchrotron component. We discuss the properties of the COMPTEL sample of quasars, as well as the implications our observations have for multiwavelength modelling of gamma-ray quasars.
1 Department of Astrophysics and Optics, School of Physics,
University of New South Wales, Sydney NSW 2052, Australia
mwhiting@phys.unsw.edu.au
2 Astrophysics Group, School of Physics, University of Melbourne,
Victoria 3010, Australia
rwebster@physics.unimelb.edu.au
Received 2001 November 29, accepted 2003 April 23
Keywords: galaxies: active — quasars: individual (PKS 0208512, PKS 0506612, PKS 0528134, PKS 1622297, PKS 2230114, PKS 2251158)
1 Introduction
Active galactic nuclei (AGN) are powerful emitters in all wavebands. Emission processes from different parts of the spectrum in many cases appear to be linked. For example, the electrons in the jet which produce the synchrotron radiation may at the same time upscatter photons into the X-ray and gamma-ray regime via the inverse Compton (IC) process (see for example the analysis by Bloom & Marscher 1996). In order to unravel the contribution from each emission process, the shape of each distinct emission component needs to be determined, and the associated physical parameters measured.
The IC emission is produced by seed photons (internal, from the jet itself, or external, from the accretion disc or the emission-line clouds) which are upscattered by the electrons (or other relativistic particles) in the jet. The energy of the photons increases by a factor of , where is the Lorentz factor of the relativistic particle. Consequently, there are two crucial factors that determine the nature of the IC emission: the maximum energy of the jet electrons, which determines the turnover frequency of the synchrotron component; and the typical energy of the seed photons, which is governed by the relative strengths of the thermal and non-thermal components. The optical regime is where these components are both energetically important, and so a good understanding of the emission at optical frequencies is crucial for accurate modelling of the high-energy emission.
Before COMPTEL was shut down in June 2000, this telescope detected nine blazars in the range 0.75 – 30 MeV which were also detected by EGRET in the gamma-ray regime 100 MeV (Schönfelder et al. 2000; Collmar 2001). For many of the sources in this sample, the data coverage in the optical/near infrared (NIR) region is very poor. To better understand this important part of the spectral energy distribution (SED), six blazars from the COMPTEL sample, chosen subject to visibility during an observation period from 27 August to 2 September 2001, were observed in the photometric bands , , , , , , and . Basic information for this sample is shown in Table 1. We note that the redshift for PKS 1622297 () is taken from the Parkes Catalogue (Wright & Otrupcek 1990, hereafter PKSCAT90), wherein no reference is given. No other determination of its redshift has been made in the literature, and, while we use this value herein, it should be regarded as potentially suspect.
| Name | Other | RA | DEC | E | z |
|---|---|---|---|---|---|
| name | (J2000) | (J2000) | (mag) | ||
| PKS 0208512 | — | 02:10:46.20 | 51:01:01.9 | 0.020 | 0.999 |
| PKS 0506612 | — | 05:06:44.00 | 61:09:41.0 | 0.025 | 1.093 |
| PKS 0528134 | — | 05:30:56.36 | 13:31:55.0 | 0.860 | 2.060 |
| PKS 1622297 | — | 16:26:06.02 | 29:51:27.0 | 0.454 | 0.815 |
| PKS 2230114 | CTA 102 | 22:32:36.40 | 11:43:51.3 | 0.072 | 1.037 |
| PKS 2251158 | 3C 454.3 | 22:53:57.75 | 16:08:53.6 | 0.105 | 0.859 |
Detailed models of the multiwavelength spectra of several of the sources in this sample have been published in the literature. For example, Mukherjee et al. (1999) describe a model with both synchrotron and IC emission components fitted to nine epochs of monitoring data for the source PKS 0528134. While considerable effort has been expended in fitting the high-energy spectrum (X-rays and above) of this source, the information in the low-energy part of the spectrum, from optical to radio energies, has largely been ignored. Rather than modelling one source in detail, by considering a modest sample of six sources more general conclusions can be drawn about the nature of the emission processes.
As synchrotron emission causes linear polarisation, optical polarisation measurements can be used to check the predictions from the modelling. Optical polarimetry of most of the sources in this sample is available from the literature. It will be shown that the sources with high optical polarisation are generally distinguished by their radio to optical spectral shapes, and are consistent with having a synchrotron component extending to optical wavelengths.
Section 2 describes the photometric optical and NIR data for the six sources. The SEDs in each case are adequately modelled by a power law in Section 3. Finally, in Section 4 we examine the implications of our observations for multiwavelength modelling of gamma-ray sources, as well as the demographics of the sample as a whole.
2 Observations and Data
2.1 Observations
The six blazars were observed in optical bands , , , and on the night of 29 August 2001 with the ANU 40 in telescope at Siding Spring Observatory (SSO). The exposure time in each band was 300 seconds. The seeing was typically , but conditions were generally photometric (although the weather did force some breaks in the observing, and the loss of the band data for PKS 1622297). Cross-checking of field stars from Raiteri et al. (1998) enables verification of the photometric conditions. Observations of standard stars from Graham (1982) enabled calibration to an absolute magnitude/flux scale.
Observations in the NIR bands , , and were made on the nights of 31 August and 1 September 2001 with the CASPIR (Cryogenic Array Spectrometer/Imager—see McGregor et al. 1994) instrument on the ANU 2.3 m telescope, SSO. Each image is a median-combination of four (or, in the case of the fainter sources, 20) dithered images of 60 seconds exposure time each (these individual exposures were: 2 cycles of 30 seconds for ; 6 cycles of 10 seconds in ; and 12 cycles of 5 seconds in ).
Poor weather on the first night allowed us to observe only PKS 1622297 and two standard stars, but the second night had good conditions, allowing us to observe the remaining sources. The seeing was better than for the optical (typically ) and conditions were generally photometric. Individual frames where the background increased due to the presence of cloud were discarded prior to co-addition. Observations of IRIS standard stars from the Carter system (Carter & Meadows 1995) were used for calibration.
2.2 Data
The data reduction was performed in a standard way using IRAF software. Optical images were bias- and overscan-subtracted, and then flat-fielded. The flat-field images were generated from a combination of night sky flats (created from all object images such that any sources are excluded) and flats made from exposures of a uniformly cloudy sky. NIR images were bias- and dark-subtracted, and then flat-fielded using flats derived from the difference of exposures of the dome with and without illumination. This removes telescope emission and improves photometric accuracy. The sky emission was then subtracted from the individual images using a median of all dither positions (excluding those with high background due to cloud), and then the individual dither positions were added together to produce the final image.
The photometry was performed using the IRAF daophot package. The resulting optical and NIR magnitudes are shown in Tables 2 and 3 respectively. The errors quoted are errors resulting from the sum in quadrature of the random photometric errors, as calculated by the daophot package, and the systematic errors that result from the spread in zero points for the various standard star observations over the course of the night. The photometry includes corrections for the varying atmospheric extinction due to the different airmasses of the sources. For two sources (PKS 0506612 and PKS 1622297), subtraction of nearby stars was required to provide accurate background subtraction for the aperture photometry (although in no case were the images of the star and quasar overlapping). Figure 1 plots the observed photometric SED for each source as a function of observed wavelength.
The magnitudes were converted into fluxes to enable modelling and plotting of the data. The zero magnitude fluxes for the optical bands were taken from Bessell, Castelli, & Plez (1998), while the CASPIR zero magnitudes are obtained from a 11200 K blackbody normalised to W cm-2 (Bersanelli, Bouchet, & Falomo 1991). The values of the zero points are shown in Table 4. Note that although the observations used the filter, they were calibrated according to the magnitudes of the IRIS standards without a colour-correction term, and so have been normalised using the band zero point.
2.3 Galactic Extinction
Values for the Galactic extinction, taken from the maps of Schlegel, Finkbeiner, & Davis (1998) are included in Table 1. For two objects, PKS 0528134 and PKS 1622297, the extinction is large due to their location close to the Galactic plane. We note that Zhang et al. (1994) found evidence for excess absorption over the Galactic value for PKS 0528134 from X-ray observations, which would imply a larger value than that from Schlegel et al. (1998) (and hence a larger correction to the observed magnitudes). For our analysis, however, we just use the Galactic value.
The values of E were transformed to an absorption for each photometric band using the conversion factors given in Schlegel et al. (1998). These absorption values were then subtracted from the observed magnitudes to give the extinction-corrected magnitudes, and both sets of data (raw and corrected) are included in Tables 2 and 3. The photometric extinction-corrected SEDs for each object have also been plotted in Figure 1.
| Source | UT date | ||||
|---|---|---|---|---|---|
| PKS 0208512 | 16.270.04 | 15.800.03 | 15.430.03 | 14.940.03 | 29 Aug 2001 |
| 16.180.04 | 15.730.03 | 15.380.03 | 14.900.03 | ||
| PKS 0506612 | 17.670.07 | 17.250.05 | 16.880.04 | 16.620.05 | 29 Aug 2001 |
| 17.560.07 | 17.170.05 | 16.820.04 | 16.570.05 | ||
| PKS 0528134 | 20.760.23 | 19.530.15 | 18.980.11 | 17.940.11 | 29 Aug 2001 |
| 17.040.23 | 16.740.15 | 16.720.11 | 16.250.11 | ||
| PKS 1622297 | — | 18.840.33 | 18.290.25 | 17.880.24 | 29 Aug 2001 |
| — | 17.370.33 | 17.090.25 | 16.990.24 | ||
| PKS 2230114 | 17.200.05 | 16.820.03 | 16.430.04 | 16.030.04 | 29 Aug 2001 |
| 16.890.05 | 16.590.03 | 16.240.04 | 15.890.04 | ||
| PKS 2251158 | 15.340.05 | 14.830.01 | 14.430.03 | 13.880.03 | 29 Aug 2001 |
| 14.880.05 | 14.490.01 | 14.150.03 | 13.670.03 |
| Source | UT date | |||
|---|---|---|---|---|
| PKS 0208512 | 13.770.03 | 12.930.01 | 12.180.02 | 1 Sept 2001 |
| 13.750.03 | 12.920.01 | 12.170.02 | ||
| PKS 0506612 | 16.680.04 | 16.070.03 | 15.160.05 | 1 Sept 2001 |
| 16.660.04 | 16.060.03 | 15.150.05 | ||
| PKS 0528134 | 16.990.09 | 16.160.06 | 15.260.07 | 1 Sept 2001 |
| 16.210.09 | 15.660.06 | 14.940.07 | ||
| PKS 1622297 | 16.450.03 | 15.940.03 | 15.310.03 | 31 Aug 2001 |
| 16.040.03 | 15.680.03 | 15.140.03 | ||
| PKS 2230114 | 15.250.05 | 14.480.04 | 13.730.06 | 1 Sept 2001 |
| 15.180.05 | 14.440.04 | 13.700.06 | ||
| PKS 2251158 | 13.060.03 | 12.140.01 | 11.310.03 | 1 Sept 2001 |
| 12.960.03 | 12.080.01 | 11.270.03 |
| Filter | Flux of zero magnitude | |
|---|---|---|
| star (, W cm-2 ) | ||
| 0.44 | ||
| 0.55 | ||
| 0.70 | ||
| 0.88 | ||
| 1.239 | ||
| 1.649 | ||
| 2.192 |
3 Model Fitting
Each of the extinction-corrected SEDs has been fitted by a power law, given by , using a -minimisation method. The fit is deemed ‘acceptable’ if the reduced (i.e. , where is the number of degrees of freedom in the fitted model) is below the 99% confidence level. For the power-law model fitted to seven data points, and the acceptance threshold is . A fit with a value greater than this is rejected (with 99% confidence). The resulting fits are shown in Figure 1, and the fitted parameter values—the spectral index and the reduced chi-squared value —are shown in Table 5.
| Source | (%) | (%) | ||
|---|---|---|---|---|
| PKS 0208512 | 11.5 | 11.5 | ||
| PKS 0506612 | * | 1.1 | 1.1 | |
| PKS 0528134 | 0.3 | 0.3 | ||
| PKS 1622297 | — | — | ||
| PKS 2230114 | 7.3 | 10.9 | ||
| PKS 2251158 | 2.9 | 16.0 |
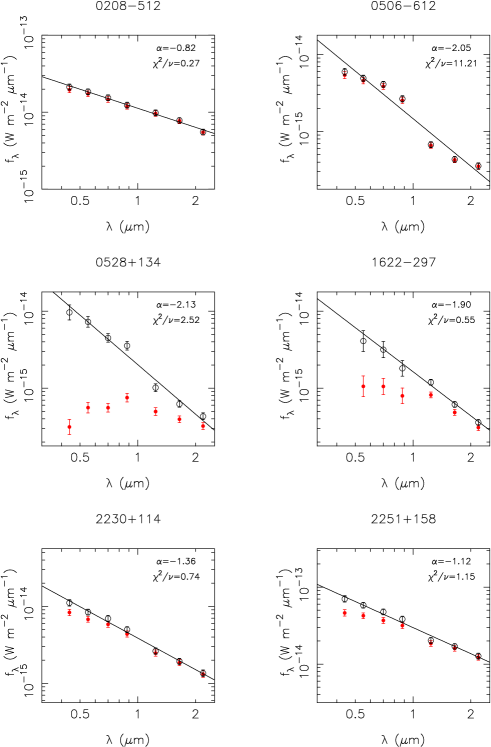
We find that the fitted power laws can be separated into two groups. Three sources—PKS 0506612, PKS 0528134, and PKS 1622297—are quite blue (although PKS 0506612 is a poor fit, as discussed below, and should probably not be included in this group). These slopes are the same as those found at the blue end of the distribution of fitted slopes for the Parkes Half-Jansky Flat-spectrum Sample (PHFS) quasars in Whiting, Webster, & Francis (2001). A natural interpretation of such blue slopes is that they are due to emission from the accretion disc. This would be expected for high-redshift sources such as PKS 0528134, as the observed optical emission is probing the rest-frame UV.
The remaining three sources have much redder optical slopes. Again comparing to the PHFS sources in Whiting et al. (2001), we find that these slopes are in the middle of the distribution, corresponding to sources with synchrotron-dominated spectra.
One source had a poor fit: PKS 0506612. There is a large offset between the optical and NIR points, giving what appears to be substantial spectral curvature. However, it is likely that the source has faded in the three days between the two observations—if the spectrum is a smooth continuum then a reduction in flux of 1 mag is implied. This also implies the intrinsic spectrum is a red power law of slope . A similar, albeit much weaker effect is seen in PKS 0528134, although this could also be due to the band data having excess emission over the power law continuum. Contamination by the Mg ii emission line (which would appear at ) is a likely origin of this excess.
We can use data from the literature to support the interpretation of the different optical slopes. Synchrotron radiation is intrinsically highly polarised, and so a significant net polarisation from a source is a good indication that the emission is dominated by synchrotron emission. Impey & Tapia (1990) measured polarisation for five of the sources (excluding PKS 1622297), and their values are also shown in Figure 5. It can be seen that the three sources with red optical slopes are the sources that have been observed to exhibit high optical polarisations, indicating a likely synchrotron origin for the emission.
4 Discussion
4.1 Demographics
All the sources we have studied here are radio-loud, flat-spectrum quasars (FSRQs). We would like to know how typical these objects are compared to other FSRQs, or whether they are exceptional in some way that would explain their gamma-ray emission. We examine here two properties—the redshift and the radio luminosity—and compare it to a sample of flat-spectrum radio-loud objects. For this comparison sample we use the PHFS (Drinkwater et al. 1997), a sample of southern, radio-bright, flat-spectrum objects. We also include in this discussion the COMPTEL sources that we did not observe: PKS 1222216 (), PKS 1226023 (3C 273, ), and PKS 1253055 (3C 279, ). Note that the latter two sources are also in the PHFS.
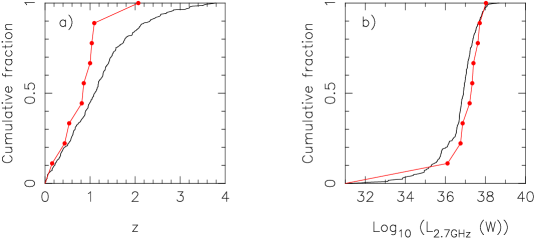
The cumulative redshift distributions for both samples are plotted in Figure 2a. Note that we have excluded from the PHFS distribution the 33 objects with no known redshift. These objects include a few BL Lac objects, which have no emission line from which to measure a redshift, but are mostly optically faint, meaning no suitable spectrum has been obtained. The COMPTEL sample tends to be biased towards lower redshift values, with only one source at high redshift (PKS 0528134 at , Hunter et al. 1993). This is likely to be a consequence of the sensitivity of the COMPTEL detector, with sources at suitably high redshift not being bright enough at gamma rays for detection. We do note, however, that a Kolmogorov-Smirnov (K-S) test shows that the distributions are different only at the 90% confidence level (the probability that they are the same is 9.9%).
Figure 2b shows the cumulative distributions of the radio luminosity for both samples. This is calculated from the 2.7 GHz fluxes from PKSCAT90 (assuming km s-1 Mpc-1 and ). We see that the COMPTEL sources tend to have, on average, higher radio luminosities than the PHFS sources (there is a difference in average luminosity of 0.56 dex, or a factor of ). Again, however, a K-S test shows this is not very significant (the probability that the distributions are different is 12.6%). We can, however, discuss the trends shown in the graphs.
Even though, as we see from the redshift distribution, the COMPTEL sample lacks the high-redshift sources (which one would expect to be more luminous than low-redshift sources in a flux-limited sample), the average radio luminosity of this sample is still greater than that of the PHFS. This implies that the sample selected at gamma rays lacks sources of low radio luminosity. This is probably an indication that a certain radio luminosity is required for a source to be active at high-energy gamma rays.
4.2 Multiwavelength SEDs
In Figure 3 we plot the multiwavelength (radio to gamma-ray) SEDs constructed from published data, as well as the new data presented herein. Two epochs of radio observation are shown. One set of data (indicated by the asterisks) is from PKSCAT90, while the second (indicated by crosses) is from Kovalev et al. (1999). The latter does not include PKS 0208512 and PKS 0506612. The optical/NIR data (from this paper) have been corrected for Galactic extinction. The X-ray data come from Brinkmann, Yuan, & Siebert (1997). The ‘bowtie’ represents the twin constraints given by the errors on the total 0.1–2.4 keV flux and the spectral slope. (Note that the constraints on the slope for PKS 1622297 are rather poor.) The COMPTEL data, taken from Schönfelder et al. (2000), are indicated by the four points between Hz and Hz. The horizontal error bars indicate the energy range of each bin, while the vertical error bars indicate the flux error. Upper limits () are indicated by arrows. The final point is the EGRET datum from the Third EGRET Catalog (Hartman et al. 1999), using their approximation to generate a 400 MeV flux density by multiplying the catalogued flux by 1.7. Note that the observations presented here are not simultaneous.

The SEDs provide an interesting glimpse of the range of different spectral shapes present in radio-loud quasars. The optically-red sources, particularly PKS 0208512 and PKS 2251158, show optical–NIR SEDs that can quite easily be connected to the radio data, as would be expected if both regimes are dominated by synchrotron emission from the relativistic jet.
For other sources, however, it is less obvious what, if any, connection exists between these two regimes. For instance, the band flux of PKS 1622297 is approximately equal (on a scale) to the 20 GHz flux from Kovalev et al. (1999), while the spectral index in the two regimes is approximately the same. This, however, should not be surprising if we attribute the optical emission to the accretion disc, as it will then not be the same component as the radio emission. In such a picture, the synchrotron emission from the jet has turned over somewhere in the infrared, leaving the accretion disc emission to dominate the optical. Note that the flux level at radio frequencies is approximately equal for all sources, whereas the redder sources tend to be brighter in the optical/NIR, indicating the presence of an additional emission component.
Clearly, while the non-thermal processes (i.e. synchrotron and IC) are undoubtedly important for the radio and high-energy emission, the optical regime is not always going to be dominated by them. This was shown in the detailed study of the optical/NIR properties of radio-loud quasars by Whiting et al. (2001), which found that a large fraction of sources showed no evidence for non-thermal synchrotron emission at optical wavelengths. The observations of strong emission-line spectra and low polarisation in the optical for the blue objects in this sample also back this up.
This raises an important issue when it comes to modelling the multiwavelength SEDs of such objects. Detailed models do exist in the literature, and are used with good effect to model the high-energy emission (X-rays through gamma rays). See, for instance, Mukherjee et al. (1999) for modelling of the multiwavelength spectra of PKS 0528134. However, many of these models do not take the lower-energy (i.e. radio through optical) data fully into account. As an example, we refer the reader to Figures 8 and 9 of Mukherjee et al. (1999), where the model flux in the optical goes in the opposite direction to the data. This seems to be due to the fitted models not fully taking into account the presence of significant emission from the accretion disc.
This is an important issue, since if the thermal accretion disc emission is dominating the optical, the synchrotron emission in that frequency range is much less than previously assumed. This will then affect the derived values for the Lorentz factors, which affect the generation of the gamma rays via the IC process.
The photon density at the jet of the seed photons is another key parameter for calculating the IC luminosity. For a given observed total optical flux, this parameter will be different for synchrotron-dominated and thermally-dominated spectra, and its spectral shape will differ as well. This will alter the predicted shape of the IC emission.
It can be seen, therefore, that a good understanding of the makeup of the optical emission is crucial for accurate modelling of the high-energy emission. This is something that needs to be considered for future multiwavelength campaigns involving high-energy observations and subsequent modelling, particularly with the advent of new gamma-ray telescopes such as INTEGRAL and GLAST.
5 Conclusions
We have observed six COMPTEL-detected quasars at optical and NIR wavelengths, and we present photometry in seven wavebands, corrected for Galactic extinction.
We find large differences in the optical properties between the sources. Two of the sources have intrinsically blue optical SEDs, and are likely to be dominated by thermal emission from an accretion disc. A further three have much redder optical slopes, and are more likely to be dominated in the optical by non-thermal synchrotron emission from the relativistic jet.
This identification of accretion disc emission in some gamma-ray sources has important implications for the sources’ broad-band modelling. It implies both that the thermal emission is stronger and the non-thermal emission weaker in the optical regime than previously considered, indicating that broad-band models used to explain the high-energy emission will need to be revisited, particularly as far as the optical regime is concerned.
Acknowledgments
The authors would like to thank A. Melatos for some very helpful discussions. We also want to thank the MSSSO TAC for granting us time for the observations at the 40 in and 2.3 m telescopes at the SSO.
This research has made use of the NASA/IPAC Extragalactic Database (NED) which is operated by the Jet Propulsion Laboratory, California Institute of Technology, under contract with the National Aeronautics and Space Administration.
References
Bersanelli, M., Bouchet, P., & Falomo, R. 1991, A&A, 252, 854
Bessell, M.S., Castelli, F., & Plez, B. 1998, A&A, 333, 231
Brinkmann, W., Yuan, W., & Siebert, J. 1997, A&A, 319, 413
Bloom, S.D., & Marscher, A.P. 1996, ApJ, 461, 657
Carter, B.S., & Meadows, V.S. 1995, MNRAS, 276, 734
Collmar, W. 2001, in High Energy Gamma-Ray Astronomy, AIP Proceedings Volume 558, ed. F.A. Aharonian H.J. Völk (Melville, NY: American Institute of Physics), 656
Drinkwater, M.J., et al. 1997, MNRAS, 284, 85
Graham, J.A. 1982, PASP, 94, 244
Hartman, R.C., et al. 1999, ApJS, 123, 79
Hunter, S.D., et al. 1993, ApJ, 409, 134
Impey, C.D., & Tapia, S. 1990, ApJ, 354, 124
Kovalev, Y.Y., Nizhelsky, N.A., Kovalev, Yu.A., Berlin, A.B., Zhekanis, G.V., Mingaliev, M.G., & Bogdantsov, A.V. 1999, A&AS, 139, 545
McGregor, P., et al. 1994, in Infrared Astronomy with Arrays: The Next Generation, ed. I.S. McLean (Dordrecht: Kluwer), 299
Mukherjee, R., et al. 1999, ApJ, 527, 132
Raiteri, C.M., Villata, M., Lanteri, L., Cavallone, M., & Sobrito, G. 1998, A&AS, 130, 495
Schlegel, D.J., Finkbeiner, D.P., & Davis, M. 1998, ApJ, 500, 525
Schönfelder, V., et al. 2000, A&AS, 143, 145
Whiting, M.T., Webster, R.L., & Francis, P.J. 2001, MNRAS, 323, 718
Wright, A., & Otrupcek, R. 1990, Parkes Catalogue (Australian Telescope National Facility) (PKSCAT90)
Zhang, Y.F., Marscher, A.P., Aller, H.D., Aller, M.F., Terasranta, H., & Valtaoja, E. 1994, ApJ, 432, 91