The origin of X-ray emission of two distant () cluster candidates with XMM-Newton
We present here a study of XMM-Newton data of two distant galaxy cluster candidates. One of these was discovered serendipitously in near infrared data, CL~J0533-2411, the other one corresponds to the cluster EIS~J0533-2412 part of the EIS cluster survey. The estimated redshift of CL J0533-2411 is . EIS J0533-2412 is a rich system (), with a spectroscopically confirmed redshift of . Both galaxy concentrations show firm X-ray detections, located within of their optical center. However, we cannot resolve the sources with XMM-Newton . If the X-ray emission originates from the X-ray emitting intra-cluster medium (ICM) it would be extremely concentrated which is rather unlikely (core radii below and , respectively). We argue that the X–ray sources are more likely AGN members of the galaxy concentrations. We set an upper limit for the bolometric luminosity of a hot ICM in the range for CL J0533-2411 , depending on the exact redshift. For EIS J0533-2412 the limit is . We interpret our result in the following way: EIS J0533-2412 (and possibly CL J0533-2411 ) are proto-clusters and show matter overdensities before collapse, which explains the low significance of extended X-ray emission.
Key Words.:
Cosmology: observations – large-scale structure of Universe – Galaxies: clusters: individual: CL J0533-2411 , EIS J0533-2412 – X-rays: galaxies: clusters – Galaxies: active1 Introduction
Cluster evolution with time provides essential information on the physics of structure formation and can set strong constraints on the cosmological parameters. In spite of remarkable progresses in that field in the recent years (e.g. Rosati, Borgani & Norman rbn (2002) and references therein), the redshift range remains largely unexplored.
The results presented in this paper are part of an ongoing comprehensive effort to identify and study clusters at different epochs using as starting point the ESO Imaging Survey (EIS – Nonino et al. nonino (1999); Prandoni et al. prandoni (1999); Benoist et al. benoist99 (1999)) and the subsequent cluster candidate compilation, which was built using a matched filter technique in the I band (Olsen et al. ols99 (1999); Scodeggio et al. sco99 (1999)). These original data were complemented by multi-band optical/infrared imaging data to derive photometric redshifts. Combining these estimates with the positional information allows to search for concentrations in the 3D space and to select the most likely clusters (da Costa et al. dac99 (1999)). First VLT spectroscopic observations confirmed the reality of three candidates in the redshift range (Benoist et al. ben02 (2002)).
We present here XMM-Newton follow-up of two cluster candidates at . The first object, CL~J0533-2411, was detected serendipitously in the J/K follow up of EIS J0533-2412 with SOFI/NTT, as an overdensity in the projected distribution of galaxies with similar J-K colors. Based on the I, J and K-band data the estimated redshift of this cluster candidate is . The other object is the system EIS~J0533-2412, which is supposed to be a rich system based on the matched filter parameter (). VLT/FORS2 spectroscopic observations strongly suggest that this galaxy concentration is a true physical structure at (Benoist et al. ben02 (2002)). The group in this field at z=0.8 as indicated by Benoist et al. ben02 (2002) is scattered through the field and does not coincide with the matched filter position of the EIS J0533-2412 cluster. Detailed spectral information of the cluster galaxies will be presented in a forthcoming paper by Jørgensen et al. jorg (2003).
X–ray observations are a key to understand the nature of these galaxy systems, which at such high redshift are not necessarily fully collapsed and relaxed objects. They could be filaments, proto-clusters or more or less virialised clusters. The detection of extended X–ray emission from hot gas, heated by gravitational collapse, would trace the virialized portion of these distant and young systems.
The paper is structured in the following way. The data are described in Sect. 2. In Sect. 3 we present the data reduction and the results of our analysis. We examine the significance and extent of the X–ray emission at the location of both cluster candidates, the physical origin of the emission and put constraints on the ICM X–ray luminosities. We discuss the physical nature of the cluster candidates in Sect. 4 and conclude in Sect. 5.
Throughout this paper we use km/s/Mpc, and , . In this cosmology, one arcminute corresponds to Mpc and Mpc at a redshift of and , respectively.
2 The XMM-Newton data
Both clusters lie sufficiently close together (2 arcmin distance) to be observed in one XMM-Newton observation. The data were taken in two exposures: ksec during revolution and ksec during revolution . The total exposure time was longer than originally scheduled since the pn-camera was not operational at that time. Thus we present here only data based on EPIC-MOS cameras.
3 Data analysis
For our analysis we use the official XMM-Newton software (SAS version 5.2). The data presented below are corrected for vignetting effects using the photon weighting method (Arnaud et al. arnaud01 (2001); Majerowicz et al. majero (2002)).
3.1 Background Screening
XMM-Newton observations suffer from time periods of high background due to soft protons from solar flares. During those flares the background level can increase by several orders of magnitude as compared to the quiescent background level and significantly degrades the signal to noise ratio.
We bin the MOS-data in time intervals of 100 sec in the high energy band 10-12 keV band, where the emission is dominated by the particle induced background. We screen the data for flare periods by applying a rejection threshold in this energy band of counts. After such cleaning, the effective exposure time is ksec and ksec for the MOS1 and MOS2 cameras, respectively.
3.2 Source detection and morphology
In order to enhance the signal-to-noise ratio we only take into account data in the energy band 0.3-3.0 keV. We extract the MOS1&2 image with a pixel size of times , which corresponds to the physical size of the detector pixels. The X-ray signal at the location of both CL J0533-2411 and EIS J0533-2412 appear very faint and we therefore apply first a detection algorithm, which gives the significance of the signals. We use the code described in Neumann & Böhringer (neu97 (1997)), which assumes Poisson statistics and uses a Gauss filter. We apply this algorithm with a Gauss filter size of and an overall background estimate of 0.004 cts/s/arcmin2 in the 0.3–3.0 keV energy range.
| Objects | RA (J2000.0) | DEC (J2000.0) |
|---|---|---|
| CL J0533-2411 | ||
| XMMU J053344.4-241048 | ||
| EIS J0533-2412 | ||
| R clump | ||
| XMMU J053337.8-241250 |
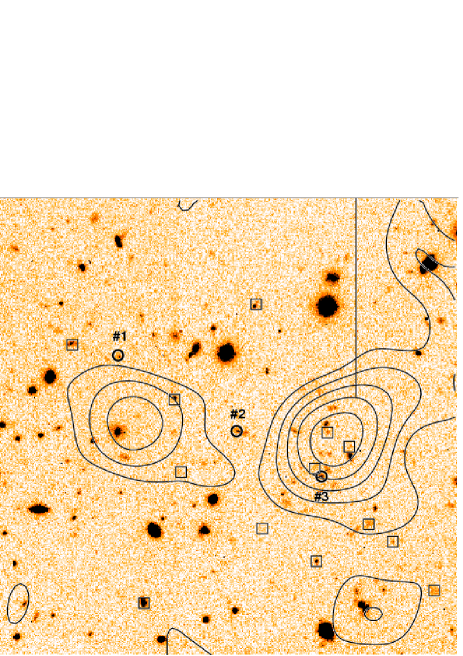
Fig.1 shows the X-ray contours in sigma over the K-band image obtained with SOFI/NTT. Fig. 2 shows a zoom on EIS J0533-2412 , where the X–ray contours are overlaid on the R-band VLT/FORS2 image. The position of the galaxies with same () color are indicated by squares and the three EIS J0533-2412 galaxies with measured redshifts by circles.
Significant X-ray emission is detected at both cluster locations. The peak positions are given in Table 1, together with the optical center of the cluster candidates estimated from a 3-D analysis of the galaxy concentrations using the IJK imagery data. A compact X–ray source (XMMU J053344.4-241048 ) is detected only away from the optical center of CL J0533-2411 . For EIS J0533-2412 , a possibly more extended X–ray source (XMMU J053337.8-241250 ) is detected at the level, with a faint extension in the North-West direction. However this extension coincides with bright foreground galaxies and might be due to contamination. Just roughly 40 arcsec east of XMMU J053337.8-241250 there is another detection (indicated with an “S” in Fig.1). The estimated optical center of EIS J0533-2412 is located in between these two X–ray peaks, with an offset with respect to XMMU J053337.8-241250 peak of . However, the deeper R-band VLT image reveals a concentration of faint galaxies (hereafter called “R clump”), centered on the galaxy #3 at (right circle in Fig.1 and Tab.1), only from the X–ray peak with 5 detection.
3.3 Source extent
In order to determine the origin of the X–ray emission, we examine in the following the extent of XMMU J053344.4-241048 and XMMU J053337.8-241250 by analyzing their surface brightness profiles. We excise all sources detected above in the extraction region aperture, in particular the secondary X-ray source found east of XMMU J053337.8-241250 (indicated with an “S” in Fig.1).


3.3.1 XMMU J053344.4-241048
Fig.3. shows the azimuthally averaged MOS1&2 surface brightness profile of XMMU J053344.4-241048 . The center was fixed at the peak of the X-ray emission (Table 1). To obtain the merged surface brightness profile of the source we extract first the surface brightness profile for each exposure (performed in revolution 332 and revolution 335) and each camera (MOS1 and MOS2). Then we merge the surface brightness profiles of the two exposures for each camera individually together and finally add the profiles of the two cameras together.
In order to check whether this source is extended we compared the surface brightness profile with the PSF model (Ghizzardi ghi01 (2001)) and adding a flat background. The results are shown in Fig. 3. The derived is for degrees of freedom (d.o.f.) indicating that the emission is consistent with that of a point source. Fitting a –model instead (with ) convolved with the PSF does not improve the quality of the fit. The best fit is actually obtained for a point-like source emission (). We derived an upper limit for the core radius of at the confidence level (). The corresponding profile is plotted as a dotted line in Fig. 3. corresponds to roughly at .
3.3.2 XMMU J053337.8-241250
Defining the center of XMMU J053337.8-241250 is more complicated since the source seems a priori to be more extended than XMMU J053344.4-241048 and somewhat fainter (see Fig. 1). The determination of the center is very important since a wrong choice could lead to an artificial measured extent when compared to a point like source.
We first extracted the profile centered at the peak of the whole emission. We also consider a more conservative approach, which will maximize the profile concentration. For each exposure (in total two) and each camera (MOS1 and MOS2), we further extracted four profiles around the X-ray peak. The centers of these profiles span a quadrat of arcsec with the X-ray peak in its center. We choose this spacing since a small offset between center source and measured center will not be visible within 2 arcsec, the FWHM of the XMM-Newton mirrors being in the order of 4-6 arcsec. Among the 5 resulting surface brightness profiles per exposure and camera we choose the profile with the highest central intensity and then merge the different brightness profiles together. The derived profile is consistent with the profile centered at the overall X–ray peak but is more noisy. Since the two profiles are consistent, we consider in the following only the latter profile extracted using the overall center.
The surface brightness profile together with the best fit surface brightness profile of a point source model including background is shown in Fig. 4. Again a good fit is obtained with a derived of for d.o.f. Fitting a –model convolved with the PSF to the brightness profile gives again a best fit for a point source. The 99% confidence level for in this case is for . This corresponds to at .
3.4 Count rate estimates
The total MOS1&2 count rate was estimated by integrating the surface brightness profiles, after subtracting the best fit background level. The integration radius was chosen to be to optimize the S/N ratio. However, this is smaller than the size of the PSF and we have to correct for the flux loss outside the integration radius. Since the sources are not resolved, the correction factor was estimated from the Encircled Energy Fraction within for the PSF model (). For XMMU J053344.4-241048 (close to CL J0533-2411 ) we derived a PSF corrected count rate in the keV energy band of ct/s. The count rate for XMMU J053337.8-241250 (close to EIS J0533-2412 ) is ct/s.
3.5 The origin of the X–ray emission
The XMM observations of both CL J0533-2411 and EIS J0533-2412 clearly reveal X-ray emission. However, the extracted surface brightness profiles of the X–ray sources are comparable with the shape of the PSF and are therefore not resolved. Consequently, we cannot unambiguously determine the physical origin of the sources, especially since little is known on X-ray clusters beyond .
It is, however, instructive to compare the upper limit set on the source extent ( and at the 99% confidence limit) with the properties of the four clusters known with extended X–ray emission. The two RDCS clusters (Rosati et al. rosati98 (1998)) with relatively regular morphology, RX~J0848.9+4452 () and RX~J0910+5422 () have core radii at least twice as large: (Stanford et al. stan01 (2001)) and (Stanford et al. stan02 (2002)). Interestingly, the other RDCS cluster, CIG~J0848+4453 (), was originally discovered via a search for clusters in infrared bands (Stanford et al. stan97 (1997)). This cluster has an irregular morphology (Stanford et al. stan01 (2001)). Nevertheless, a –model fit gives a core radius of (Holden holden (2001)). A cluster with a core radius of this size at this redshift is resolved by XMM. Finally, RX~J1053.7+5735 (), discovered in deep ROSAT observation in the Lockman hole (Hasinger et al. has98 (1998)), was clearly resolved by XMM as a bimodal cluster (Hashimoto et al. hashimoto (2002)).
A comparison can also be made with the expectation of the self-similar model of cluster formation, where scales as (e.g. Evrard & Gioia eg (2002)). The typical core radius of nearby clusters is (Neumann & Arnaud neu99 (1999)) where (Evrard, Metzler & Navarro emn96 (1996)). For a relaxed part of a distant cluster with a temperature as low as 2 keV, we would thus expect a core radius of () and (). These core radii are again excluded by our data.
In conclusion, although we cannot totally exclude that the X–ray emission is due to exceptionally concentrated ICM, the upper limit found on the source extent clearly favors a point source (AGN) origin. Those AGNs can be either foreground/background galaxies, or members of the galaxy overdensity.
The latter hypothesis is a priori more likely in view of the source locations, remarkably close to the optical center of the galaxy concentrations, CL J0533-2411 and EIS J0533-2412 , respectively. We further quantify this point. Assuming a power law AGN emission with a photon index of , the measured count rate of XMMU J053344.4-241048 and XMMU J053337.8-241250 corresponds to an unabsorbed flux in the keV energy band of and , respectively. From the deep XMM-Newton survey of the Lockman Hole region (Hasinger et al. has01 (2001)), the number of sources (essentially AGN) per square degrees above those flux limits are and . The probability that a serendipitous AGN at least as bright as XMMU J053344.4-241048 is found by chance within of the center of CL J0533-2411 is only . For XMMU J053337.8-241250 (located at from the center of the R clump in EIS J0533-2412 ), the probability is even smaller: . If we consider a conservative distance of (about 270 kpc) to take into account possible uncertainties on the optical center determination, these probabilities are still below .
We looked for possible optical counterparts, as well as radio sources in the field. For that purpose, we used the NRAO VLA Sky Survey, NVSS (Condon et al. condon (1998)). Within in radius of the optical center of both concentrations, we only found one NVSS source, NVSS J053338-241301. This source is located only away from the galaxy member #3 of EIS J0533-2412 , an emission line galaxy, and is probably associated with it. However, it is too far away from XMMU J053337.8-241250 () to be its counterpart, the positional uncertainty of EPIC/MOS being less than . It could however contaminate the X–ray emission. On the other hand there are at least two photometric members (see Fig. 1) within the error box of the X-ray source, which could be associated with it. For XMMU J053344.4-241048 there is a bright optical source at a distance of of the maximum of the X-ray emission but this source is not part of the colour selected galaxies. However, there are several faint R galaxies around the X-ray maximum but with no photometric redshift information.
3.6 Upper limit on the ICM Luminosity
Since, as discussed above, it is very likely that the X–ray emission we observe is at least heavily contaminated by AGN emission, the source count rates must be regarded as upper limits for a non resolved ICM. However, there might still be ICM emission more diffuse than the detected X-ray sources and hidden within the background. We estimate an upper limit (at the level) on this emission by fitting the profiles with a point source plus a beta model with a core radius of (see above) and . We obtained an upper limit of ct/s, lower than the count rates of the X–ray sources. Since these count rates are lower than the actual measured source count rates, the observed count rates can thus be considered as firm upper limits on the overall ICM emission.
From the measured source count rates we derive an upper limit on the ICM luminosities of the two cluster candidates. To convert the actual count rate , ct/s for XMMU J053344.4-241048 and ct/s for XMMU J053337.8-241250 , to luminosity we used the XSPEC package and the EPIC/MOS response. We use an absorbed MEKAL model with an assumed temperature k keV, a hydrogen column density of (Dickey & Lockman DL (1990)), and a metal abundance of 0.3 times the solar value. For CL J0533-2411 we do not have a precise redshift estimate. The derived bolometric X-ray luminosities are for and for . For EIS J0533-2412 we derived .
4 Discussion
4.1 The nature of the cluster candidates
The upper limit on the ICM bolometric luminosity is low enough for EIS J0533-2412 to shed some light on the nature of this galaxy system. We recall that spectroscopic VLT observations indicate that this is a real physical system, and not only a chance alignment of galaxies. First we note that the upper limit on the luminosity of EIS J0533-2412 is similar to the luminosity of a poor cluster like Virgo in the nearby Universe, (Arnaud & Evrard ae (1999)). On the other hand, the matched filter parameter, , an estimate of the effective optical luminosity, is especially high: . Using at face value the correlation111 for and km/s/Mpc. For the cosmological parameters considered here, the luminosity must be multiplied by 2.47 at . between X–ray bolometric luminosity and derived by Donahue et al. (don01 (2001)) from their joint optical/ROSAT survey, we would expect a bolometric luminosity of at least . This is twice the luminosity of Coma, (Arnaud & Evrard ae (1999)). This apparent contradiction can be naturally alleviated if we simply assume that EIS J0533-2412 is a massive proto-cluster. In other words, EIS J0533-2412 is a rich overdensity of galaxies (as indicated by the high value), which is still largely in a pre-virialised state (hence a low X–ray luminosity because the gravitational potential is not deep enough to heat all the gas at the virial temperature). In view of the galaxy distribution, we can even speculate further. The probable structure members (selected on their J-K color) seem to follow a S-W/N-E filamentary structure, with the R clump in the middle. This R clump could be the “seed” (may be partially virialized) on to which the whole structure will finally collapse. To further check this hypothesis we need more spectroscopic VLT measurements to fully assess the 3D structure of the galaxy concentration and the dynamical state of the R clump.
Since we have neither spectroscopic redshift measurement nor richness information on CL J0533-2411 , the nature of this galaxy concentration remains entirely open. We can only tell it is not a very massive cluster in view of the upper limit on the X–ray luminosity.
We found evidence of AGN activity in the center of both galaxy concentrations. Interestingly, there is also evidence of such activity in RX~J0910+5422 (), a massive cluster in a much more advanced stage of formation. High resolution Chandra deep observation indeed revealed the presence of 3 AGNs associated with cluster galaxies within the central part of the cluster. This aparently common AGN activity in high z (proto) clusters might simply reflect a high AGN activity in the past: the luminosity function of X–ray selected AGNs shows a strong density evolution at redshift up to (Miyaji et al. miyaji (2000)). AGN activity could also be further boosted in regions of high galaxy concentration as compared to the field (environmental effects). To assess this issue requires statistical analysis of combined Large Scale X-ray/optical surveys (e.g. the XMM-LSS, Pierre et al. pierre (2002)). Inversely, if AGN activity for galaxies is indeed higher in overdense regions then looking at the surroundings of AGN’s might be an interesting way to find distant galaxy clusters.
4.2 Searching for virialized massive high redshift clusters
Calculating the ratio of number density of massive high to low redshift clusters is a powerful tool for the determination of cosmological parameters (Perrenod perr80 (1980)). The higher this ratio, the lower the corresponding density parameter . Thus, in principle it is sufficient to detect distant massive clusters and to compare their number density to nearby ones to determine . However, despite the launch of XMM-Newton and Chandra the detection of extended X-ray emission of clusters of galaxies at redshifts beyond unity is still very difficult. As already mentioned, only four clusters with with extended X-ray emission have been found so far, and their corresponding X-ray luminosities lie well below erg/s, which makes them not very massive objects. Up to now those clusters were either found in deep X-ray observations (Hasinger et al. has98 (1998); Rosati et al. rosati (1999)), or via a search for clusters in infrared bands (Stanford et al. stan97 (1997)). These detection techniques require relatively long exposure times and/or the use of the largest telescopes available with small field-of-view. This causes the sky coverage to be very small, which makes it difficult to assess the number density of massive distant clusters with high precision and which is furthermore biased by the various detection techniques applied.
Our approach for detecting massive galaxy clusters via a search in optical/infrared bands and the lack of finding clear evidence for ICM emission underlines the above mentioned difficulty. Recent studies indicate that there is clearly a decoupling of optical and X-ray parameters for clusters at redshifts above unity (Donahue et al. don02 (2002)). There are a lot of promising distant cluster candidates detected with high signal in optical wavelengths, which at first sight, surprisingly, do not have a corresponding luminous X-ray counterpart. At redshifts below unity, the correlation between optical and X-ray luminosity seem to match better, as was indicated recently by Donahue et al. (don01 (2001), don02 (2002)).
What could be a possible explanation for this? One answer could be that the optical/infrared indicators do not match galaxies embedded in clusters at . This implies a not yet accounted for evolution of galaxy properties. Another explanation could be that there is no or not substantial evolution in the galaxy physics of clusters but strong evolution of their X-ray properties and dark matter halos around . This could imply, that massive clusters and their corresponding dark matter halos, which we observe today formed or collapsed at redshifts close to 1. If this is true, distant clusters detected in X-rays at redshifts close to unity should show a high degree of significant substructure. In fact, all clusters clearly detected in X-rays at these redshifts show indication of substantial substructure, which strengthens the hypothesis of important cluster evolution at . In this case galaxy overdensities found in optical/infrared wavelength bands, such as the two cluster candidates presented here, could show the overdensities or cluster “seeds”, which then collapse later into clusters detectable as extended X-ray sources. The galaxy density enhancements can in this case be interpreted as a tracer for regions of future cluster formation.
5 Conclusion
The XMM-Newton observations of two promising high redshift () cluster candidates found in optical/infra-red wavelength bands, CL J0533-2411 () and EIS J0533-2412 (), reveal clear X-ray emission. However, the extracted surface brightness profiles of the two corresponding X–ray sources, XMMU J053344.4-241048 and XMMU J053337.8-241250 , are comparable with the shape of the PSF. We argue that the X–ray sources are very likely AGN members belonging to the galaxy concentrations.
We derived an upper limit for the bolometric luminosity of a hot ICM in the range for CL J0533-2411 , depending on the exact redshift. For EIS J0533-2412 the limit is . This low luminosity found for a rich spectroscopically confirmed galaxy system, can be explained if EIS J0533-2412 is in fact a massive proto-clusters which has not yet had sufficient time to collapse.
Our results indicate that rich galaxy overdensities at high redshift found in optical/infrared surveys are not necessarily massive virialised clusters. On the other hand they are of unique value for our understanding of structure formation and the dynamics of cluster collapse. Such surveys can reveal pre-virialised large galaxy overdensities or cluster “seeds”, which will collapse later into clusters detectable as extended X-ray sources. Detailed multiwavelength follow-up of large optical surveys is essential. Multi-object spectroscopy is required not only to confirm the physical reality of the systems, but to fully address their 3D structure and the dynamical state of the structure. Combined observations with high resolution X-ray instruments (like Chandra ) and high throughput instruments (like XMM-Newton ) are needed at the same time to i) assess the level of AGN activity which might be high in such young systems ii) map the virialised gaseous part of the structures.
Acknowledgements.
We would like to thank S. Majerowicz for providing the code to extract surface brightness profiles from photon-event tables from XMM-Newton data.References
- (1) Arnaud, M., & Evrard, A. 1999, MNRAS, 305, 631
- (2) Arnaud, M., Aghanim, N., Gastaud, R., et al. 2001, A&A, 365, L67
- (3) Benoist, C., da Costa, L., Jørgensen, H.E., et al. 2002, A&A, A&A, 394, 1
- (4) Benoist, C., da Costa, L., Olsen, L. F. et al. 1999, A&A 346, 58
- (5) Condon, J. J., Cotton, W. D., Greisen, E. W., et al. 1998, AJ, 115, 1693.
- (6) da Costa, L., Scodeggio, M., Olsen, L. F., et al. 1999, A&A, 343, L29
- (7) Dickey, J.M.,& Lockman, F.J. 1990, ARA&A 28, 215
- (8) Donahue, M., Mack, J., Scharf, C.A., et al. 2001, ApJ, 552, L93
- (9) Donahue, M., Scharf, C.A., Mack, J., et al. 2002, ApJ, 569, 689
- (10) Evrard, A.E., Metzler, C.A., & Navarro, J.F. 1996, ApJ, 469, 494
- (11) Evrard, A.E., & Gioia, I. 2002, Merging Processes in Galaxy Clusters, ed. L. Feretti, I.M. Gioia, G. Giovannini, Astrophysics and Space Science Library, Vol. 272, 253
- (12) Ghizzardi, S. 2001, In Flight Calibration of the PSF for the MOS1 and MOS2 Cameras, XMM-SOC-CAL-TN-0022, http://xmm.vilspa.esa.es/user/calib-top.html
- (13) Hashimoto, Y., Hasinger, G., Arnaud, M., Rosati, & P. Miyaji, T. 2002, A&A, 381, 841
- (14) Hasinger, G., Giacconi R., Gunn, J.E., et al. 1998, A&A, 340, L27
- (15) Hasinger, G., Altieri, B., Arnaud, M., et al. 2001, A&A, 365, L45
- (16) Holden, B., Stanford, S. A., Rosati, P., et al. 2001, Tracing Cosmic Evolution with Galaxy Clusters, ed. S. Borgani, M. Mezzetti, & R. Valdarnini, ASP Conference Proceedings, Vol. 268, 31, astro-ph/0110032
- (17) Jørgensen, H.E. et al. 2003 in preparation
- (18) Majerowicz, S., Neumann, D.M., & Reiprich, T.H. 2002, A&A, 394, 77
- (19) Martini, P., Kelson, D. D., Mulchaey, J. S. Trager, S. C. 2002, ApJ, 576, L109
- (20) Miyaji, T., Hasinger, G. & Schmidt, M., 2000, A&A, 353, 25
- (21) Neumann, D.M., & Böhringer, H. 1997, MNRAS, 289, 123 n
- (22) Neumann, D., & Arnaud, M. 1999, A&A, 348, 711
- (23) Nonino, M., Bertin, E., da Costa, L., et al. 1999, A&A, 137, 51
- (24) Olsen, L. F., Scodeggio, M., da Costa, L., et al. 1999, A&A, 345, 681
- (25) Perrenod, S.C., 1980, ApJ, 236, 373
- (26) Pierre, M., Valtchanov, I. , & Refregier, A. 2002, New visions of the X–ray Universe in the XMM-NEWTON and CHANDRA era, eds. F. Jansen et al. , ESA SP-488, in press, astro-ph/0202117
- (27) Prandoni, I., Wichmann, R., da Costa, L. et al. 1999, A&A 345, 448
- (28) Rosati, P., Della Ceca, R., Norman, C., Giacconi, R. 1998, ApJ, 492, L21
- (29) Rosati, P., Stanford, S. A., Eisenhardt, P. R., et al. 1999, AJ, 118, 76
- (30) Rosati, P., Borgani, S., & Norman, C. 2002, ARA&A, 40, 539
- (31) Scodeggio, M., Olsen, L. F., da Costa, L., et al. 1999, A&AS, 137, 83
- (32) Stanford, S. A., Elston, R., Eisenhardt, P.R., et al. 1997, AJ, 114, 2232
- (33) Stanford, S. A., Holden, B., Rosati, P., et al. 2001, ApJ, 552, 504
- (34) Stanford, S. A., Holden, B., Rosati, P., et al. 2002, AJ, 123, 619