Internal Extinction in Spiral Galaxies in the Near Infrared
Abstract
In order to study the effects of internal extinction in spiral galaxies we search for correlations of near infrared (NIR) photometric parameters with inclination. We use data from the 2 Micron All-Sky Survey (2MASS) Extended Source Catalog (XSC) on 15,224 spiral galaxies for which we also have redshifts. For 3035 of the galaxies, I-band photometry is available which is included in the analysis. From the simple dependence of reddening on inclination we derive a lower limit to the difference in magnitude between the face-on and edge-on aspect of 0.9, 0.3 and 0.1 magnitudes in I (0.81m), J (1.25 m) and H (1.65 m) bands. We find that the faintest isophotal radius reported in the XSC (at the 21st mag arcsec-2 level) is closer to the centers of the galaxies than other common isophotal measures (e.g. the 23.5 mag arcsec-2 radius in I-band), and argue that it should not be assumed to represent an outer isophote at which galaxies are transparent at all viewing angles. A simple linear extinction law (i.e. ) is not adequate for the full range of disk inclinations and we adopt both a bi-linear and a quadratic law. A simple photometric model is used to explain the observed behavior. Internal extinction depends on galaxy luminosity. We show that for galaxies with a Ks total magnitude dimmer than -20, -20.7 and -20.9 the data indicates zero extinction in J, H and Ks respectively, while disk opacity increases monotonically with increasing disk luminosity.
1 Introduction
The determination of an accurate value for the internal extinction in galaxies is of relevance both in the understanding of their structure and in applications such as the determination of redshift independent distances. Edge-on spirals are used preferentially in studies that apply the luminosity-linewidth relation (Tully & Fisher 1977) and these are, of course, the galaxies in which extinction effects will be the largest. Inadequate corrections for extinction will produce systematic distance errors in our catalogs. Recent discussions of this issue can be found in Disney & Burstein (1995) and Calzetti (2001), while a comprehensive history of the study of internal extinction in galaxies can be found in the introduction of Huizinga (1994). Analyses similar to the ones carried out in this paper can be found in Giovanelli et al. (1994; hereafter G94, and 1995) and Tully et al. (1998).
Since there is intrinsic variability in the properties of galaxies, the determination of the amount of extinction is most readily obtained in a statistical way, in which case large samples are desirable. However, sample selection effects need to be well understood in order to avoid interpreting spurious effects as astrophysically significant. There will be further discussion of the effects of such biases on the results of this paper in Sections 5.3 and 6.2.
In this paper we report on statistical tests which search for the effects of extinction in spiral galaxies in the near infra-red (NIR) bands, I (0.81 m), J (1.25 m) , H (1.65 m) and Ks (2.17 m). NIR bands are often used in cases where accurate total magnitudes of galaxies are needed, as they clearly minimize, if not eliminate, the need for extinction corrections. For this reason it is particularly interesting to search for the effects of extinction in these bands.
Samples and available data are described in Sections 2 and 3. In Section 4 we apply simple tests for reddening with inclination and in Sections 5 and 6 we discuss in more detail the effects of extinction on the isophotal radius and total magnitudes respectively. A simple photometric model for the extinction is discussed in Section 7 and in Section 8 luminosity dependences are discussed. A summary of the conclusions is given in Section 9.
2 Description of the Samples
The Two Micron All-Sky Survey (2MASS) completed its coverage of the near infra-red sky in February 2001. Data were taken in three NIR bands, J, H and Ks using two identical 1.3m telescopes, one in Arizona, the other in Chile. With an extended source sensitivity of 14.8, 14.0 and 13.4 mag at J, H and Ks (Jarrett et al., 2000) and an angular resolution of about 2-3 arcseconds, 2MASS has detected more than 1.65 million galaxies (Jarrett et al., 2003); the resultant data are available in the Extended Source Catalog (XSC)111Available through the online catalog query service of the IR Science Archive: http://irsa.ipac.caltech.edu/applications/Gator/.
Two samples were extracted from the 2MASS All-Sky release XSC. For statistical studies the samples should be as large as possible, but it is also important for them to have well defined selection criteria. The first sample (and by far the largest) consists of all galaxies with well defined spiral morphology and known redshift taken from the Arecibo General Catalog (a private compilation by the authors known as the AGC). Nearby, peculiar motions contribute significantly to observed recessional velocities so we further limit the AGC to km s-1 in order to use the redshift as a reliable distance indicator. This large sample is referred to as the AGC. The AGC is an all-sky compilation, but has varying completeness functions in different areas of the sky. A second, smaller sample consists of galaxies in the AGC for which I-band photometry is also available (as will be described below). This sample we call the SFI2 as it contains all of the SFI data (Giovanelli et al., 1997; Haynes et al., 1999a, b) plus similar but newer and as yet unpublished additions to that. This sample is a homogeneous all-sky sample of mostly Sc galaxies. In summary:
- AGC
-
Spiral galaxies of known redshift from the Arecibo General Catalog. The redshift was further confined to 3000 km s-1. This sample includes a total of 15244 galaxies.
- SFI2
-
Galaxies from AGC which also have I-band photometry available. This sample has a total of 3035 galaxies, which are mostly of types Sc and Sbc.
The detection fractions of these galaxies in the 2MASS XSC (within 12″ of the previously cataloged position) are 80% for the AGC and 85% for the SFI2 sample. We expect that this is due in part to the detection limits of the 2MASS survey and in part to the accuracy of the currently tabulated positions of the galaxies in the AGC. In support of this assumption the detection fraction increases for the SFI2 galaxies that are expected to have more accurate positions in the AGC. For the Second Incremental release of 2MASS data, a discussion of completeness is included in the on-line Explanatory Supplement222The Explanatory Supplement to the 2MASS Second Incremental Release (Curtri et al., 2000) is an on-line document: http://www.ipac.caltech.edu/2mass/releases/docs.html. When the search for a match is extended to a radius of 0.5′ of known galaxies from the Zwicky Catalog, the detection rate is 95%. In the NIR, surface brightness decreases towards later type galaxies (Jarrett et al., 2003) making late type, gas rich galaxies (like the Sc galaxies which make up the bulk of the SFI2 sample) harder to detect than E/S0/Sa galaxies.
3 Description of data
For all of the galaxies in our samples various data are available. These included redshifts, coarse blue magnitudes and angular sizes from the AGC, photometry from 2MASS and I-band photometry for the SFI2 sample. In the computation of absolute magnitudes a value of H km s-1 Mpc-1 is adopted.
3.1 I-band photometry
The I-band photometry available for the SFI2 sample is described in Haynes et al. (1999a). Quantities of particular interest are:
-
- I-band axial ratio derived from a fit of elliptical surface brightness contours to the I-band images. The average error in is 0.03.
-
- radius measured at the I-band isophote of 23.5 mag arcsec-2.
-
- total I-band magnitude. Calculated from an extrapolation of a fit to the disk to 8 scale lengths of the disk. Typical total errors are in the range 0.03-0.06 mag.
-
- scale length of the disk derived from a fit to the one-dimensional I-band photometric profile.
3.2 Photometric quantities from the 2MASS XSC
The photometric quantities in the XSC are derived by inspecting the 2MASS images with the extended source processor (GALWORKS), which was developed for this purpose (see Jarrett et al. 2000). By the time the 2MASS images get to GALWORKS a point source spread function has already been derived for each image. GALWORKS identifies extended sources (galaxies as well as other more nearby resolved sources) and measures a variety of parameters for each one as described in Jarrett et al. (2000) and in the 2MASS Explanatory Supplement (Curtri et al., 2000). Very large galaxies (greater than 5′ in size at th mag arcsec-2 in J-band) are first identified in in a separate large galaxy atlas333See: http://irsa.ipac.caltech.edu/applications/2MASS/LGA/ and then added to the XSC. The quantities from the XSC that we use are:
-
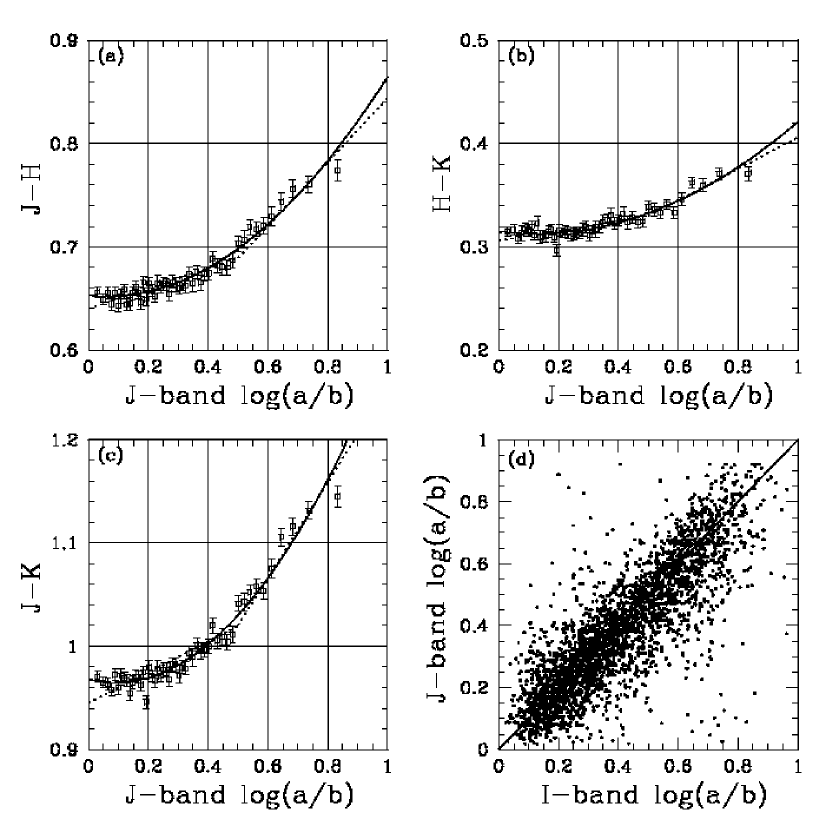
- J-band axial ratio fit to the 3 isophote (which is close to the 20th mag arcsec-2 isophote). The center of this ellipse fit is fixed to the peak intensity pixel and since only one isophote is fitted, it is an approximation to the ellipticity of the galaxy. If the 3 isophote is too close to the center of the galaxy the bulge might interfere with the derived ellipticity, making the galaxy appear more face-on than it really is. Of the three 2MASS bands, the J axial ratio should suffer the least from this effect; we note that no systematic offset is seen between the J-band and I-band axial ratios, as can be seen Figure 4d. An estimate of the average error of 0.1 in is derived from the scatter in this plot; this is more than three times as large as the average error estimated for the equivalent I-band quantity.
- , ,
-
- semi-major axis of the isophotal elliptical aperture set to the 21st mag arcsec-2 isophote individually in each band. An alternative to this would have been the semi-major axis of the ellipse fit to the 20th mag arcsec-2 isophote, which is the preferred aperture in the XSC (Jarrett et al., 2003). In Section 5.1 it is shown that in J-band is at scale lengths of the disk (), while in H and Ks it is . A similar analysis for shows that , and r. We choose to use in order to trace the disks as far out as possible (which still is not far compared to ). Since the typical 1 background noise is 21.4, 20.6 and 20.0 mag in J, H and Ks respectively (Jarrett et al., 2003), we must be careful in using the radii set to the 21st mag arcsec-2 level, especially in H and Ks. In J-band should be reasonably well defined, and does indeed show good correlation with with a scatter of about 3 ″. The same analysis for H and Ks shows a similar correlation with a slightly larger scatter (3.5″ and 4 ″ respectively). When is smaller than 7″ or greater than 120″ (for either isophote and in all bands) it does not follow the correlation well. These radii are not used.
- J21f, H21f, K21f
-
- magnitudes within the 21st mag arcsec-2 elliptical isophote set in J-band (referred to as “J fiducial” are used to construct colors because of the necessity of having a consistent aperture. The uncertainty on these magnitudes listed in the XSC is that associated with Poisson noise and background subtraction and does not include other errors such as the zero point calibration and the uncertainty in the elliptical isophotal aperture (see Jarrett et al. 2000 for more details). This formal uncertainty is small (with the largest quoted at only 0.2 mag) and the real uncertainty is likely to be larger. The “Level One Science Requirements” of 2MASS (which can be found in the on-line Explanatory Supplement) require that the extended source photometry be accurate and uniform to within 10% , and we assume this is a closer estimate of the error in the magnitudes.
- J21f, H21f, K21f
-
- magnitudes measured within the 21st mag arcsec-2 level set in J-band are used to construct colors.
- Jext, Hext, Kext
-
- XSC “extrapolated” magnitudes designed to represent the total magnitude of the galaxy. These magnitudes are derived from an extrapolation of the radial surface brightness profile from the 20th mag arcsec-2 elliptical isophote down to which is set to 5 times the scale length from the J-band fit. See Jarrett et al. (2003) for more details.
3.3 Corrections
In order to use the photometry from the 2MASS XSC to its best potential for our purposes, various corrections for seeing, galactic extinction and cosmological redshift need to be applied. These corrections have already been applied to the I-band quantities in a similar manner as that described below (for details, see Haynes et al. 1999a).
3.3.1 Seeing correction
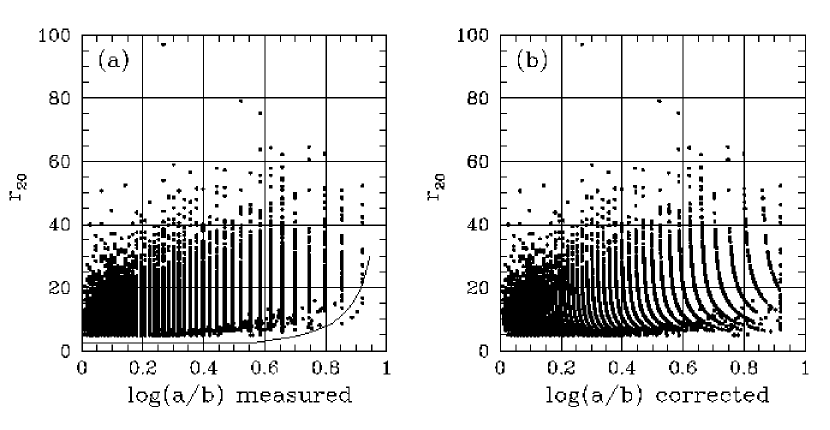
Figure 1a shows a plot of vs. the 20th mag arcsec-2 isophotal radius (the approximate isophotal radius at which is reported). We see that there is a lack of galaxies with both high axial ratio and small size. This is due mainly to the resolution of the images set by the seeing and the pixel size.
In the XSC, seeing is characterized using a modified exponential of the form
| (1) |
fit to many stars in each frame, where is the central surface brightness, is the radius in arcseconds and and are free parameters. The “radial shape” () is reported, and an approximate relation is given in the 2MASS Seeing and Image Statistics 4442MASS Seeing and Image Statistics (Cutrie 1998) is an on-line document found at: http://spider.ipac.caltech.edu/staff/roc/2mass/ to recover the full width at half maximum of the point spread function;
| (2) |
The mean value of this FWHM is about 2.5″ for the galaxies in our samples (the 2MASS raw images have a pixel size of 2″ which sets the lower limit on the resolution), and the spread is small. We derive a correction by numerically convolving exponential disks of varying inclination and angular sizes with a Gaussian of FWHM = 2.5″. Axial ratios are measured at a radial distance from the galaxy center of (where refers to the scale length of the exponential disk), corresponding to in J-band (the ratio is obtained in the same way as in Section 5.1). The derived correction is parameterized as
| (3) |
with
| (4) |
(where FWHM = 2.5″ is used in all cases and is measured in arcseconds in the J-band image). Hereafter, when we refer to the J-band axial ratio, we refer to the quantity corrected by the above equation. The result of the correction can be seen in Figure 1b. In a few cases where the galaxy is very small and highly inclined the correction is large so to avoid over-correcting a maximum value of is imposed and these galaxies are assumed to have an inclination of 90°. From Figure 1b it appears that the correction removes much but perhaps not all of the bias, so very small galaxies may appear less inclined than they really are. It should also be noted that the derived correction assumes light profiles are exponential, which may not be an ideal approximation within the radius in J-band where the contribution from a bulge may be significant.
3.3.2 Galactic Extinction and K-corrections
Magnitudes are corrected for galactic (i.e. originating within the Milky Way) extinction using the DIRBE galactic extinction maps (Schlegel, Finkbeiner & Davis 1998). The column densities listed in the map are converted to extinction in the relevant bands by , and . A small cosmological k-correction is also included using a simple linear fit to the low redshift end of the models of Poggianti (1997) which is , , and .
The magnitude in band X corrected for galactic extinction and cosmological k-correction is then
| (5) |
The isophotal radii also need to be corrected for galactic extinction. If we assume the disk photometric profiles are exponential with scale length in band X, then
| (6) |
(since the surface brightness at radius in an exponential disk is given by ). We also correct sizes for a cosmological stretch factor .
4 Reddening
In this section we use the samples defined above in Section 2 to investigate the effects of internal extinction in the disks by investigating color gradients with inclination. This test has the advantage of suffering little from selection effects. For the SFI2 sample, we use the I-band axial ratios as the measure of inclination since these have errors almost three times smaller than the equivalent J-band measure from the XSC. The result is shown in Figure 2 in which colors (measured within an elliptical aperture with a semi-major axis of in J-band) are plotted vs. axial ratio. It is clear that reddening is present in all colors, which sets a lower limit to the extinction in the J and H bands by assuming that the extinction in Ks is negligible. Following G94 and others, we parameterize the internal extinction as
| (7) |
The lower limit on is then 0.3 mag in J and 0.1 mag in H. The formal error in fitting this slope to the data is 0.01 mag in both cases, while the scatter in the relationship is 0.1 mag. If there is extinction present in Ks-band (i.e. ), the actual values of in J and H will be and respectively. An indication that the linear law of Eqn 7 may not be appropriate for the highest inclinations is apparent in panels (a) and (c) of Figure 2, an issue we’ll revisit below and in Section 6.
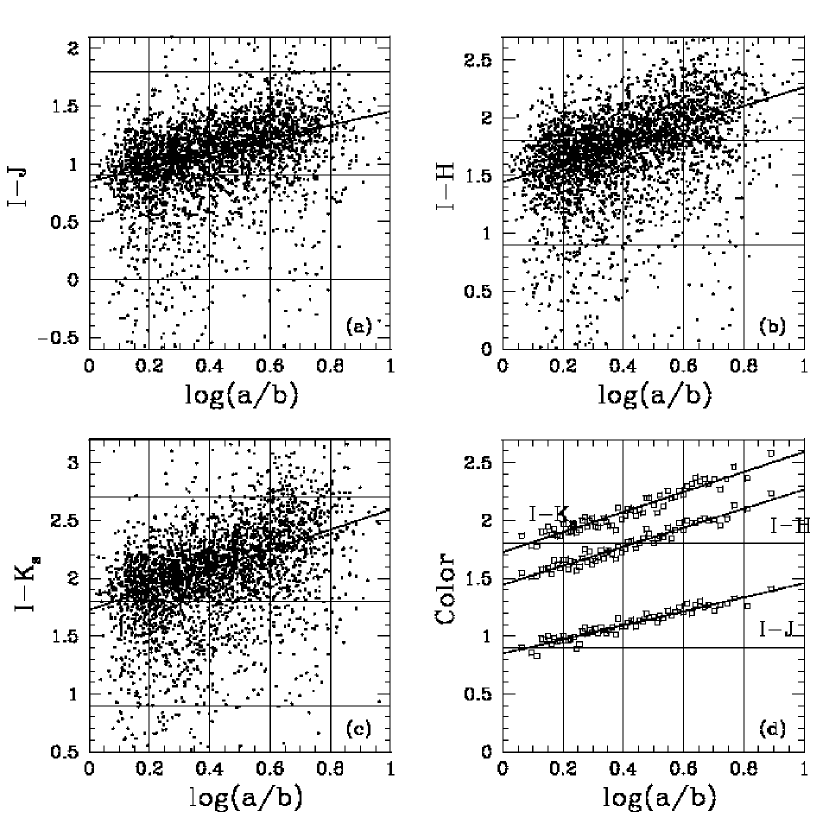
For the SFI2 sample, I-band magnitudes are also available. These magnitudes can be used to construct I-J, I-H and I-Ks colors, with the understanding that the apertures are not consistent between I and the other bands. This mismatch should not, in the first order, affect the slope of the reddening, just the absolute color. The results of this are shown in Figure 3. Under the assumption that the extinction in Ks is negligible, we derive a lower limit on the extinction in I-band of mag (where the error is the formal error in determining the slope). G94 find an extinction law of , while Tully et al. (1998) derive , suggesting that if the extinction in Ks is not equal to zero, it is likely to be small.
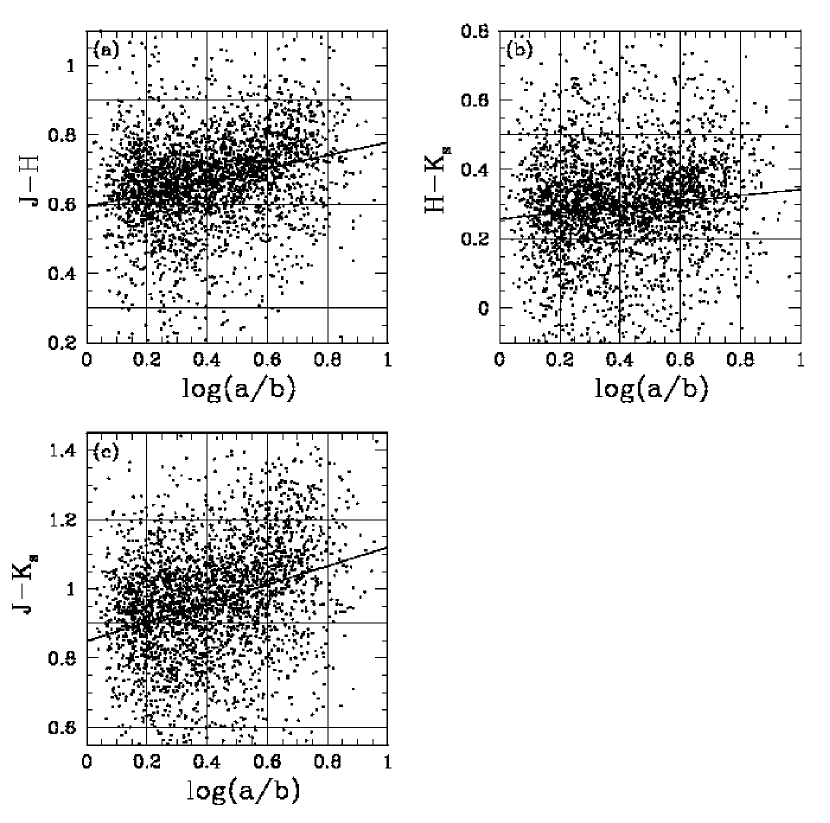
For the much larger AGC sample of galaxies (which does not have I-band photometry for all the galaxies), we can plot the J-H, J-Ks and H-Ks colors against the J-band axial ratios (Figure 4). Since the sample is large, we combine the points into averages in bins which makes the inadequacy of a simple linear law for the relationship (as noted in Figure 2) stand out. We fit two separate lines respectively for less than and greater than 0.5, and also include a quadratic fit for comparison. The parameterization of with a linear law in Eqn 7 is an expedient form, and internal extinction can well depart from such a linear law, depending on the details of the relative distribution of stars and dust (see, e.g. Evans 1992 and G94). In most simulations, in fact, steepens with increasing as will be shown for a simple photometric model in Section 7. Our adoption of bi-linear and quadratic fits reflects a least departure from simple expediency. The location of the break in the bi-linear law at for all color trends is also practical but arbitrary. The slopes of the bi-linear relation are 0.10 0.02 and 0.31 0.05 for J-H, 0.05 0.02 and 0.15 0.05 for H-Ks, and 0.15 0.02 and 0.46 0.05 for J-Ks. The quadratic fit is 0.65(20) - 0.03(1) + 0.24(2) for J-H, 0.31(25) - 0.04(2) + 0.14(2) for H-Ks, and 0.97(28) - 0.07(2) + 0.39(3) for J-Ks.
5 Effect of inclination on isophotal radius
5.1 Formal corrections for inclination
If a galaxy is completely opaque within a given isophotal radius in the face-on perspective then no change in the measured radius is expected with inclination. If it is assumed that the face-on disk is transparent at that radius, then the isophotal radius should increase as the disk is tilted and we look through a longer path length. The expected change derived for the simple case of a pure exponential disk is
| (8) |
where and are respectively the isophotal radius and the disk scale length in the face-on case. If we assume that the scale length changes with inclination like (which is justified by the observation that the ratio does not change with inclination, as seen below) then we derive
| (9) |
We have the scale lengths in I-band measured for the SFI2 sample and make the assumption that scale lengths do not change significantly between I, J, H and Ks-band, as found by de Jong (1996) from a sample of 86 face-on spiral galaxies. In their sample, scale length is seen to decrease as the wavelength increases, but not significantly between I and K. A measure of the scale length is provided in the XSC for all of the galaxies in our sample, but given the notorious difficulties with fitting scale lengths, we choose not to use that automated measure here, and only use scale lengths from the SFI2 sample fit “by hand” (see Haynes et al. (1999a) for more details on the SFI2 scale lengths). Using these scale lengths we estimate and in J, H and Ks for the SFI2 galaxies (where the error here is the scatter in the sample), and we assume that these ratios hold for all the galaxies in the AGC sample. The ratio in Ks may be slightly smaller than in H, but this is within the errors. No significant dependence of the ratio on inclination is observed in any band. We note that the ratios imply that is at only scale lengths out in the disk, while in H and Ks, is still at only scale lengths. The commonly reported isophotal radius at I-band is at 3.5-4 scale lengths which is further out than .
If the face-on disks were transparent at we can rewrite Eqn 9 as
| (10) |
where and in J, H and Ks respectively, when we use the values given above. The isophotal radius does not change () if the disk is opaque at so must decrease as the disk becomes less transparent. The main limitation on Eqn 9 is that it assumes that the photometric profile is exponential, while it is expected that the importance of the bulge light increases in these NIR bands.
5.2 Are disks transparent at ?
Here we test the often made assumption that the outer disks of galaxies are transparent, especially in the NIR. Suppose that stars and dust are exponentially distributed with scale lengths . The disk opacity at radius and inclination is then
| (11) |
where is the opacity at in the face-on perspective. There have been many attempts to derive for spiral galaxies. G94 derive an upper limit in I-band of using statistical arguments with a sample of about 2000 Sc galaxies. A lower estimate of was obtained by Xilouris et al. (1999): they claim that in 7 edge-on spiral galaxies they model in K, J, I, V and B-bands. Kuchinski et al. (1998) derive values of using BVRIJHK photometry and radiative transfer models for 15 spiral galaxies. They adopt values in the ranges of 0.15-0.6, 0.1-0.4, and 0.05-0.2 for J, H and K respectively. Moriondo et al. (1998) find 0.3-0.5 in H-band from a sample of 154 galaxies. Even if were as high as it is easy to see that at the disk is close to transparent out to quite high inclinations. However it has been shown above that in J, H and Ks is closer to the center of the disk than so (in the above model) even for relatively low values of the opacity could become significant in a highly inclined disk. Figure 5 shows the inclination at which the galaxy becomes optically thick () plotted as a function of the radial distance for varying between 0.25 and 10.
At in J-band, which is , the disk can become opaque before it is fully inclined for even the smaller . If we interpret the change of slope for high inclinations shown in Figures 4 and 8a as the onset of at , a “break” for J-band () and H and Ks () near would suggest that the disk opacity in the J, H and Ks bands, while low, is non-negligible and that even at an important fraction of the light is extincted when disks are edge-on.
Recent studies suggest that the dust scale length is larger than that of the stars, see for example Moriondo et al. (1998) who use with . In the above model this simply changes the position of with respect to the dust scale length so that for example . In that case a lower central face-on opacity is required to explain the behavior.
5.3 A statistical test for the inclination dependence of isophotal radius
It is possible to test the mean change in isophotal radius with inclination in a statistical way using large samples of galaxies. For the test described below, the biases introduced by the selection function of the sample can be quite severe. In order to keep track of these effects, we use only galaxies north of declination ° from the AGC, since that region is known to be more homogeneously and completely sampled in the catalog. Most of the galaxies in the AGC were originally identified by eye from photographic plates on which small, dim galaxies are easier to pick out if they are edge-on. In an attempt to remove this bias we also restrict the sample to B 15.5. The samples are then further reduced to be flux limited (using from the XSC) or angular size limited (using ) within each band. The final 6 subsamples are taken to represent complete flux or angular size limited samples, and are summarized in Table 1.
| Band | Limit | No. galaxies |
|---|---|---|
| J | mag | 1774 |
| J | ″ | 3120 |
| H | mag | 2274 |
| H | ″ | 3137 |
| Ks | mag | 1733 |
| Ks | ″ | 2377 |
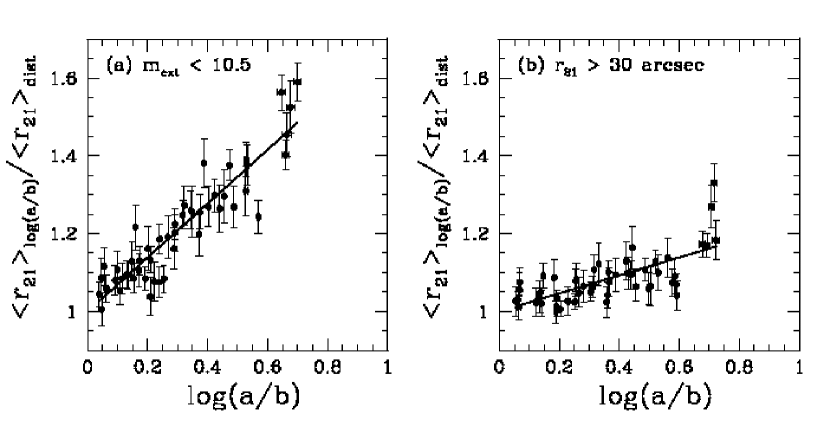
For either size or flux-limited samples, the mean value of , expressed in kpc, will increase with distance. In order to remove this simple manifestation of the Malmquist bias, we divide our sample into five distance groups with the same number of galaxies in each. Within each group the mean of is then computed in bins of . These bins all have an equal number of galaxies in them (30-60 depending on the size of the subgroup). Since there are few galaxies at high inclinations this restricts analysis of subgroups to 0.7-0.8 in most cases. In each of the bins the values of are scaled by the mean of the value for the whole distance group (). A relation is fit to the points and the value of (see Eqn 10) is calculated as . The results in Ks-band for both the size and flux-limited sub-samples are shown in Figure 6, and are summarized for each band in Table 2 along with the values of derived in Section 5.1 for the case of an exponential disk which is transparent at .
A comparison of panels 6a and 6b, constructed from flux and angular size-limited samples respectively, well illustrates the amplitude of the bias introduced by the character of the sample. This is explained as follows; as disks become more inclined, on average moves out and the total magnitude dims (assuming that the galaxies are neither totally transparent throughout the whole disk or totally opaque at ). In a sample defined by a threshold angular size, , galaxies that in the face-on perspective would be smaller than (and thus excluded from the sample) at high inclinations will appear to have a size greater than and will be included in the sample. As a result, this sample will exhibit a shallow v. slope as shown by Figure 6b. Alternatively, in a magnitude limited sample, intrinsically larger galaxies fall below the threshold magnitude if they are edge-on due to the dimming caused by extinction. This will have the effect of steepening the slope, as seen in Figure 6a.
| Band | Flux limited | Angular size limited | Transparent exponential disk |
|---|---|---|---|
| J | 1.2 0.1 | 0.5 0.1 | 0.9 0.3 |
| H | 0.8 0.1 | 0.3 0.1 | 0.7 0.2 |
| Ks | 0.7 0.1 | 0.2 0.1 | 0.7 0.2 |
Note that if disks were opaque, would not change with inclination (), and this result would be recovered by the analysis of an angular size-limited sample. On the other hand, if the disk dimming due to internal extinction is small or negligible, a flux-limited sample will return the correct value of through an analysis such as that represented in Figure 6a. The presumption of very low dimming at Ks-band, supported by the results discussed in Section 4, is further supported by the similarity of the value of in columns 1 and 3 of Table 3 for Ks-band. A final choice on the value of in each band needs to be made after an estimate of the amount of internal extinction so will be discussed in Section 6.3. It is probably safe to assume there is very little extinction in Ks so we can conclude here that .
6 Effect of inclination on magnitude
6.1 Formal corrections for inclination
Note that if the disks of galaxies are completely transparent all the way to the center, then there should be no change in the total magnitude with inclination (i.e. ) , while the magnitude enclosed within a fixed isophote will brighten as the physical radius at which it is measured moves out. If the disks are completely opaque, then both the total and isophotal magnitudes will dim by an amount 2.5 .
6.2 A statistical test for the inclination dependence of total magnitude
We test for the inclination dependence of the total magnitude (here taken to be as described in Section 3.3) using a method similar to that described in Section 5.3. We fit a relation to the mean values of the magnitude binned in within five separate distance groups. We use the flux and angular size limited samples described in Section 5.3, since (as for the test in Section 5.3) the interpretation must take into account bias introduced by the selection function of the sample. For an angular size limited sample with threshold , if the disk is not completely opaque all the way through, then will be increased as intrinsically small and dim galaxies move above at high inclinations. If the disks are completely opaque, this type of sample would recover the exact result of as the angular sizes are unaffected by inclination. For a flux limited sample, and if the galaxies are not completely transparent, internal extinction will dim galaxies at higher inclinations and force to be smaller. If the disks are completely transparent, this sample would recover the exact result of no change of total magnitude with inclination. The change in with sample selection is observed in all photometric bands explored here (as summarized in Table 3), providing further evidence that galaxies are neither completely opaque nor completely transparent in these bands. We note that under the assumption of little extinction in Ks, the flux-limited sample in that band should give a value of very close to the real value. This implies . In the other bands, J and H, we use this test to provide upper and lower limits to the actual extinction law as parameterized by .
| Band | Flux limited | Angular size limited |
|---|---|---|
| J | 0.2 0.1 | 1.2 0.1 |
| H | 0.1 0.1 | 0.8 0.1 |
| Ks | 0.2 0.1 | 0.7 0.1 |
6.3 The Modified Holmberg Test
Following G94 we use a modified version of the Holmberg test (Holmberg 1958, 1975). Define as the surface brightness within an elliptical aperture with semi-major axis . The original Holmberg test consists of measuring the change of with disk inclination. Unfortunately a similar trend can be found in both opaque and transparent galaxies. If the galaxy is totally opaque we expect that the radius at which a given isophote is measured will not shift with inclination and that the magnitude will dim by 2.5 , so a slope of 2.5 is expected. In the fully transparent case, fixed brightness isophotes will move to larger radii as the galaxies are tilted which will also decrease . From Eqn. 8 this geometric dilution alone (i.e. not taking into account the change in the isophotal magnitude as the aperture changes) is given by
| (12) |
between axial ratios and . This would give a change in between = 0 and 1 of 1.1 0.3 for the derived in Section 5.1 in H and Ks and 1.4 0.3 in J (where the errors indicate the scatter in ). These values provide an upper limit to the change since the isophotal magnitude will brighten slightly as the aperture increases.
Here, we do not use the isophotal magnitude, but rather a measure of the total magnitude (extrapolated magnitude from the XSC), to remove the effects of the physical size of the aperture changing with inclination. is respectively , and for the three 2MASS bands. In the following discussion we will refer to this radius as , with the understanding that it is separately measured in each of the three bands. The slope fit to vs. for galaxies in the AGC sample with lower inclinations (below ) is 2.0 0.1 in J, 1.6 0.1 in H and 1.3 0.1 in Ks. Since this is higher than the values given above for the transparent case we take it to be indication that there is extinction present in the inner parts of these galaxies, while the outer parts are largely transparent. This is supported by the radial variation of colors and surface brightness seen in large galaxies in the XSC (Jarrett et al., 2003). If the disk is transparent at the edges but not in the center, the change of from face-on to edge-on will be larger than the values for geometric dilution alone and can in fact be larger than 2.5 as there will be some dimming of the magnitude which is dominated by light from the inner parts of the disk.
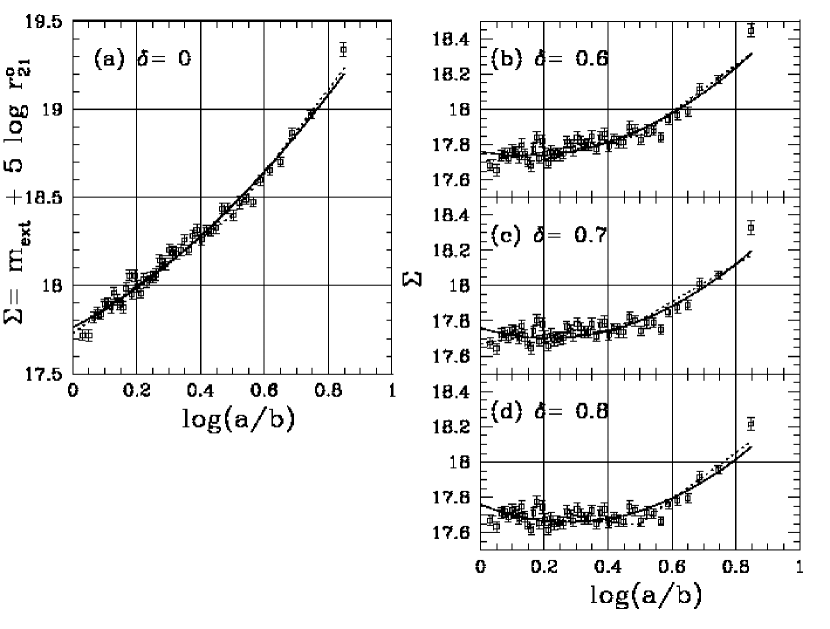
In order to remove the effect introduced by an inclination dependence of the isophotal radius, we adopt a modified version of the Holmberg test in which the isophotal radius in the face-on view is derived via Eqn 10. The value of which is used in Eqn 10 can significantly change the resulting slope. This is illustrated in Figure 7 which shows the standard Holmberg test (for galaxies observed in Ks-band) as well as the test with corrections using = 0.6, 0.7 and 0.8 (spanning the error range for discussed in Section 5).
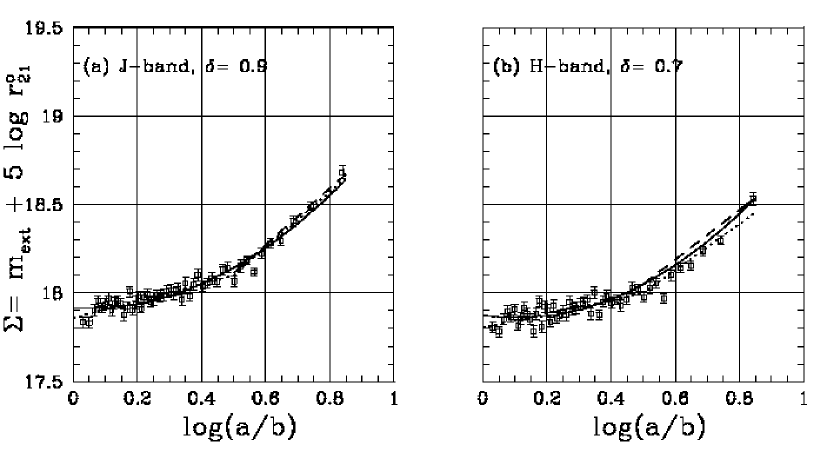
We will discuss the obvious up turn of these relationships further in Section 7 but for now deal with the low inclination () and high inclination () regions separately. At the low inclinations in Ks-band, changes from 0.31 (with ) to 0.05 (); a significant difference within the plausible range of . As a consequence of this interdependency, the best values of and must be decided upon together. Considering all the available evidence (Sections 5.1, 5.3 and 6.2) we adopt in Ks-band, in H-band, and in J-band. As a comparison, Moriondo et al. (1998) derive at the same isophotal level (from their sample of 154 galaxies). The results for just these values of in J and H can be seen in Figure 8, while the test with the chosen value of in Ks-band is shown in Figure 7c. We thus derive , , and for from this test (where the error indicates the variation in the value within the adopted value of . Similar values of (Moriondo et al., 1998) and (Tully et al., 1998) have been found before, although Graham (2001) and others suggest . While the variation of with the wavelength band depends on the detailed form of the geometric mixing of stars and dust, it is interesting to note that, in the simple geometric case of a foreground absorbing screen model, the extinction curve of our galaxy would yield , , and , if (see G94, Tully et al. 1998, Schlegel et al. 1998).
At the higher inclinations (above ) the modified Holmberg test is not appropriate as the disk is probably not completely transparent at . The values of used to correct to the face-on value of are therefore too large which artificially lowers the change in the average surface brightness and leads to an underestimate for . The standard Holmberg test (i.e. ) does not work either. As discussed above, if there is significant extinction present in the inner parts of the disks where most of the light comes from, but the outer edges are still at least partly transparent, the slope of vs. can be larger than 2.5 and so is obviously an overestimate of . This is observed in J, H and Ks (the slopes are 2.90.2, 2.40.2 and 2.40.2 respectively), providing evidence that the most inclined galaxies are not totally opaque or transparent at , and that there is significant extinction in the central regions. Since the extinction is lowest in Ks we expect that the disk is closest to transparent at in this band and therefore adopt the slope of the modified Holmberg test here to give a tentative value of for the more inclined galaxies (up to ). We then use the slopes of the reddening in J-Ks and H-Ks (above : and from Figure 4.) to suggest and . The difference between the bi-linear and quadratic fit is quite small (as can be seen in Figure 8), so we also provide a smooth fit to the points giving , and . Below , and 0.4 in J, H and Ks respectively the value for the correction should be zero – the upturn in the quadratic fit at low inclination is obviously unphysical.
7 Photometric Model
Here we investigate a simple photometric model which can be used to explain the upturn in the vs. relation at high seen in all three bands. The model used is that described in Section 9 of G94 which is based on the “triple exponential” model of Disney et al. (1989). This model assumes that the dust is distributed in the disk with an exponential scale length equal to the stars and that the distributions are also exponential with a ratio between the scale height of the dust and the stars. The face-on central surface brightness, can be specified, as can the ratio, , between the scale height and scale length of the stars. We use the “standard galaxy” of G94 which has 7% of the light in a central bulge.
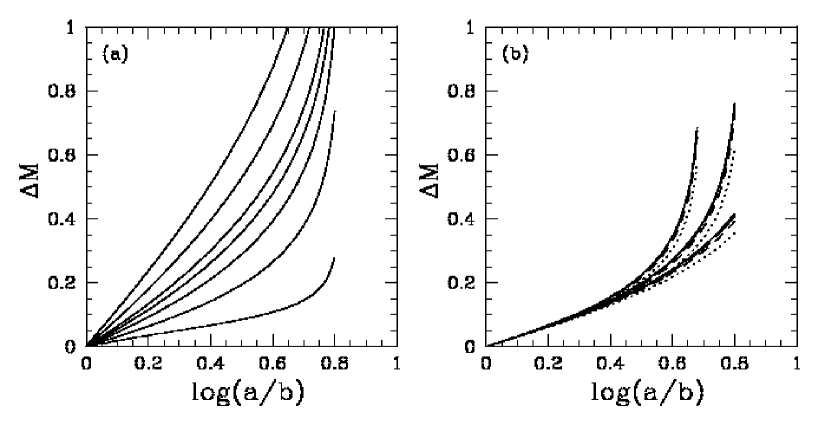
Figure 9 shows the difference between the magnitude at a given axial ratio and the face-on magnitude calculated for various inputs to the model. In the model the upturn becomes more noticeable with increasing (i.e. as the disk becomes thicker) and as the central face-on opacity decreases. The ratio between the thickness of the disk in the dust and stars has a much smaller effect as shown in Figure 9b.
Figure 10 shows our “best fit” to the Holmberg test points (Section 6.3). Note that at high inclinations the points are artificially lowered (see discussion in Section 6.3). The simple photometric model described here can explain the observed behavior. While the dependence of the models on the dust-to-stars thickness ratio is weak, best fit models favor low values of . This is consistent with the expectation that stellar disks may appear somewhat thicker in NIR light, as they are dominated by an older stellar population. The models shown in Figure 10 were computed for . The other parameters of the model are , in J-band, , in H-band and , in K-band. Reassuringly, the central face-on opacity of the best fit model decreases with increasing wavelength. Given the uncertainties in the Holmberg test (see Section 6.3) this model should be taken with caution, but does provide a plausible explanation for what is observed.
8 Luminosity dependence
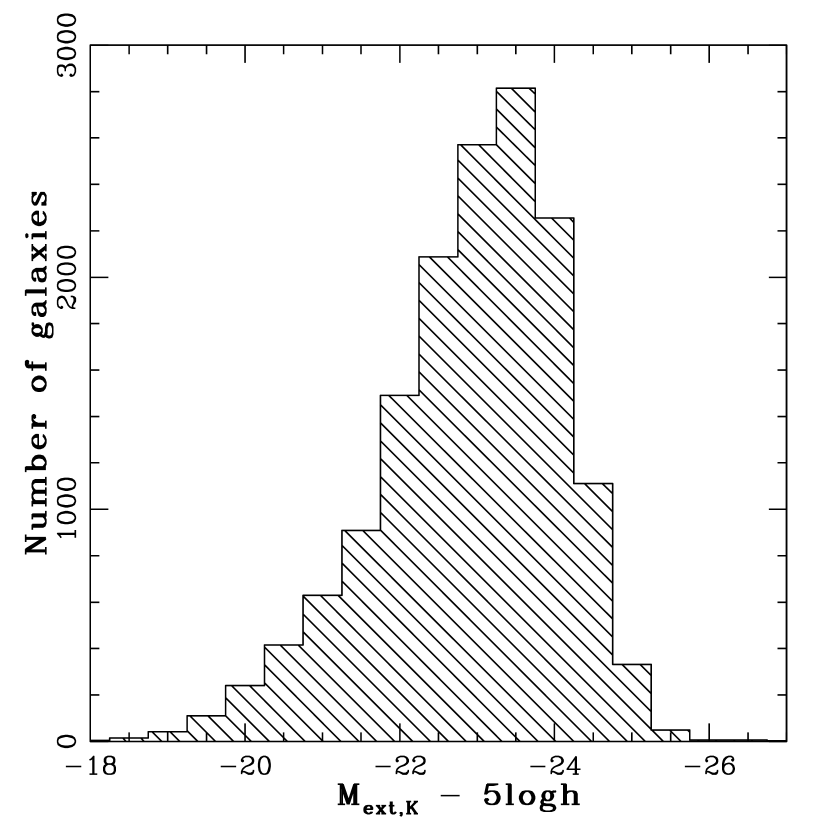
Here we use the AGC sample of 15,244 galaxies to search for luminosity dependences of the extinction laws, as was done in both Giovanelli et al. (1995) and Tully et al. (1998). As a measure of the total luminosity of the galaxy we use in K-band since this is least affected by internal extinction. The luminosity distribution is shown in Figure 11. The peak of the distribution is at , which is near to in K-band (Kochanek et al., 2001) and most of the galaxies in the sample are within one magnitude of this.
The expected dependence is that brighter galaxies will show more internal extinction at a given inclination than dimmer ones. This is due both to the increase in physical size (and thus optical path lengths) and to the increase in metallicity (and thus presumably dust content) in the more luminous galaxies.
8.1 Isophotal radius
Here we derive a parametric relation for the change of in with total luminosity as measured by . We discussed the expected value of for an exponential disk with scale length which is transparent at in Section 5.1. This is given by and is shown by the points in Figure 12 for galaxies from the SFI2 sample in 9 bins of luminosity (each with an equal number of galaxies). There is a clear trend for the ratio (and thus if the disks are transparent at ) to decrease with luminosity, as was also found by Giovanelli et al. (1995) in I-band, who also discuss why this trend is to be expected. We fit a cubic to these points which we truncate at both the highest and lowest luminosities. These fits are shown by the solid lines in Figure 12 and the fit parameters are listed in Table 4.
8.2 Magnitude
Here we apply the “modified Holmberg test” discussed in Section 6.3 to the full AGC sample to investigate the dependence of internal extinction (as parameterized by in Eqn 7) on galaxy luminosity. We divide the sample into 10 luminosity bins with 1500 galaxies per bin. We correct the isophotal radius to the face-one view using the cubic fit to the points in Figure 12. We then fit a single linear law to vs. for each luminosity bin as the subdivision in luminosity bins restricts statistics, especially at high inclinations.
The extent of the luminosity dependence of depends critically on the value used to correct radii to the face-on values. In the modified Holmberg test, an over-estimate of leads to an under-estimate of (and vice-versa). Since clearly decreases with luminosity, using a constant value of for all galaxies thus leads to an over-estimate of at low luminosities and an under-estimate at high luminosities and suppresses the expected luminosity dependence. The cubic fit in Figure 12 follows luminosity dependence of (under the assumption of transparency at ) and should be used here. The values of derived by using this are shown in Figure 13 as a function of luminosity. We find that over much of the range of luminosities the value of is roughly constant in each band. In support of this we observe that the slope of the reddening does not change much with luminosity. It is clear that at low luminosities the extinction in these bands does decrease significantly and (unlike as found for galaxies in I-band by Giovanelli et al. 1995) does fall off to zero for galaxies less luminous than , -20.7 and -20.9 in J, H and Ks respectively. The solid line in Figure 13 shows our adopted luminosity dependence for , which is broken into two regions. The relation is , , and , for , and , , and , for (where ). It should be noted that a straight line can fit within the errors on the points (dotted line in Figure 13), which are in .
If the assumption of transparency at is not valid then we are over-estimating and thus under-estimating . High luminosity galaxies have more extinction, but is also larger in these galaxies which could mean that they are more likely to be transparent at than low luminosity galaxies. What bias the assumption of transparency might introduce into this determinations of the luminosity dependence of is not clear.
9 Conclusions
Two samples of spiral galaxies are constructed, both of which have photometry from 2MASS and redshifts from the AGC. For the smaller sample (which has over 3000 galaxies), I-band photometry is also available. We apply a variety of statistical tests to look for disk inclination dependences in these galaxies. The results of these tests can be highly sensitive to the selection function of the sample and some interdependencies exist, but taken together they provide reliable information on the average internal extinction in the galaxies. We parameterize internal extinction via Eqn 7 and change of the isophotal radius via Eqn 10; these results are summarized in Tables 4 and 5, where the numbers between brackets indicate the error on the last digit of the parameter value.
| Method | J-band | H-band | Ks-band |
|---|---|---|---|
| For transparent exponential disks | 0.9(3) | 0.7(2) | 0.7(2) |
| Statistical test | |||
| lower limit | 0.6(1) | 0.4(1) | 0.2(1) |
| upper limit | 1.2(1) | 0.8(1) | 0.7(1) |
| Adopted | 0.9(1) | 0.7(1) | 0.7(1) |
| Luminosity dependence | |||
| () |
| Method | J-band | H-band | Ks-band |
|---|---|---|---|
| Reddening test | |||
| All SFI2 | 0.3(1)+ | 0.1(1)+ | – |
| 0.2(1)+ | |||
| AGC | |||
| low inclinationaaLimit between low and high inclinations is . | 0.15(2)+ | 0.05(2)+ | – |
| 0.10(2)+ | – | – | |
| high inclinationaaLimit between low and high inclinations is . | 0.46(5)+ 0.08 | 0.15(5) + 0.025 | – |
| 0.31(5) + 0.05 | – | – | |
| Statistical test | |||
| lower limit | 0.2(1) | 0.1(1) | 0.2(1) |
| upper limit | 1.2(1) | 0.8(1) | 0.7(1) |
| Holmberg testbbAssumes 0.9, 0.7 and 0.7 in J, H and Ks respectively. | |||
| low inclinationaaLimit between low and high inclinations is . | 0.48(15) | 0.39(15) | 0.26(15) |
| high inclinationaaLimit between low and high inclinations is . | |||
| Adopted | |||
| low inclinationaaLimit between low and high inclinations is . | 0.48(15) | 0.39(15) | 0.26(15) |
| high inclinationaaLimit between low and high inclinations is . | [1.6(2) + 0.24] | [1.4(2)] | [1.1(2) + 0.13] |
| Luminosity dependence | |||
| () | |||
| 0.20 |
From the trends of NIR color with inclination in the SFI2 sample, we derive a firm lower limit to the total extinction in J and H-band of mag and mag respectively. The scatter in these trends is on the order of 0.1 mag, while the statistical error on determining the slope is 0.01 mag. Using the same argument, we derive a lower limit on the extinction in I-band of mag, which when compared with those derived by G94 and Tully et al. (1998), is consistent with very low extinction in Ks-band. Using the much larger AGC sample, we note that the simple linear relation given by Eqn 7 does not adequately describe the variation of the 2MASS colors with inclination, but an upturn at high inclinations takes place instead which we fit with a bi-linear law.
The radius is seen to be closer to the center of the disk in J, H and Ks (-3 scale lengths) than in I-band (at 3.5-4 scale lengths), and we work through a simple model to estimate at what inclination the disk might become opaque at that radius for a given central face-on opacity. Using samples defined according to different selection criteria, we explore the inclination dependence of and compare the data with the dependence that would be expected for pure exponential disks which are transparent at at all inclinations. We find that complete transparency at is inconsistent with the data of very nearly edge-on galaxies. Upper and lower limits are estimated for (as defined by Eqn 10), and we adopt as most probable values , and .
Tracking the flux dependence on inclination and using a modified version of the Holmberg test we investigate the amount of internal extinction in disks in the three bands. This analysis confirms that a simple value of (as defined by Eqn 7) is not adequate to describe extinction for all values of . Because of this we fit a bi-linear law fitting separately high and low inclination systems as separated by . The value of calculated from this test is sensitive to how the isophotal radii are corrected to the face-on value (i.e. the value of that is used in Eqn 10) and can change by a significant amount. Using the adopted values of we find , , and for . If is increased, decreases and vice-versa.
At the higher inclinations the modified Holmberg test is not appropriate as we expect a much smaller variation of with inclination than is corrected for. This implies that the measured slope is only a lower limit to the value of in Eqn 7. We expect that the limit will be closest to the actual value of in Ks where the extinction is lowest and therefore adopt . Using information on reddening we then derive and .
We explore a simple photometric model for extinction due to dust in spiral galaxies. In the model the dust is distributed exponentially both radially and in the -direction. The scale length of the dust is assumed to be the same as the stars, while a ratio is assumed between the scale heights. The “best fit” models to the data (all with ) suggest a central face-on opacity, and intrinsic axial ratio, for J-band, and for H-band and and for Ks-band. This model explains well the upturn in the extinction at high inclinations, which becomes more obvious for lower values of .
In Tables 4 and 5 we give estimates of our favored solutions for in Eqn 10 and in Eqn 7 as compromises of derivations from different methods. They are listed in the row labelled “Adopted”.
Finally, we explore the luminosity dependence of and . Under the assumption of transparency at the value of decreases with luminosity. We use the modified Holmberg test to explore the luminosity dependence of and find that the extinction drops off to zero below a luminosity of , -20.7 and -20.9 in J, H and Ks respectively. and is roughly constant at , 0.39 and 0.19 at the higher luminosities. There is marginal evidence of further increase at the very highest luminosities. The adopted luminosity dependences are also listed in Tables 4 and 5.
We have explored the commonly held view that there is little internal extinction in external galaxies at NIR wavelengths, especially Ks-band. We have shown that except for the least luminous galaxies, there is evidence for internal extinction (which increases with luminosity), and that in the most inclined galaxies the extinction becomes significant.
References
- Calzetti (2001) Calzetti, D., 2001, PASP, 113, 1449
- Curtri et al. (2000) Cutri, R. M., et al. 2000, Explanatory Supplement to the 2MASS Second Incremental Data Release (Pasadena: Caltech)
- Disney & Burstein (1995) Disney, J. I., Burstein, D. Eds. 1995, The Opacity of Spiral Disks (Dordrecht: Kluwer)
- Disney et al. (1989) Disney, M., Davis, J. & Phillips, S. 1989, MNRAS, 239, 939
- Evans (1992) Evans, Rh. 1992, Ph.D. thesis, University of Cardiff
- Giovanelli et al. (1994) Giovanelli, R., Haynes, M. P., Salzer, J. J., Wegner, G., da Costa, L.N., & Freudling, W. 1994, AJ, 107, 2036 (G94)
- Giovanelli et al. (1995) Giovanelli, R., Haynes, M. P., Salzer, J. J., Wegner, G., da Costa, L.N., & Freudling, W. 1995, AJ, 110, 1059
- Giovanelli et al. (1997) Giovanelli, R., Haynes, M., Herter, T., Wegner, G., Salzer, J. J., da Costa, L. N., & Freudling, W. 1997, AJ, 113, 22
- Graham (2001) Graham, A. W. 2001 MNRAS, 326, 543
- Haynes et al. (1999a) Haynes, M. P., Giovanelli, R., Salzer, J. J., Wegner, G., Freudling, W., da Costa, L. N., Herter, T., & Vogt, N. P. 1999a, AJ, 117, 1668
- Haynes et al. (1999b) Haynes, M. P., Giovanelli, R., Chamaraux, P., da Costa, L. N., Freudling, W., Salzer, J. J., Wegner, G. 1999b, AJ, 117, 2039
- Holmberg (1958) Holmberg, E. 1958, Medd. Lunds Astr Obs. Ser. 2, No. 136
- Holmberg (1975) Holmberg E. 1975, in Stars and Stellars Systems, Vol. IX, A. Sandage, M. Sandage, J. Kristian eds. (University of Chicago, Chicago).
- Huizinga (1994) Huizinga, J. E. 1994, Ph.D. thesis, University of Groningen
- Jarrett et al. (2003) Jarrett, T. H., Chester, T., Cutri, R., Schneider, S., & Huchra, J. P., 2003, AJ, 125, 525.
- Jarrett et al. (2000) Jarrett, T. H., Chester, T., Cutri, R., Schneider, S., Skrutskie, M., & Huchra, J.P. 2000, AJ, 119, 2498
- de Jong (1996) de Jong, R. S. 1996, A&AS, 118, 557
- Kochanek et al. (2001) Kochanek, C. S., Pahre, M. A., Falco, E. E., Huchra, J. P., Mader, J., Jarrett, T. H., Chester, T., Cutri, R., Schneider, S. E. 2001, ApJ, 560, 566
- Kron (1980) Kron, R. G. 1980, ApJS, 43, 305
- Kuchinski et al. (1998) Kuchinski, L. E., Terndrup, D. M., Gordon, K. D. & Witt, A. N. 1998, AJ, 115 1438
- Moriondo et al. (1998) Moriondo, G., Giovanelli, R., & Haynes, M. P. 1998, A&A, 338, 795
- Poggianti (1997) Poggianti, B. M. 1997, A&AS, 122, 399
- Schlegel et al. (1998) Schlegel, D. J., Finkbeiner, D. P., & Davis, M. 1998, AJ, 500, 525
- Tully et al. (1998) Tully, R. B., Pierce, M. J., Huang, J-S., Saunders, W., Verheijen, M. A. W., Witchalls, P. L. 1998, AJ, 115, 2264
- Tully & Fisher (1977) Tully, R. B. & Fisher, J. R. 1977, A&A, 54, 661
- Xilouris et al. (1999) Xilouris, E. M., Byun, Y. I., Kyafis, N. D., Paleologou, E. V., & Papamastorakis, J. 1999, A&A, 344, 868