EMISSION-LINE DIAGNOSTICS OF THE CENTRAL ENGINES OF WEAK-LINE RADIO GALAXIES
Abstract
A handful of well-studied Weak-Line Radio Galaxies (WLRGs) have been traditionally classified as Low Ionization Nuclear Emission-line Regions (LINERs), suggesting that these two groups of AGNs might be related. In this paper, we present new optical emission-line measurements for twenty Weak-Line Radio Galaxies which we supplement with measurements for an additional four from the literature. Classifying these objects by their emission-line ratios, we find that 50% of the objects are robustly classified as LINERs while an additional 25% are likely to be LINERs. Photoionization calculations show that the Spectral Energy Distribution of the well-studied WLRG 3C 270 (NGC 4261) is able to produce the observed emission-line ratios, but only if the UV emission seen by the narrow emission-line gas is significantly higher than that observed, implying AV = 2.5 – 4.2 magnitudes along our line of sight to the nucleus. From the photoionization calculations, we find that the emission-line gas must have an ionization parameter between 10-3.5 and 10-4.0 and a wide range in hydrogen density (102 – 106 cm-3) to reproduce the measured emission-line ratios, similar to the properties inferred for the emission-line gas in LINERs. Thus, we find that properties of the emission-line gas as well as the underlying excitation mechanism are indeed similar in LINERs and WLRGs. By extension, the central engines of accretion-powered LINERs and WLRGs, which do host an accreting black hole, may be qualitatively similar.
1 INTRODUCTION
Early optical studies of powerful, extragalactic radio sources revealed that the galaxies associated with them often showed strong emission lines in their optical spectra (Schmidt, 1965). To better understand the correlations between radio and optical line emission, Tadhunter et al. (1993) collected optical spectra of a complete sample of southern 2 Jy radio galaxies and quasars, derived from the Wall & Peacock (1985) 2.7-GHz sample. Analyzing these data, Tadhunter et al. (1998) recovered the previously known correlation between luminosity of the [O III] emission line (L) and the total radio luminosity (Lrad) (see, for example, Rawlings & Saunders, 1991).
However, Tadhunter et al. (1998) also found a large population of radio galaxies, dubbed Weak-Line Radio Galaxies (WLRGs), that had very weak [O III] emission (i.e. equivalent width of [O III] less than 10 Å), despite being powerful radio sources. In fact, all of the FR I (Fanaroff & Riley, 1974) sources in the sample were classified as WLRGs. This was not surprising, since Hine & Longair (1979) noticed that strong narrow optical emission-lines were almost always associated with FR II galaxies. Except for one object, Hydra A, Tadhunter et al. (1998) obtained only upper limits to L for the FR I radio galaxies. Thus, it was difficult to determine whether the FR I WLRGs followed the same L - Lrad correlation as the higher luminosity radio galaxies, or whether they truly had anomalously low [O III] luminosities. Hydra A did fall well below the correlation and the measured ratios of [O III]/[O II] and [O III]/H (both 1) indicated that the emission-line gas in this object might be in a low-ionization state.
Nearly half of the WLRGs, however, were FR II radio galaxies. These FR II sources may be related to the “low-excitation” FR II radio galaxies noticed by both Laing et al. (1994) and Hine & Longair (1979), in which high-ionization lines, such as [O III], were very weak compared to the hydrogen lines. When Tadhunter et al. (1998) restricted their sample to the redshift range 0.1 –0.7, in which all the objects had measured luminosities of [O III], [O II], and H, the WLRGs clearly stood out; L was an order of magnitude lower than that of other radio galaxies with a similar Lrad. On the other hand, L and LHβ in these WLRGs were not as drastically reduced, lending further support to the idea that these FR II sources are “low-excitation” sources, as was suggested by earlier studies.
Independently of the above study, in a large X-ray survey of radio-loud Active Galactic Nuclei (AGNs), Sambruna, Eracleous, & Mushotzsky (1999) found a similar correlation between the 2–10 keV X-ray luminosity (L2-10keV) and the 5 GHz radio lobe power (L5GHz). Again, the WLRGs in the sample stood out. Compared to objects with similar L5GHz, the WLRGs had L2-10keV as much as two orders of magnitude lower than expected from the correlation. Furthermore, the X-ray spectra of WLRGs were harder than those of other objects, suggesting that WLRGs might be a distinct group of AGN.
The relative weakness of the high-ionization [O III] emission line in WLRGs suggests that these objects might be related to Low Ionization Nuclear Emission Regions (LINERs; Heckman 1980, hereafter H80). H80 defined this class of objects with two line intensity ratios: [O II]/[O III] 1 and [O I]/[O III] (the H80 criterion). Indeed, several objects traditionally classified as LINERs (e.g. 3C 270, NGC 6251, and Hydra A) were classified by Tadhunter et al. (1998) as WLRGs.
The optical emission-line properties of LINERs can be reproduced by a variety of mechanisms, including photoionization by both stellar and non-stellar continua, as well as excitation by shocks. For a review of the properties of LINERs and the plausible excitation mechanisms, we direct the reader to Filippenko (1996) and Barth et al. (2002). Although LINERs as a class are heterogeneous, their continuity with Seyfert galaxies in optical luminosity and relative line strengths suggests that many LINERs may be genuine AGNs powered by accretion onto a supermassive black hole.
The fact that photoionization by a dilute, hard, power law continuum reproduces the low-ionization spectra seen in LINERs (e.g., Ferland & Netzer, 1983; Halpern & Steiner, 1983) lends support to this theory. Furthermore, Ho et al. (1997b) found that 20 of the LINERs in their ground based survey exhibited broad H emission lines, similar to, but significantly less luminous, than those found in Seyfert 1 galaxies. Given the difficulty of detecting the broad H emission in these galaxies, Ho et al. (1997b) noted that many more LINERs could have broad H emission lines. Those LINERs which emit broad H lines show other AGN-like features, such as steep spectrum radio and hard X-ray cores (Ho, 2001)
In the X-ray and UV bands, WLRGs bear many striking resemblances to those LINERs which are AGNs. An ASCA survey of LINERs and other Low Luminosity AGNs by Terashima et al. (2002) showed that the X-ray luminosities of LINERs were 2 – 3 orders of magnitude smaller than those of classical Seyfert galaxies. The authors did not find that the X-ray spectra of LINERs were harder than those of more luminous radio-quiet galaxies, however. In the UV, the spectral energy distributions (SEDs) of accretion-powered LINERs show a significant deficit relative to Seyfert galaxies (Ho, 1999). Although, it is difficult to measure the SED for WLRGs in the optical-UV regime, a similar decrement is seen in the WLRG 3C 270 (a.k.a. NGC 4261; Zirbel & Baum, 1998; Ho, 1999).
Thus there is mounting evidence that both the emission-line properties and the underlying X-ray and UV ionizing continuum, are similar in WLRGs and accretion-powered LINERs. Should a connection between accretion-powered LINERs and WLRGs be confirmed, this would have important implications for the central engines of these objects. While the central engine in Seyferts is thought to be fed by a thin accretion disk, Ho (1999) suggests that LINERs may be fed by Advection Dominated Accretion Flows (ADAFs; Narayan & Yi 1994, 1995) or a similar structure. Since the UV photons generally created in the inner regions of a thin accretion disk are not efficiently emitted in an ADAF, this scenario explains the lack of a UV bump and the low X-ray luminosity seen in LINERs. An ADAF could arise if the mass accretion rate is substantially below the Eddington accretion rate. If accretion-powered LINERs and WLRGs are both fueled by ADAFs, any successful ADAF model must be able to explain the properties of both systems, thereby placing additional constraints upon theoretical models of the accretion flow. In particular, the central engine must be able to produce kpc-sized jets in some objects but not others, which is a significant constraint on theoretical models.
Motivated by the above issues we have undertaken a more detailed spectroscopic study of WLRGs. The results of Tadhunter et al. (1998) merely suggest that the emission-line properties of WLRGs are similar to those of LINERs. Whether or not this is the case has not been established because the emission-line ratios required for a robust classification have not been measured. In §2 we describe the observations and data reductions. Then in §3 we present optical spectra of 20 of the 26 WLRG from the Tadhunter et al. (1998) sample and measure the necessary line ratios to test whether or not WLRGs satisfy the H80 LINER criterion. We supplement our observations with data for four additional WLRGs from the literature and include data for three WLRGs in our sample for which the literature provides emission line ratios not measurable from our spectra or which improve upon our measured limits. We also classify WLRGs in the alternative emission-line galaxy schemes of Baldwin, Phillips, & Terlevich (1981) and Veilleux & Osterbrock (1987). In §4, we perform photoionization calculations to determine whether the observed emission-line ratios can be produced by the SED of 3C 270, which we take to be representative of the SEDs of WLRGs. We use these calculations to place constraints on the ionization parameter and hydrogen density of the emission-line gas. In §5 we discuss the viability of an accretion-powered central engine as the photoionizing source and consider alternative excitation sources which may be present. Finally, in §6, we summarize our results and suggest avenues for further work. Throughout this paper we assume a Hubble constant of and a deceleration parameter of .
2 OBSERVATIONS AND BASIC DATA REDUCTIONS
The new data set used here consists of spectra of 20 WLRGs, as listed in Table 1. The observations were carried out at Kitt Peak National Observatory (KPNO), MDM Observatory, Lick Observatory, and Cerro Tololo Interamerican Observatory (CTIO) over a period of three years, with dates as given in Table 1. Spectra were typically taken through – slits oriented at the parallactic angle whenever necessary. The typical seeing was –. The data were reduced in a standard fashion. In summary, preliminary reductions included subtraction of the bias level and division by the flat field. One-dimensional spectra were extracted from a – window centered on the nucleus of each galaxy. Wavelength calibration was carried out using arc spectra obtained immediately after the object exposure. Flux calibration was carried out with the help of standard stars observed on the same night and reduced in the same manner as the object. The spectrum of the standard star was also used to derive a correction template for discrete atmospheric absorption bands. The final spectral resolution was 6–7 for spectra taken with the CTIO 1.5m and Lick 3m telescopes and 3.5–4.5 for spectra taken with the KPNO 2.1m and MDM 2.4m telescopes.
The observational details for the supplementary observations are contained in Table 2 and the references therein.
3 EMISSION-LINE MEASUREMENTS AND CLASSIFICATION
3.1 Emission-Line Measurements
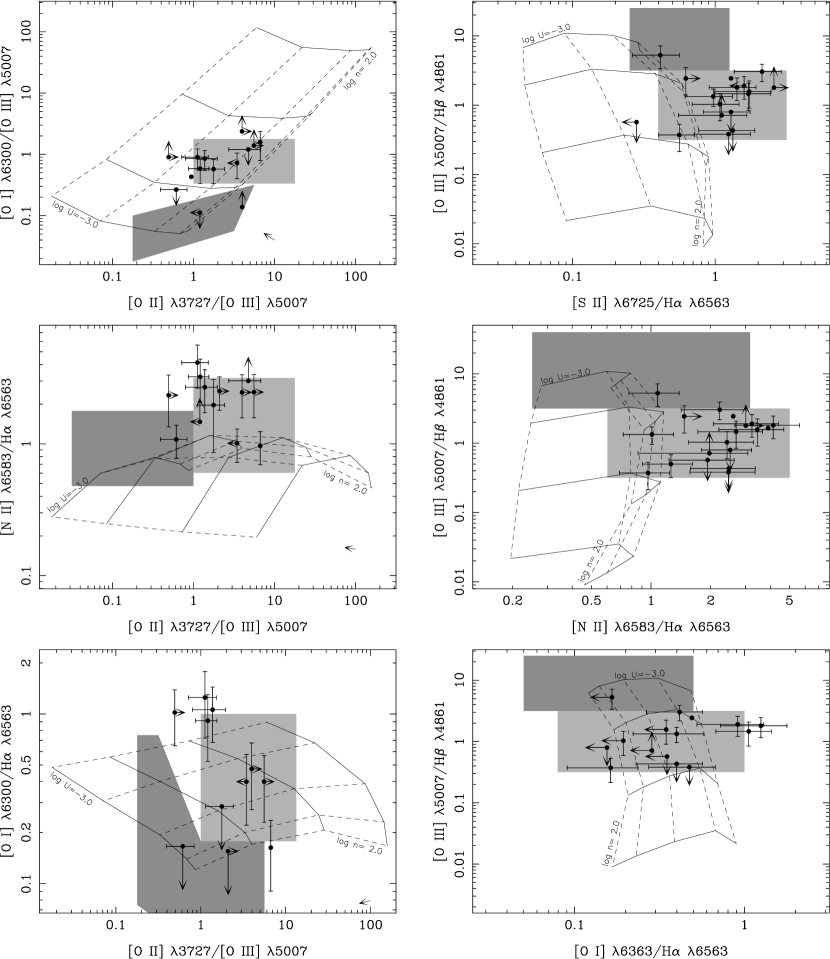
Although the [O II]/[O III] and [O I]/[O III] line ratios are a good diagnostic for discriminating between different types of emission line galaxies and define LINERs as a class, they are not ideal from an observational point of view. They are greatly affected by internal reddening, which is generally unknown, and it can be quite inconvenient to obtain measurements of these widely spaced line pairs. To overcome these difficulties, Veilleux & Osterbrock (1987) and Baldwin, Phillips, & Terlevich (1981) developed additional 2-dimensional diagnostic diagrams which are also useful for classifying emission-line galaxies, based upon the following pairs of emission line ratios: [O I]/H vs. [O II]/[O III]; [O III]/H vs. [S II] 6716,6731/H; [N II]/H vs. [O II]/[O III]; [O III]/H vs. [N II]/H; [O III]/H vs. [O I] /H. These diagnostic diagrams are now widely used in addition to the H80 criterion to differentiate between LINERs and other narrow emission-line galaxies, such as Seyfert 2s and H II regions (e.g.; Shields & Filippenko, 1990; Filippenko & Terlevich, 1992).
The spectrum of each object contained the combined starlight of the host galaxy in addition to the low-ionization emission-lines we would like to study. To accurately determine the line strengths, a template galaxy spectrum was used to subtract the starlight contribution. As a first step to subtracting the template galaxy spectrum, the redshift of each WLRG was determined using strong narrow emission lines or prominent stellar absorption lines. In general, the spectra possessed strong emission lines at both their blue and red ends, allowing for an accurate redshift determination. When no clear blue emission lines were present, resolved Ca II K and H) absorption lines from the host galaxy were used to increase the number of measurements. In a few instances the spectrum contained no strong emission or absorption lines and the redshift was obtained from Tadhunter et al. (1998). Table 3 contains a list of redshifts with errors (column 2) as well as the number of lines used to obtain this redshift (column 3).
We modeled the continuum with a starlight template and a featureless power law component when necessary. Occasionally, an additional low-order polynomial was required to adequately model the continuum. The spectra of giant ellipticals, which host all known WLRGs, are extremely uniform. Therefore, our template library consisted of only four objects (NGC 1399, 3379, 4339, 4365, 5332) with Hubble types ranging from S0 to E3. After correcting each WLRG spectrum for galactic reddening (listed in column 4 of Table 3) and shifting the spectrum to the rest frame, the continuum was determined with a minimization routine using four fitting regions in which the observed flux was dominated by emission from the galaxy. The best-fit continuum was then subtracted and the residuals visually inspected to ensure that the subtraction routine did not leave artificial features in the residuals. In Fig. 1, we show the result of the starlight subtraction for 3C 353 (1717-00), a typical galaxy from our sample in terms of S/N and resolution.
Isolated emission lines were fitted with Gaussians with the wavelength and FWHM of the line as free parameters. The closely-spaced [S II] doublet was fitted using a de-blending algorithm, in which the FWHM of the lines were independent. The [N II] and H lines were severely blended. Therefore, we used a combination of Gaussians to fit [N II] in a 1:3 ratio with the FWHM of the two lines forced to be the same. The fit to the [N II] lines was determined primarily by the stronger line which was sufficiently well separated from H line that its peak was clearly seen. The residual H line was then fitted with a simple Gaussian. In all cases, the best fit was determined using a minimization routine. No evidence of broad H is seen, although it would be difficult to detect, as discussed by Ho et al. (1997b), particularly in low S/N data. In those cases in which no clear line was visible, we determined a “1” upper limit on the line flux by fitting the local noise with a Gaussian with the peak fixed to the expected wavelength. The FWHM was restricted to the range of the measured FWHM of similar lines in the spectrum (i.e. forbidden or Balmer lines). Since the absolute flux calibration was not necessarily the same for two separate spectra of the same object, line ratios were only calculated when both lines were measured from the same spectrum. The emission-line ratios are reported in Table 4.
3.2 Assessment of Uncertainties
There were several sources of error that contributed to an overall error of 20–30 for each line-strength measurement. Using, 1717–00 as our typical WLRG we performed several sets of measurements and found that the majority of the error is incurred in the measurement of the flux, although the starlight subtraction contributes as well, as discussed below. The fluxes of clean, strong lines were assigned a 20% while low S/N or distorted lines were given a 30% error.
We performed an extensive literature search in order to compare our emission line ratios with those obtained by other authors. In total we were found 23 line ratios with at least one measurement from the literature. Assuming a 20% error on the literature values, there were discrepancies in only six instances. In 1717-00, five of the line ratios had comparison values and only one was discrepant. As described in §3.3, our classification system is fairly rigorous and a classification error is only likely to occur if several ratios from the same object are incorrect. Given the results of the literature search, this is unlikely to occur.
Although most of the error arose from the flux measurement, the galaxy subtraction introduced some systematic errors, particularly in the [O III]–H and [N II]–H regions in which broad H or H absorption is expected. In particular, a mismatch between the stellar populations in a WLRG and the template galaxy would lead to an improper subtraction of the underlying Balmer absorption and the fluxes of the H and H emission lines would be either under- or overestimated in that object. In a few instances, the [N II]/[N II] ratio was not 1/3, as expected from atomic physics, indicating that the H absorption line may have in fact been improperly subtracted. There are four objects in which the H/H ratio, listed in column 8 of Table 4, was considerably lower than expected from case B recombination: 0034–01, 1246–41, 2058–28, and 2104–17. This suggests that the H flux was underestimated or the H flux overestimated. The [O III]/H ratios for 0034–01 and 2058–28 obtained from the literature are considerably higher than we measured (see Table 4 and its footnotes), indicating that our measured H flux may indeed be too large by almost a factor of two. Therefore, we treat the measured H fluxes of these objects and the ratios in which they appear with caution.
Another source of uncertainty, independent of the above measurements, was the internal reddening, which we have ignored. Reddening vectors, assuming one magnitude of visual extinction, are included in all of the diagnostics diagrams involving the widely spaced oxygen ratios (Fig. 2). One diagnostic of the reddening is the H/H ratio, listed in col. 8 of Table 4. H/H is expected to be 3.1 for AGN models (Halpern & Steiner, 1983) or 2.86 for H II regions and planetary nebulae (Brocklehurst, 1971). Of the 14 objects with measurements or limits of H/H only 0131-36 and 0625-53 appear to be significantly reddened. An enlarged H/H ratio could also result if the WLRG has a younger stellar population, and hence deeper Balmer absorption lines, than the template galaxy. Although the fluxes of both H and H would be underestimated, the effect would be proportionately more severe in the weaker H line. This could be the case for 0131-36; H and H are seen in absorption (Tadhunter et al., 1993) indicating the presence of hot stars and the soft X-ray spectrum is consistent with the presence of a starburst (Sambruna, Eracleous, & Mushotzsky, 1999), perhaps located in the prominent dust lane (Westerlund & Smith, 1966).
A final concern was that the emission line ratios were sensitive to the physical size of the extraction region (cols 6 and 7 of Table 3). We chose as small an extraction region as possible, so that the emission arose primarily from the true “Narrow Line Region” (NLR; i.e. that which is excited by the nucleus). However, the extraction aperture in the higher-redshift objects encompassed a region that extends well past the true NLR and could include additional emission-line sources. Additionally, in some of the nearby objects, the extraction region was less than 500 pc in size and perhaps some of the NLR was excluded. To test this, we extracted spectra from 0320–37 and 0131–36 using , , and extraction lengths, corresponding to physical dimensions of 0.27, 0.41, and 0.68 kpc for the former object and 1.53, 2.29, and 3.83 kpc for the later. In both objects, the emission line fluxes increased as the size of the extraction length increased, although more significantly for 0320–37, but the ratios remained the same within errors. Although each object must be treated individually, these tests confirm that the emission line ratios were not extremely sensitive to the size of the extraction region. In particular, it is unlikely that the NLR is resolved or that additional emission sources between 1.5 and 4 kpc produce significant contamination. In §5, we discuss the possibility that contaminating sources are contained even within the smallest extraction box.
Long-slit spectroscopy and narrowband imaging also suggest that there is little contamination. Baum, Heckman, & van Breugel (1992) performed a long-slit spectroscopic survey of emission-line nebulae in radio galaxies, including the WLRGs 0055–01, 0305+03, 0325+02, and 0915–11. Although the authors found variations in the emission-line ratios within individual objects, both with distance from the nucleus and position angle, the variations from source to source were much larger. Narrowband [N II]+ H images of the same WLRGs, plus 0123–01, 0255+05, 1251–12, and 1717–00, showed that more than 90% of the flux was contained within 2.68 kpc of the nucleus in most objects (adjusted using our assumed H0, Baum & Heckman, 1989). Even in 0915–11, which is known to have a circumnuclear ring of star formation (McNamara, 1995; Melnick, Gopal-Krishna, & Terlevich, 1997), 80% of the light was contained within 2.68 kpc. Hutchings et al. (1998) found no emission outside of a box in a spatially resolved spectrum of 0305+03 obtained with the Hubble Space Telescope. Therefore, for the purposes of classification and comparison with photoionization models, we assume that the line ratios that we measured were those of the NLR. We will return to this issue in our discussion of the results in §5.
3.3 Classification
In Fig. 2 we show the resulting 2-dimensional diagnostic diagram used originally by H80 to classify LINERs, in addition to the diagnostics developed by Baldwin, Phillips, & Terlevich (1981) and Veilleux & Osterbrock (1987). We include medium and light shaded polygons that indicate the regions occupied by a large concentration of Seyfert 2s and LINERs, respectively, based upon the data given in Baldwin, Phillips, & Terlevich (1981) and Veilleux & Osterbrock (1987). The area occupied by H II regions has been omitted for clarity, as few WLRGs fall in this portion of the diagram. There is some overlap between the various emission-line galaxy classifications and we have selected these regions only to indicate where the majority of objects from these two classes are located. Extreme outliers do exist which would be mis-classified by these diagrams; these regions only indicate where the typical Seyfert 2 galaxies and LINERs are located.
We use all six diagnostic diagrams to place each object into one of the following categories: LINER (L); Possible LINER (PL); Non-LINER (NL) Conflicting (C); and No Classification (NC). The classification for each object is given in the last column of Table 4. To obtain this classification, we first divided the objects into three groups for each diagram: LINER; Possible LINER; and Non-LINER. An object was a LINER if the measured line ratios placed it in the LINER region or the limits allowed the object to occupy the LINER region but ruled-out both a Seyfert 2 and H II region classification. Occasionally, an object was clearly not a Seyfert 2 or H II region, but lay outside the LINER region. If outlying LINERs were observed by Veilleux & Osterbrock (1987) or Baldwin, Phillips, & Terlevich (1981) in this region of the diagram, the object was also considered a LINER. When an object straddled two zones or the limits allowed the object to be classified as a LINER and a Seyfert 2 or H II region, the object was labeled as a possible LINER. Finally, an object which fell clearly into either the Seyfert 2 or H II areas of the diagram or whose limits clearly excluded the LINER region was placed in the Non-LINER group.
To arrive at the final classification, this grouping procedure was performed for all six diagrams. An object was classified as a LINER only when it qualified as a LINER in all the diagrams for which the measurements existed. Likewise, an object was a Non-LINER only if it was classified as such in all the diagrams in which it appeared. Objects with a mixture of LINER and Possible LINER groupings, were given the status of Possible LINER, while those objects which were sometimes Non-Liners and other times LINERs or Possible LINERs were classified as Conflicting objects.
Only in 14 of the 20 objects were we able to apply the original H80 classification scheme because the [O II] line was not observed or both emission lines in one of the pairs were upper limits. Of these, 8 are classified as LINERs, 4 are Possible LINERs, and 2 are Non-LINERs. However, when the alternative classification schemes developed by Veilleux & Osterbrock (1987) and Baldwin, Phillips, & Terlevich (1981) are used, every object except 0123-01 and 1648+05 are classified in at least one diagram. With the exception of 0055–01, 1251–12, 1637–37, and 2211–17, the remaining objects are classified in at least 3 diagrams, allowing for a fairly robust classification. In total, there are 12 LINERs (50%), 6 Possible LINERs (25%), 1 Non-Liner (4%), 3 Conflicting classifications (13%) and 2 Not Classified (8%). The breakdown between the 13 FR I and 9 FR II galaxies which have been classified is as follows: FR I – 8 LINERs (61.5%), 3 Possible LINERs (23.1 %), and 2 Conflicting (15.4 %); FR II - 4 LINERs (44.5%), 3 Possible LINERs (33.3%), 1 Non-LINER (11.1%), and 1 Conflicting (11.1 %).
With improved S/N data, several Possible LINERs may be established as LINERs, since many of the objects were relegated to the Possible LINER category because only a limit was obtained for one of the line ratios.
4 PHOTOIONIZATION CALCULATIONS
In the previous section, we demonstrated that the vast majority of WLRGs are classified as LINERs or Possible LINERs. Thus the suggestion that WLRGs are related to LINERs is quite reasonable. There is no doubt that WLRGs contain AGNs, as evidenced by the kpc-sized radio jets and the central engine of the AGN is certain to play some role in photoionizing the line-emitting region. However, it remains to be determined whether the SED of a WLRG (such as 3C 270, Fig. 3) alone can excite the observed emission lines, as is postulated for LINERs, or whether additional sources, such as shocks or stellar photoionization, are required. Furthermore, if WLRGs and LINERs are related objects and both are photoionized by their central engines, one might expect the properties of the line emitting gas, such as the ionization parameter and gas density, to be similar to those inferred for LINERs.
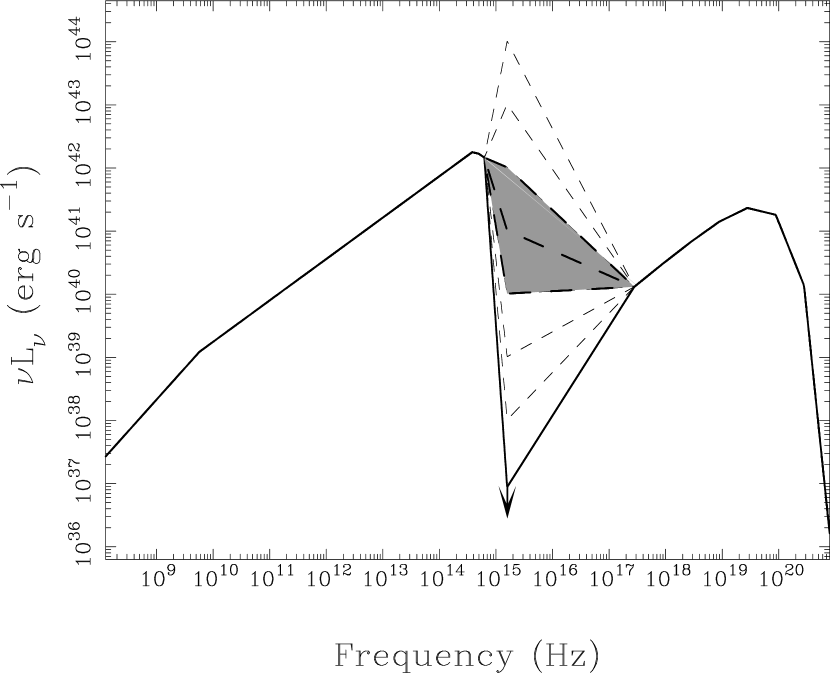
To address these questions, we performed photoionization calculations using Cloudy 94.0 (Ferland, 1996). We used the measured SED of 3C 270, using the data points of Tadhunter et al. (1998) (radio), Ferrarese, Ford, & Jaffe (1996) (optical), Zirbel & Baum (1998) (UV), and Chiaberge et al. (2002) (X-ray). We used a power law interpolation between these data points and extended the X-ray portion of the SED using the 2–10 keV power law with a high energy exponential cutoff at 200 keV. In Fig. 3, we plot the adopted SED of 3C 270.
The SED of 3C 270 shows an enormous deficit in the UV flux, while the SEDs of LINERs generally exhibit a more moderate deficit (Ho, 1999). Jaffe et al. (1993) found a disk of gas and dust surrounding the nucleus of the galaxy, which was clearly seen in the H image obtained with the Hubble Space Telescope (Martel et al., 1999). This disk may obscure the central engine, particularly in the UV. It is thus possible that the severe deficit of UV emission seen in 3C 270 is primarily the result of obscuration by the dust disk and that the UV flux seen by the line-emitting gas may be substantially higher than what is observed. To explore this, we allowed the UV data point to vary, as shown by the dashed lines in Fig. 3. We constructed eight SEDs which, beginning with the measured SED, have optical-to-xray spectral indices of = 0.0, 0.3, 0.7, 1.0, 1.3, 1.7, 2.0, and 2.3, where
Using each of the possible UV fluxes shown in Fig. 3, we computed a photoionization grid in the hydrogen density ( = 102, 103, 104, 105, 106 cm-3) and ionization parameter ( = 10-3.0, 10-3.5, 10-4.0, 10-4.5). The line emitting gas was assumed to have a solar abundance pattern and metallicity and we ignored the effects of dust grains, although they could survive. The line-emitting gas had a plane-parallel geometry and the hydrogen density was held constant throughout. The gas was radiation-bounded and the calculation ended when the temperature of the gas reached 4000 K. When the dielectronic recombination rates were unknown, which is the case for most elements in the 3rd and 4th rows of the periodic table, the mean of the rates for C, O, and N were used for the four lowest stages of ionization.
We find that the observed SED ( = 0.0) of 3C 270 cannot reproduce either the data points for WLRGs or the LINER region in the diagnostic diagrams; the UV flux seen by the emission-line gas must actually be within the grey-shaded region indicated in Fig. 3 ( = 1.0 – 1.6), making the inferred SED of 3C 270 more similar to those of LINERs (Ho, 1999). We have overplotted the data grids obtained using the SED with , which produced the best agreement between the model grids and both the data and the conventional LINER region in all six diagnostic diagrams. The model points calculated by Cloudy (assuming ) at each and , for all six line ratios are listed in Table 5. With the exception of the [N II]/H and [S II]/H ratios, the modified SED of 3C 270 is quite successful at reproducing the observed emission-line ratios of the WLRGs in our sample.
From these photoionization grids, we see that a wide range in hydrogen density is required to reproduce all of the data points and to cover the LINER region, similar to what is seen in LINERs (e.g., Ho, Filippenko & Sargent, 1993). The ionization parameter, , is typically between 10-3.5 and 10-4.0, again, similar to that inferred for LINERs (e.g., Ho, Filippenko & Sargent, 1993). It appears that not only are WLRGs often classified as LINERs, but that the emission-line properties of WLRGs are consistent with photo-ionization by an SED which is quite similar to that seen in LINERs.
5 DISCUSSION
Although it seems fairly plausible that the underlying excitation mechanisms in LINERs and WLRGs are related, there are still several outstanding questions which must be addressed. First, we must demonstrate that the modified SED of 3C 270 produces enough ionizing radiation to generate the luminosities of the observed emission-lines. Second, if the emission-line gas in WLRGs is in fact photoionized by the modified SED of 3C 270, a significant amount of extinction in the UV along our line of sight to the nucleus is implied; is this reasonable? Third, we must consider the large discrepancy between the observed and predicted [N II]/H and [S II]/H ratios. Heating by cosmic rays may be responsible for the enhancement of [N II]/H and [S II]/H, but it might also be caused by off-nuclear emission sources within the extraction region. Finally, simply because the SED of 3C 270 can reproduce most of the emission line ratios does not imply that this is the actual mechanism; alternative excitation mechanisms must be explored.
One way to determine whether the modified SED of 3C 270 is capable of powering the emission lines is to calculate the photon budget for H. Ho et al. (1997b) report that the reddening-corrected H flux is . These authors assumed that the intrinsic values of the H/H ratio is 3.1, thus the H luminosity is and the emission rate of H photons, is s-1. For Case B recombination, (Osterbrock, 1989), where is the ionizing photon rate and is the covering factor. Using the best-fit (modified) SED described in §4, we obtain . We see that even if the covering factor is as small as 0.012, the AGN is capable of producing the observed emission line luminosities.
If we wish to rely upon photoionization by the central AGN to produce the observed emission-line ratios, then the UV flux seen by the emission-line gas must be substantially larger than is measured, requiring 8 – 13 magnitudes of extinction (for = 1.0 – 1.6) at 2200Å. Using the galactic extinction curve of Seaton (1979) and AV/E(B-V) = 3.2, we find that AV = 2.5 – 4.2 magnitudes, assuming that the true UV flux is at the upper limit. Although 3C 270 has an unresolved nucleus in the optical and near-infrared HST images, the nucleus is not detected in the UV by either Zirbel & Baum (1998) or more recently by Allen et al. (2002). Instead, the UV HST images of 3C 270 are dominated by a dark disk, about 300 pc in size (Jaffe et al., 1993; Allen et al., 2002). Chiaberge et al. (2002) postulate that this dusty disk may be responsible for the absorption of the nuclear UV flux. These authors estimate that this disk could produce 1.2–2.5 magnitudes of visual extinction. This estimate was made by assuming that 1/2 (for A) or 1/3 (for A) of the starlight is produced behind the disk and then comparing the brightness of the galaxy inside and outside the projection of the disk. If there is emission from the disk itself, AV could be larger. The ratio of H/H measured by Ho, Filippenko, & Sargent (1995) also implies a low AV of only 1.4 magnitudes. While the dusty disk is sufficient to produce the observed extinction to the optical emission lines, it is just barely sufficient to produce the minimum extinction necessary in the UV. It is possible that dust is mixed with the narrow emission-line gas in which case the extinction to the emission-line gas is less than to the UV source. Alternatively, the covering factor of the dust could be larger to the UV source than the emission-line gas. It is also possible that in addition to the dusty disk, there is a different source of extinction to the UV source.
From the Chandra and XMM-Newton observations of 3C 270, column densities of and are inferred (Chiaberge et al., 2002; Sambruna et al., 2003). Assuming a galactic gas-to-dust ratio, this implies 30 magnitudes of visual extinction to the X-ray source. Observations of Seyfert galaxies suggest that it is not unusual for the the visual extinction estimated from the X-ray data to be 2 – 10 times larger than estimated from optical and infra-red data (Maiolino et al., 2001; Granato et al., 1997). Therefore, it is possible that the same medium is responsible for the extinction of the X-ray and UV nuclear sources as well as the optical emission-line region.
On the other hand, as Sambruna et al. (2003) argue for 3C 270 (and Weingartner & Murray 2002 argue more generally referring to all AGNs) the X-ray and optical/UV absorbers are likely to be distinct. The optical/UV absorber is likely to be a dusty medium at a moderately large distance from the AGN, while the X-ray absorber is likely to lie closer to the AGN central engine and consist of neutral or ionized gas, which is relatively free of dust and could have the form of an outflowing wind. Either scenario should fulfill the following requirements: the optical/UV extinction towards the nucleus/central engine of 3C 270 should be higher than the extinction towards the line-emitting region but considerably lower than what one would infer from the X-ray extinction assuming a Galactic dust-to-gas ratio.
As seen in Fig. 2, even the modified SED of 3C 270 cannot reproduce the large observed [N II]/H and [S II]/H ratios in WLRGs. One could suppose the H is underestimated, but then one would expect the [O I]/H to also be higher than expected in every object with large [N II]/H and [S II]/H ratios, which is not the case. However, several authors have encountered a similar problem in modeling LINERs with photoionization models (e.g., Ho, Filippenko & Sargent, 1993; Baum, Heckman, & van Breugel, 1992). By artificially enhancing the nitrogen abundance to 4 times solar, our photoionization grids reproduce the [N II]/H ratio fairly well. Even when the sulfur abundance is increased to 10 times solar, though, the large [S II]/H ratio cannot be obtained.
As discussed by Ferland & Mushotzky (1984), cosmic ray heating can significantly alter the ionization structure of the emission-line nebula leading to enhancement of the low ionization lines. A low rate of cosmic-ray heating leads to an increase in the [O I]/H, [N II]/H and [S II]/H ratios. Those objects with unusually large [O I]/H ratios do tend to also have large [N II]/H and [S II]/H ratios, however we have few measurements of [O I]/H in our sample. At higher heating rates, however, the partially ionized zone is destroyed, reducing the [O I]/H ratio while increasing the [N II]/H and [S II]/H ratios by a factor of 2. Those objects with unusually small [O I]/H do not have larger than average [N II]/H and [S II]/H, but these values are larger than predicted by our photoionization calculation. Thus, cosmic ray heating may be responsible for the enhancement in the [N II]/H and [S II]/H ratios for some objects. However, there are many objects with large [N II]/H and [S II]/H ratios while having normal [O I]/H, which cannot be explained with cosmic ray heating.
Another alternative would be to invoke additional off-nuclear sources of [N II] and [S II] emission within the extraction region. This is unlikely for several reasons. First, one would expect that those objects with larger extraction regions would be more likely to include these additional emission sources; this is not seen. Second, as mentioned in §3.2, the available narrowband [N II]+H images show that the emission-line gas is confined within 2.68 kpc (Baum & Heckman, 1989), even for those objects with large [N II]+H. Furthermore, an inspection of HST images (Baum et al., 1988) shows that there are no clumps of emission within this 2.68 kpc region. Finally, HST R-band (Martel et al., 1999) and UV images (Zirbel & Baum, 1998) of several WLRGs also show very little structure.
Although it is unlikely that there are off-nuclear sources of [N II] and [S II] emission, alternative nuclear excitation mechanisms must be explored. Dopita & Sutherland (1995) find that shocks can reproduce the range of emission-line ratios seen in Seyfert and LINERs and are a good alternative to photoionization by an AGN. Shocks certainly can be expected to be present in the nuclear regions of radio galaxies, due to the interaction of the jets with ISM. LINERs are well modeled with fast shocks (150 – 500 km s-1) in a gas poor environment while Seyferts require a richer environment, slightly faster shocks (300 – 500 km s-1) as well as precursor UV photons.
Dopita et al. (1997) performed a detailed analysis of the optical and UV emission lines in M87, a nearby, well-known LINER, hosted by a radio galaxy. They conclude that the presence of strong UV emission lines can only be explained by shock models. Furthermore, their detailed modeling suggests that the outer accretion disk itself is a plausible source of these shocks. However, the best-fitting shock model of Dopita et al. (1997) cannot reproduce the [N II]/H and [S II]/H ratios without enhancing the N and S abundances to 3 and 2 times solar, respectively. Even then, the [S II]/H ratio is still underpredicted by 20%, which is substantially larger than the error reported on their measurement. When we enhance our N and S abundances to those adopted by Dopita et al. (1997), we can reproduce the observed [N II]/H ratios as well as Dopita et al. (1997), but we still underpredict the [S II]/H ratio by 35%. Thus, the shock model presented by Dopita et al. (1997) would be slightly better at reproducing the large [S II]/H ratios observed in WLRGs. However in the absence of UV data, this model is not clearly preferred over photoionization.
Stellar photoionization by very hot, luminous Wolf-Rayet stars stars has been postulated by Terlevich & Melnick (1985), while photoionization by O stars has been studied by Filippenko & Terlevich (1992) and Shields (1992). Like shocks, these models can account for the observed emission-line ratios of WLRGs and LINERs, but also fail to produce the large observed [N II]/H and [S II]/H ratios without enhancing the N and S abundances.
Thus, photoionization by an AGN, as represented by the SED of 3C 270, can reproduce the emission-line ratios presented here. Alternative excitation mechanisms cannot be ruled out, but are not favored, either. Since an AGN must be present to explain the radio jets of WLRGs, economy of means suggests that the AGN should also be responsible for powering the observed emission lines. With the current data, we are unable to determine conclusively which excitation mechanism is responsible for the line-emission: photoionization by the central engine; shocks between the jets and the ISM; or shocks within a large accretion disk itself.
6 CONCLUSIONS AND FUTURE PROSPECTS
In this paper, we have presented emission line ratios for 24 Weak-Line Radio Galaxies (WLRG) and classified them according to the H80 criterion, as well as the diagnostic diagrams developed by Veilleux & Osterbrock (1987) and Baldwin, Phillips, & Terlevich (1981). We find that most of the WLRGs in our sample are classified as either LINERs (50%) or Possible LINERs (25%). One object, 0131–36, was found to be a Non-LINER and 3 objects had conflicting classifications and may be hybrid objects. Only two objects were not classified. With improved S/N measurements, it is likely that many Possible LINERs may be promoted to LINERs status.
The measured emission-line ratios of WLRGs are reproduced fairly well by photoionization by the SED of the WLRG 3C 270 when the UV flux is increased substantially above the observed upper limit, yielding an SED which is quite similar to those seen in LINERs (Ho, 1999). Thus we conclude that our line of sight to the UV source must be obscured by 2.5–4.2 magnitudes of visual extinction. The photoionization calculations indicate that a wide range of hydrogen densities is required to cover the data points, but that the ionization parameter is typically between and , as seen in LINERs.
The [N II]/H and [S II]/H ratios are much larger than predicted by the photoionization grids, an effect noted by several authors in the study of LINERs. The enhancement of these ratios might be caused by cosmic ray heating, but is unlikely to be caused by off-nuclear sources of emission. The emission-line ratios we present here are also well re-produced by shock and stellar photoionization models. However, the [N II]/H and [S II]/H ratios are still under-predicted, so these models are not favored over AGN photoionization based upon the data presented here.
In conclusion, it is very likely that WLRGs and LINERs are intimately related, not only in their emission-line properties but also in their underlying excitation mechanisms. Higher S/N optical spectra of WLRGs would help solidify the relationship between LINERs and WLRGs. More importantly measurements of the weak [O III] line would help discriminate between photoionization and shock models, as this line is expected to be much stronger in shock models. The most progress can probably be made with narrowband and UV imaging and IR, UV and long-slit spectroscopy. Although WLRGs are classified as LINERs by their emission-line ratios, it is still uncertain whether photoionization by an AGN is the only possibility. Through narrowband and UV imaging with the HST, as well as long-slit spectroscopy, valuable insight into distribution of the narrow emission-line gas would be gained. The observations of Baum et al. (1988), Baum, Heckman, & van Breugel (1990) and Zirbel & Baum (1998) have been extremely valuable in studying several WLRGs in this sample, however each object is unique and must be considered individually. UV and IR spectroscopy will be extremely helpful in determining whether shocks or photoionization models are favored as there are several additional diagnostics in these bands (see Dopita et al. 1997; Filippenko 1996 and references therein).
References
- Allen et al. (2002) Allen, M. G. et al. 2002, ApJS, 139, 411
- Baldwin, Phillips, & Terlevich (1981) Baldwin, J. A., Phillips, M. M. & Terlevich, R. 1981, PASP, 93, 5
- Barth et al. (2002) Barth, A. J. 2002, in Issues in Unification of Active Galactic Nuclei, ASP Conf. Ser. 258, eds. R. Maiolino, A. Marconi, and N. Nagar, (San Francisco: Astronomical Society of the Pacific), 147
- Baum et al. (1988) Baum, S. A., Heckman, T. M., Bridle, A., van Breugel, W. J. M., & Miley, G. K. 1988, ApJS, 68, 643
- Baum & Heckman (1989) Baum, S. A. & Heckman, T. 1989, ApJ, 336, 681
- Baum, Heckman, & van Breugel (1990) Baum, S. A., Heckman, T., & van Breugel, W. 1990, ApJS, 74, 389
- Baum, Heckman, & van Breugel (1992) Baum, S. A., Heckman, T., & van Breugel, W. 1992, ApJ, 389, 208
- Brocklehurst (1971) Brocklehurst, M. 1971, MNRAS, 153, 471
- Chiaberge et al. (2002) Chiaberge, M., Gilli, R., Macchetto, F. D., Sparks, W. B., & Capetti, A. 2003, ApJ, 582, 645
- Dopita & Sutherland (1995) Dopita, M. A. & Sutherland, R. S. 1995, ApJ, 455, 468
- Dopita et al. (1997) Dopita, M. A., Koratkar, A. P., Allen, M. G., Tsvetanov, Z. I., Ford, H. C., Bicknell, G. V., & Sutherland, R. S. 1997, ApJ, 490, 202
- Fanaroff & Riley (1974) Fanaroff, B. L. & Riley, J. M. 1974, MNRAS, 167, 31P
- Ferland (1996) Ferland, G. J., 1996, Hazy, a Brief Introduction to Cloudy 94.00, University of Kentucky Internal Report
- Ferland & Netzer (1983) Ferland, G. J. & Netzer, H. 1983, ApJ, 264, 105
- Ferland & Mushotzky (1984) Ferland, G. J. & Mushotzky, R. F. 1984, ApJ, 286, 42
- Ferrarese, Ford, & Jaffe (1996) Ferrarese, L., Ford, H. C. & Jaffe, W. 1996, ApJ, 470, 444
- Filippenko & Terlevich (1992) Filippenko, A. V. & Terlevich, R. 1992, ApJ, 397, L79
- Filippenko (1996) Filippenko, A. V. 1996, in The Physics of Liners in View of Recent Observations, ASP Conf. Ser. 103, eds. M. Eracleous et al., (San Francisco: Astronomical Society of the Pacific), 17
- Granato et al. (1997) Granato, G. L., Danese, L., & Franceschini, A. 1997, ApJ, 486, 147
- Halpern & Steiner (1983) Halpern, J. P. & Steiner, J. E. 1983, ApJ, 269, L37
- Heckman (1980) Heckman, T. M. 1980, A&A, 87, 152
- Hine & Longair (1979) Hine, R. G. & Longair & M. S. 1979, MNRAS, 188, 111
- Ho, Filippenko & Sargent (1993) Ho, L. C., Filippenko, A. V. & Sargent, W. L. W. 1993, ApJ, 417, 63
- Ho, Filippenko, & Sargent (1995) Ho, L. C., Filippenko, A. V., & Sargent, W. L. 1995, ApJS, 98, 477
- Ho et al. (1997b) Ho, L. C., Filippenko, A. V., & Sargent, W. L. W., & Peng, C. Y. 1997b, ApJS, 112, 391
- Ho (1999) Ho, L. C. 1999, ApJ, 516, 672
- Ho (2001) Ho, L. C. 2001, in AGN Surveys, IAU Colloquium 184, eds. R. F. Green, E. Ye. Khachikian, and D. B. Sanders, (San Francisco: Astronomical Society of the Pacific), 1
- Hutchings et al. (1998) Hutchings, J. B., Baum, S. A., Weistrop, D., Nelson, C., Kaiser, M. E., & Gelderman, R. F. 1998, AJ, 116, 634
- Jaffe et al. (1993) Jaffe, W., Ford, H. C., Ferrarese, L., van den Bosch, F., & O’Connell, R. W. 1993, Nature, 364, 213 Jaffe
- Laing et al. (1994) Laing, R. A., Jenkins, C. R., Wall, J. V. & Unger, S. W. 1994, in The Physics of Active Galaxies, ASP Conf. Ser. 54, eds G. V. Bicknell, M.A. Dopita, and P.J. Quinn, (San Francisco: Astronomical Society of the Pacific), 201
- Martel et al. (1999) Martel, A. et al. 1999, ApJS, 122, 81
- Maiolino et al. (2001) Maiolino, R., Marconi, A., Salvati, M., Risaliti, G., Severgnini, P., Oliva, E., La Franca, F., & Vanzi, L. 2001, A&A, 365, 28
- McNamara (1995) McNamara, B. R. 1995, ApJ, 443, 77
- Melnick, Gopal-Krishna, & Terlevich (1997) Melnick, J., Gopal-Krishna, & Terlevich, R. 1997, A&A, 318, 337
- Osterbrock (1989) Osterbrock, D. E. 1989, Astrophysics of Gaseous Nebulae and Active Galactic Nuclei (Mill Valley: University Science Books), 326
- Phillips et al. (1986) Phillips, M. M., Jenkins, C. R., Dopita, M. A., Sadler, E. M., & Binette, L. 1986, AJ, 91, 1062
- Rawlings & Saunders (1991) Rawlings, S. & Saunders, R. 1991, Nature, 349, 138
- Sambruna, Eracleous, & Mushotzsky (1999) Sambruna, R. M., Eracleous, M. & Mushotzky, R. F. 1999, ApJ, 526, 60
- Sambruna et al. (2000) Sambruna, R. M., Chartas, G., Eracleous, M., Mushotzky, R. F. & Nousek, J. A. 2000, ApJ, 532, L91
- Sambruna et al. (2003) Sambruna, R. M., Gliozzi, M., Eracleous, M, Brandt, N., & Mushotzky, R. F. 2003, ApJ, 586, L37
- Schlegel, Finkbeiner & Davis (1998) Schlegel, D. J., Finkbeiner, D. P. & Davis, M. 1998, ApJ, 500, 525
- Schmidt (1965) Schmidt, M. 1965, ApJ, 141, 1
- Seaton (1979) Seaton, M. J. 1979, MNRAS, 187, 73P
- Shields & Filippenko (1990) Shields, J. C. & Filippenko, A. V. 1990, AJ, 100, 1034
- Shields (1992) Shields, J. C. 1992, ApJ, 399, L27
- Simpson et al. (1996) Simpson, C., Ward, M., Clements, D. L., & Rawlings, S. 1996, MNRAS, 281, 509
- Tadhunter et al. (1993) Tadhunter, C. N., Morganti, R., di Serego-Alighieri, S., Fosbury, R. A. E. & Danziger, I. J. 1993, MNRAS, 263, 999
- Tadhunter et al. (1998) Tadhunter, C. N., Morganti, R., Robinson, A., Dickson, R., Villar-Martin, M. & Fosbury, R. A. E. 1998, MNRAS, 298, 1035
- Terashima et al. (2002) Terashima, Y., Iyomoto, N., Ho, L. C., & Ptak, A. F. 2002, ApJS, 139, 1
- Terlevich & Melnick (1985) Terlevich, R. & Melnick, J. 1985, MNRAS, 213, 841
- Veilleux & Osterbrock (1987) Veilleux, S. & Osterbrock, D. E. 1987, ApJS, 63, 295
- Wall & Peacock (1985) Wall, J. V. & Peacock, J. A. 1985, MNRAS, 216, 173
- Weingarter & Murray (2002) Weingarter, J. C. & Murray, N. 2002, ApJ, 580, 88
- Westerlund & Smith (1966) Westerlund, B. E. & Smith, L. F. 1966, Australian Journal of Physics, 19, 181
- Zirbel & Baum (1998) Zirbel, E. L. & Baum, S. A. 1998, ApJS, 114,177
| IAU | Other | Exposure | Slit | Spectral | Observation | |
|---|---|---|---|---|---|---|
| Name | Name(s) | Telescope | Time (s) | Width (′′) | Range (Å) | Date |
| 0034–01 | 3C 15 | KPNO 2.1m | 1800 | 1.8 | 3860 – 7506 | 1999 Dec 02 |
| 0043–42 | CTIO 1.5m | 3000 | 1.8 | 5531 – 9004 | 1999 Nov 03 | |
| 3000 | 3677 – 7131 | 1999 Nov 04 | ||||
| 0123–01 | 3C 40 | MDM 2.4m | 1200 | 1.5 | 6245 – 8319 | 1998 Dec 20 |
| 2100 | 4217 – 6289 | 1998 Dec 22 | ||||
| 0131–36 | NGC 612 | CTIO 1.5m | 1800 | 1.8 | 3640 – 7043 | 2001 Jan 23 |
| 0305+03 | 3C 78, NGC 1218 | Lick 3m | 900 | 1.5 | 4460 – 7234 | 1988 Sep 12 |
| 0320–37 | For A, NGC 1316 | CTIO 1.5m | 1800 | 1.8 | 3640 – 7043 | 2001 Jan 23 |
| 0325+02 | 3C 88 | MDM 2.4m | 1200 | 1.5 | 6245 – 8319 | 1998 Dec 20 |
| 1800 | 4217 – 6289 | 1998 Dec 22 | ||||
| 0427–53 | IC 2080 | CTIO 1.5m | 900 | 1.8 | 3677 – 7131 | 1999 Nov 04 |
| 0453–20 | NGC 1692, OF-289 | MDM 2.4m | 1200 | 1.5 | 6245 – 8319 | 1998 Dec 20 |
| 1800 | 4217 – 6289 | 1998 Dec 22 | ||||
| 0625–35 | OH-342 | CTIO 1.5m | 4800 | 1.8 | 3881 – 7287 | 2001 Jan 24 |
| 0625–53 | CTIO 1.5m | 2400 | 1.8 | 3640 – 7043 | 2001 Jan 23 | |
| 0915–11 | Hyd A, 3C 218 | KPNO 2.1m | 1800 | 1.8 | 3860 – 7506 | 1999 Dec 03 |
| 1246–41 | NGC 4696 | CTIO 1.5m | 1800 | 1.8 | 3640 – 7043 | 2001 Jan 23 |
| 1251–12 | 3C 278 | MDM 2.4m | 900 | 1.5 | 6245 – 8319 | 1998 Dec 20 |
| 900 | 4217 – 6289 | 1998 Dec 22 | ||||
| 1318–43 | NGC 5090 | CTIO 1.5m | 1800 | 1.8 | 3640 – 7043 | 2001 Jan 23 |
| 1333–33 | IC 4296 | CTIO 1.5m | 1800 | 1.8 | 3640 – 7043 | 2001 Jan 23 |
| 1717–00 | 3C 353 | KPNO 2.1m | 3600 | 1.8 | 3897 – 7553 | 2000 Jun 04 |
| 2058–28 | NGC 6998, OW-297.1 | CTIO 1.5m | 1800 | 1.8 | 5795 – 7593 | 1999 Nov 02 |
| 1800 | 3677 – 7131 | 1999 Nov 05 | ||||
| 2104–28 | NGC 7018, OX-208 | CTIO 1.5m | 1800 | 1.8 | 5795 – 7593 | 1999 Nov 02 |
| 1800 | 3677 – 7131 | 1999 Nov 05 | ||||
| 2211–17 | 3C 444 | KPNO 2.1m | 3000 | 1.8 | 3860 – 7506 | 1999 Dec 03 |
| IAU | Other | Exposure | Slit | Observation | ||
|---|---|---|---|---|---|---|
| Name | Name(s) | Telescope | Time (s) | Width (′′) | Date | Ref. aaReferences – (1) Baum, Heckman, & van Breugel (1990); (2) Tadhunter et al. (1993); (3) Ho, Filippenko, & Sargent (1995); (4) Simpson et al. (1996). |
| 0055–01 | 3C 29 | KPNO 4m | 1800 | 2.0 | 1986 Nov | 1 |
| ESO 2.2m | 1800 | 3.0 | 1990 Jul | 2 | ||
| 0915–11 | ESO 2.2m | 2400 | 2.0 | 1989 Mar | 2 | |
| 1216+06 | 3C 270, NGC 4261 | Hale 5m | 1200 | 2.0 | 1986 Feb | 3 |
| 1637–77 | AAT 3.9m | 900 | 2.0 | 1992 Apr | 4 | |
| ESO 2.2m | 1200 | 2.5 | 1989 Mar | 2 | ||
| 1648+05 | Her A | ESO 3.6m | 1800 | 2.0 | 1989 Mar | 2 |
| 1717–00 | 3C 353 | AAT 3.9m | 1900 | 2.0 | 1992 Apr | 4 |
| 2211–17 | ESO 3.6m | 1200 | 3.0 | 1990 Jul | 2 |
| IAU | Num. of | Extraction | Extraction | ||||
|---|---|---|---|---|---|---|---|
| Name | aa The figure in parenthesis is the uncertainty on the last digit. Values obtained from the literature do not have an uncertainty listed. | Lines | E(B-V) bb The classification for each object, based upon the diagnostic diagrams as discussed in §3 – L = LINER, PL = Possible LINER, NL = Non-LINER, C = Conflicting, NC = Not Classified | FR Type ccfootnotemark: | Width (kpc) dd References. – (1) Baum et al. (1990); (2) Tadhunter et al. (1993); (3) Ho, Filippenko, & Sargent (1995); (4) Simpson et al. (1996). | Length (kpc) dd References. – (1) Baum et al. (1990); (2) Tadhunter et al. (1993); (3) Ho, Filippenko, & Sargent (1995); (4) Simpson et al. (1996). | Ref. ee Our measurement is in conflict with reports in the literature, as discussed in §3.2 of the text. The values found in the literature are as follows: 0305+03: [O I]/H = 0.50 (Baum et al. 1990); 0320–37: [N II]/H = 2.13 (Phillips et al., 1986); 0915–11: [O III]/H = 0.75 (Tadhunter et al., 1993); 1313–33: [N II]/H = 1.0 (Phillips et al., 1986); 1717–00: [O I]/[O III] = 1.55 (Simpson et al., 1996); 2058–28: [O III]/H = 1.03 (Tadhunter et al., 1993). |
| 0034–01 | 0.0733(6) | 2 | 0.022 | II | 2.37 | 2.00 | |
| 0043–42 | 0.1169(2) | 5 | 0.011 | II | 3.48 | 5.03 | |
| 0055–01 | 0.045 ff Taken from the literature since our own spectra yielded only an upper or lower limit. | I | 1.72 | 0.72 | 1 | ||
| 2.58 | ? | 2 | |||||
| 0123–01 | 0.019 | 1 | 0.041 | II | 0.54 | 1.05 | |
| 0131–36 | 0.0296(2) | 5 | 0.020 | II | 1.06 | 1.53 | |
| 0305+03 | 0.029 | 1 | 0.173 | I | 0.85 | 0.42 | |
| 0320–37 | 0.0057(2) | 3 | 0.021 | I | 0.19 | 0.27 | |
| 0325+02 | 0.03051(8) | 6 | 0.126 | II | 0.88 | 1.93 | |
| 0427–53 | 0.0397(3) | 3 | 0.009 | I | 1.32 | 1.91 | |
| 0453–20 | 0.035 | 4 | 0.041 | I | 1.02 | 1.98 | |
| 0625–35 | 0.055 | 1 | 0.067 | I | 1.85 | 2.67 | |
| 0625–53 | 0.054 ff Taken from the literature since our own spectra yielded only an upper or lower limit. | 0.062 | II | 1.82 | 2.63 | ||
| 0915–11 | 0.05377(9) | 4 | 0.042 | I | 1.82 | 1.54 | |
| 2.01 | ? | 2 | |||||
| 1216+06 | 0.006 ff Taken from the literature since our own spectra yielded only an upper or lower limit. | I | 0.25 | 0.49 | 3 | ||
| 1246–41 | 0.0099(4) | 5 | 0.113 | I | 0.33 | 0.48 | |
| 1251–12 | 0.01574(1) | 2 | 0.053 | I | 0.45 | 1.22 | |
| 1318–43 | 0.0112(2) | 4 | 0.144 | I | 0.40 | 0.58 | |
| 1333–33 | 0.0126(4) | 4 | 0.059 | I | 0.47 | 0.68 | |
| 1637–77 | 0.041 ff Taken from the literature since our own spectra yielded only an upper or lower limit. | II | 1.57 | ? | 4 | ||
| 1.96 | ? | 2 | |||||
| 1648+05 | 0.154 ff Taken from the literature since our own spectra yielded only an upper or lower limit. | I/II | 4.83 | ? | 2 | ||
| 1717–00 | 0.03040(7) | 3 | 0.439 | II | 1.09 | 0.92 | |
| 1.19 | ? | 4 | |||||
| 2058–28 | 0.0390(3) | 2 | 0.113 | I | 1.32 | 1.91 | |
| 2104–28 | 0.038 | 0.064 | II | 1.29 | 1.86 | ||
| 2211–17 | 0.153 ff Taken from the literature since our own spectra yielded only an upper or lower limit. | 0.115 | II | 4.30 | 3.63 | ||
| 7.22 | ? | 2 |
| [O II] | [O I] | [N II] | [O III] | [O I] | [S II] | H | |||
|---|---|---|---|---|---|---|---|---|---|
| IAU Name | [O III] | [O III] | H | H | H | H | H | Class.bb The classification for each object, based upon the diagnostic diagrams as discussed in §3 – L = LINER, PL = Possible LINER, NL = Non-LINER, C = Conflicting, NC = Not Classified | Refs.ccfootnotemark: |
| 0034–01 | 1.2 | 0.11 | 2 | 2(1) | 0.6 | 2.3 | C | ||
| 0043-42 | 1.2(3) | 0.6(2) | 3(1) | 1.9(7) | 0.9(4) | 1.7 | L | ||
| 0055–01 | 3.9 d dfootnotemark: | 1.65 d dfootnotemark: | L | 1,2 | |||||
| 0123–01 | 6 | 3 | NC | ||||||
| 0131–36 | 0.6(2) | 0.27 | 1.1(3) | 5(2) | 0.16 | 0.4(2) | 8(3) | NL | |
| 0305+03 | 0.6 | 3(1) | 1.6(7) | 0.3 e efootnotemark: | 1.7(8) | 2(1) | PL | ||
| 0320–37 | 5(2) | 1.2 | 3 e efootnotemark: | 2 | 3 | PL | |||
| 0325+02 | 2.2(8) | 3.0(9) | 0.4(2) | 2.1(8) | L | ||||
| 0427–53 | 1.8(7) | 0.6(2) | 2(1) | 0.7 | 0.28 | 1.1(6) | 2 | PL | |
| 0453–20 | 2.4(9) | 1.0(4) | 0.14(6) | 1.1(4) | L | ||||
| 0625–35 | 1.1(4) | 0.9(3) | 4(1) | 1.8(6) | 1.3(5) | 1.4(5) | 0.7 | L | |
| 0625–53 | 0.5 | 0.9 | 2(1) | 1.0(4) | 7(3) | PL | |||
| 0915–11 | 6.67 f ffootnotemark: | 1.6(8) | 1.0(3) | 0.3(2) e efootnotemark: | 0.20(7) | 0.6(2) | 4(1) | L | 2 |
| 1216+06 | 2.60 d dfootnotemark: | 2.44 d dfootnotemark: | 0.49 d dfootnotemark: | 1.29 d dfootnotemark: | 4.9 d dfootnotemark: | L | 3 | ||
| 1246–41 | 6 | 1 | 2.5(9) | 0.4 | 0.4(2) | 1.3(6) | 1.9(7) | L | |
| 1251–12 | 1.3(4) | 0.5(2) | L | ||||||
| 1318–43 | 2 | 2.5(7) | 0.8 | 0.15 | 1.3(5) | 3(1) | C | ||
| 1333–33 | 4 | 2 | 2.5(9) e efootnotemark: | 0.4 | 0.5(2) | 1.2(5) | 2(1) | L | |
| 1637–77 | 0.94 d dfootnotemark: | 0.43 d dfootnotemark: | 9.61 d dfootnotemark: | L | 2,4 | ||||
| 1648+05 | 4.55 d dfootnotemark: | 0.62 | NC | 2 | |||||
| 1717–00 | 3.45 d dfootnotemark: | 0.7(3) e efootnotemark: | 1.0(3) | 1.3(4) | 0.4(2) | 1.0(4) | 4(1) | PL | 4 |
| 2058–28 | 1.9(7) | 0.6 e efootnotemark: | 0.4 | 0.28 | 1.3(6) | C | |||
| 2104–25 | 1.4(6) | 0.9(3) | 3(1) | 1.5(6) | 1.1(4) | 1.7(7) | 1.2(5) | L | |
| 2211–17 | 4.0 f ffootnotemark: | 0.3 | 0.57 f ffootnotemark: | PL | 2 |
| 2 | 3 | 4 | 5 | 6 | 2 | 3 | 4 | 5 | 6 | ||
|---|---|---|---|---|---|---|---|---|---|---|---|
| [O II]/[O III] | [O I]/[O III] | ||||||||||
| –3.0 | 0.864 | 0.684 | 0.332 | 0.071 | 0.018 | 0.057 | 0.051 | 0.055 | 0.081 | 0.207 | |
| –3.5 | 4.023 | 3.311 | 1.598 | 0.331 | 0.084 | 0.320 | 0.288 | 0.279 | 0.347 | 0.822 | |
| –4.0 | 28.49 | 24.44 | 12.60 | 2.729 | 0.727 | 4.603 | 4.160 | 3.877 | 4.250 | 9.599 | |
| –4.5 | 157.1 | 144.1 | 86.44 | 21.97 | 6.003 | 55.45 | 50.85 | 49.43 | 55.51 | 117.3 | |
| [N II]/H | [O III]/H | ||||||||||
| –3.0 | 0.628 | 0.703 | 0.789 | 0.597 | 0.279 | 6.210 | 8.033 | 10.21 | 10.87 | 6.755 | |
| –3.5 | 0.924 | 1.046 | 1.157 | 0.773 | 0.247 | 1.565 | 2.034 | 2.822 | 3.322 | 1.948 | |
| –4.0 | 0.794 | 0.942 | 1.115 | 0.791 | 0.215 | 0.133 | 0.180 | 0.275 | 0.370 | 0.207 | |
| –4.5 | 0.462 | 0.602 | 0.815 | 0.687 | 0.196 | 0.009 | 0.014 | 0.023 | 0.035 | 0.022 | |
| [O I]/H | [S II]/H | ||||||||||
| –3.0 | 0.121 | 0.140 | 0.193 | 0.307 | 0.484 | 0.295 | 0.287 | 0.190 | 0.087 | 0.045 | |
| –3.5 | 0.170 | 0.200 | 0.269 | 0.400 | 0.556 | 0.595 | 0.587 | 0.381 | 0.136 | 0.046 | |
| –4.0 | 0.206 | 0.254 | 0.363 | 0.545 | 0.694 | 0.860 | 0.898 | 0.645 | 0.230 | 0.061 | |
| –4.5 | 0.167 | 0.231 | 0.388 | 0.676 | 0.893 | 0.826 | 0.963 | 0.843 | 0.353 | 0.090 | |