The Chandra Deep Field-North Survey. XIII. 2 Ms Point-Source Catalogs
Abstract
We present point-source catalogs for the 2 Ms exposure of the Chandra Deep Field-North, currently the deepest X-ray observation of the Universe in the 0.5–8.0 keV band. Five hundred and three (503) X-ray sources are detected over an 448 arcmin2 area in up to seven X-ray bands. Twenty (20) of these X-ray sources lie in the central 5.3 arcmin2 Hubble Deep Field-North ( sources deg-2). The on-axis sensitivity limits are erg cm-2 s-1 (0.5–2.0 keV) and erg cm-2 s-1 (2–8 keV). Source positions are determined using matched-filter and centroiding techniques; the median positional uncertainty is . The X-ray colors of the detected sources indicate a broad variety of source types, although absorbed AGNs (including a small number of possible Compton-thick sources) are clearly the dominant type. We also match lower significance X-ray sources to optical counterparts and provide a list of 79 optically bright ( 23) lower significance Chandra sources. The majority of these sources appear to be starburst and normal galaxies.
The average backgrounds in the 0.5–2.0 keV and 2–8 keV bands are 0.056 and 0.135 counts Ms-1 pixel-1, respectively. The background count distributions are very similar to Poisson distributions. We show that this 2 Ms exposure is approximately photon limited in all seven X-ray bands for regions close to the aim point, and we predict that exposures up to 25 Ms (0.5–2.0 keV) and 4 Ms (2–8 keV) should remain nearly photon limited. We demonstrate that this observation does not suffer from source confusion within 6 of the aim point, and future observations are unlikely to be source-confusion limited within 3 of the aim point even for source densities exceeding 100,000 deg-2. These analyses directly show that Chandra can achieve significantly higher sensitivities in an efficient nearly photon-limited manner and be largely free of source confusion.
To allow consistent comparisons, we have also produced point-source catalogs for the 1 Ms Chandra Deep Field-South (CDF-S). Three hundred and twenty-six (326) X-ray sources are included in the main Chandra catalog, and an additional 42 optically bright X-ray sources are included in a lower significance Chandra catalog. We find good agreement with the photometry of the previously published CDF-S catalogs; however, we provide significantly improved positional accuracy.
The Astronomical Journal, 2003 August, astro-ph/0304392
1 Introduction
One of the primary scientific goals behind the construction of the Chandra X-ray Observatory (hereafter Chandra; Weisskopf et al. 2000) was to perform the deepest possible X-ray studies of the Universe. Great advances in this direction were made with the completion of two 1 Ms surveys: the Chandra Deep Field-North (CDF-N; Brandt et al. 2001a, hereafter B01), and the Chandra Deep Field-South (CDF-S; Giacconi et al. 2002, hereafter G02). These ultra-deep Chandra surveys resolve the bulk of the 0.5–8.0 keV background, providing the deepest views of the Universe in this band (e.g., Campana et al. 2001; Cowie et al. 2002; Rosati et al. 2002; Moretti et al. 2003). A broad variety of source types is detected, including (in approximately decreasing source-density order) absorbed and unabsorbed Active Galactic Nuclei (AGN), starburst galaxies, normal galaxies, stars, galaxy groups, and galaxy clusters (see Brandt et al. 2002 and Hasinger et al. 2002 for reviews of the Chandra Deep Field results, and Barger et al. 2002 and Szokoly et al. 2003 for the Chandra Deep Field optical catalogs and spectroscopy).
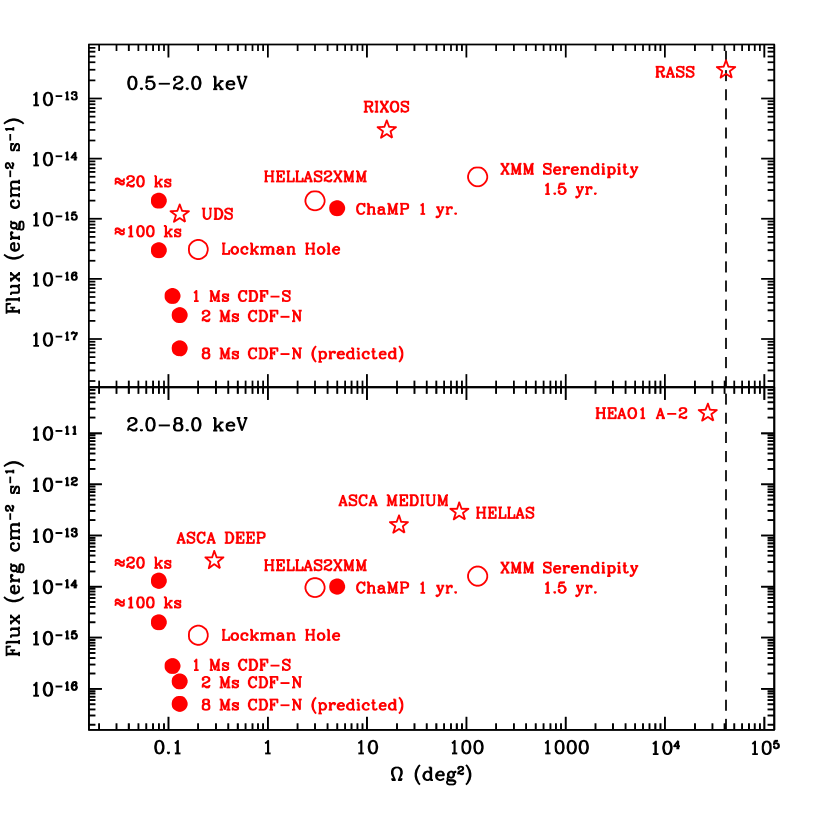
These 1 Ms Chandra surveys are 2 orders of magnitude more sensitive in the 0.5–2.0 keV and 2–8 keV bands than any X-ray survey performed before the launch of Chandra and XMM-Newton (Jansen et al. 2000). They are also at least three times more sensitive than any other current Chandra or XMM-Newton survey (see Figure 1). With a small on-axis point-spread function (PSF) and low background, an ultra-deep Chandra observation is unlikely to be background or source-confusion limited, and longer Chandra exposures should achieve significantly higher sensitivities in an efficient nearly photon limited manner. Since several analyses have suggested a steep rise in the number counts of X-ray sources around 0.5–2.0 keV fluxes of (3–7) erg cm-2 s-1 (e.g., Ptak et al. 2001; Hornschemeier et al. 2002; Miyaji & Griffiths 2002; Ranalli et al. 2003), longer Chandra exposures should also detect significantly more sources. Achieving such sensitivities is one of the main goals of future X-ray observatories (e.g., XEUS and Generation-X). However, X-ray stacking analysis results have directly shown that Chandra can reach these flux levels with exposures of several Ms (e.g., Brandt et al. 2001c; Hornschemeier et al. 2002).
The CDF-N was recently awarded a second 1 Ms of Chandra exposure, bringing the total exposure in this field to 2 Ms. In this paper we present two point-source catalogs derived from the full 2 Ms exposure: a main catalog that includes high-significance Chandra sources and a supplementary catalog that includes lower significance Chandra sources that are matched to optically bright ( 23) counterparts. We provide basic analyses of the detected sources; however, we defer detailed analyses to other papers. For instance, Barger et al. (2003a) and Hornschemeier et al. (2003) investigate the overall properties of the X-ray detected sources, Vignali et al. (2002a,b), Alexander et al. (2003), and Bauer et al. (2003) perform X-ray spectral analyses of various X-ray source populations, and Barger et al. (2003b) place constraints on the number of AGNs. We also include analyses of the background and X-ray sensitivity across the field, determine the fraction of the field that is close to photon limited, and calculate the source-confusion limit. We use this information to discuss the prospects for longer Chandra exposures. In order to allow consistent comparisons between the CDF-N and CDF-S observations, we have also produced point-source catalogs for the CDF-S (see the Appendix).
The CDF-N catalogs presented here supersede those presented in B01. The Galactic column density along this line of sight is (1.60.4) cm-2 (Stark et al. 1992). The coordinates throughout this paper are J2000. The Hubble Deep Field-North (HDF-N; Williams et al. 1996) lies close to the aim point of the CDF-N and is centered at 12h 36m 494, 12′58′′ (, ). km s-1 Mpc-1, , and are adopted.
2 Observations and Data Reduction
The observational procedure and data processing were similar to those described in B01. For completeness, we provide all of the details here.
2.1 Observations and Observing Conditions
The Advanced CCD Imaging Spectrometer (ACIS; Garmire et al. 2003) was used for all of the Chandra observations.111For additional information on the ACIS and Chandra see the Chandra Proposers’ Observatory Guide at http://cxc.harvard.edu/udocs/docs. ACIS consists of ten CCDs (each pixels) designed for efficient X-ray detection and spectroscopy. Four of the CCDs (ACIS-I; CCDs I0–I3) are arranged in a array with each CCD tipped slightly to approximate the curved focal surface of the Chandra High Resolution Mirror Assembly (HRMA). The remaining six CCDs (ACIS-S; CCDs S0–S5) are set in a linear array and are tipped to approximate the Rowland circle of the objective gratings that can be inserted behind the HRMA. The CCD which lies on-axis in ACIS-I is I3.
The full ACIS-I field of view is ( 285 arcmin2), and the ACIS pixel size is . The PSF is smallest at the softest energies and for sources at small off-axis angles. For instance, the 95% encircled-energy radius at 1.5 keV for off-axis angles of – is – (Feigelson, Broos, & Gaffney 2000; Jerius et al. 2000; M. Karovska and P. Zhao 2001, private communication).222Feigelson et al. (2000) is available at http://www.astro.psu.edu/xray/acis/memos/memoindex.html. The PSF is approximately circular at small off-axis angles, broadens and elongates at intermediate off-axis angles, and becomes complex at large off-axis angles. The four ACIS-I CCDs were operated in all of the 20 observations that comprise the 2 Ms exposure, while the ACIS-S CCD S2 was used for the first 12 observations. Due to its large off-axis angle, and consequently its low sensitivity, CCD S2 is not used in this analysis.
The second 1 Ms of Chandra exposure consisted of eight separate observations taken between 2001 Nov 16 and 2002 Feb 22. These eight new observations and the 12 observations that comprised the initial 1 Ms exposure are described in Table 1. The HDF-N was placed near the aim point of the ACIS-I array for the majority of the observations. The eight new observations were taken in Very Faint mode to improve the screening of background events and thus increase the sensitivity of ACIS in detecting faint X-ray sources.333For more information on the Very Faint mode see http://cxc.harvard.edu/udocs/vf.html and Vikhlinin (2001). The focal-plane temperature was C for all of the eight new observations.
The background light curves for all 20 observations were inspected using event browser in the Tools for ACIS Real-time Analysis (tara; Broos et al. 2000) software package.444tara is available at http://www.astro.psu.edu/xray/docs. All but two are free from strong flaring due to “space weather” and are stable to within %. The two observations with substantial flaring are 2344 and 3389. Due to high solar activity, the background was times higher than nominal for ks of observation 2344, and these data have been removed. The background rose dramatically toward the end of observation 3389, and the observation was cut short; ks of the data at the end of this observation have been removed. The total exposure time for the 20 observations is 1.945 Ms.
Due to the different pointings required to keep the HDF-N near the aim point and the roll constraints of Chandra, the total region covered by these 20 observations is 447.8 arcmin2, considerably larger than the ACIS-I field of view. Combining the 20 observations, the average aim point weighted by exposure time is 12h 36m , 13′58′′ (see Table 1). The aim points of the individual observations are separated from the average aim point by –; most are within of the average aim point. Due to the two main roll angles employed througout these observations, and our requirement to keep the HDF-N close to the aim point, none of these observations lies closer to the average aim point.
2.2 Data Reduction
The versions of the Chandra X-ray Center (hereafter CXC) pipeline software used for basic processing of the data are listed in Table 1. The reduction and analysis of the data used Chandra Interactive Analysis of Observations (ciao) Version 2.2.1 tools whenever possible;555See http://cxc.harvard.edu/ciao/ for details on ciao. however, the tara software package and custom software were also used extensively.
All data were corrected for the radiation damage sustained by the CCDs during the first few months of Chandra operations using the Charge Transfer Inefficiency (CTI) correction procedure of Townsley et al. (2000, 2002).666The software associated with the correction method of Townsley et al. (2000, 2002) is available at http://www.astro.psu.edu/users/townsley/cti/. In addition to correcting partially for the positionally dependent grade distribution due to CTI effects, this procedure also partially corrects for quantum efficiency losses (see Townsley et al. 2000, 2002 for further details).
All bad columns, bad pixels, and cosmic ray afterglows were removed using the “status” information in the event files, and we only used data taken during times within the CXC-generated good-time intervals. The ciao tool acis_process_events was used to remove the standard pixel randomization and to identify potential background events for the observations taken in Very Faint mode.
3 Production of the Point-source Catalogs
The production of the two point-source catalogs closely followed the procedure described in §3 of B01. The main differences in the catalog production procedure used here are the use of a matched-filter technique to improve the accuracy of the X-ray source positions, the addition of a further three standard source-detection bands, and the correlation of optically bright sources with lower significance Chandra sources; the latter modification is only relevant for the supplementary optically bright Chandra source catalog. For completeness, we provide all of the catalog production details here.
3.1 Image and Exposure Map Creation
Each observation was registered to observation 3293 using 7–19 X-ray sources (typically with 50 counts) detected within of the aim points in the individual observations; observation 3293 was chosen because it is one of the longest observations and the raw coordinates are closely matched to the radio astrometric frame (see §3.3). Image registration was performed using the align_evt tool written by T. Aldcroft777Further information about the align_evt tool can be obtained from http://cxc.harvard.edu/cal/ASPECT/align_evt/.; registration is accurate to within . The Chandra sources used in the registration were identified with the sliding-cell source detection program celldetect (Calderwood et al. 2001).
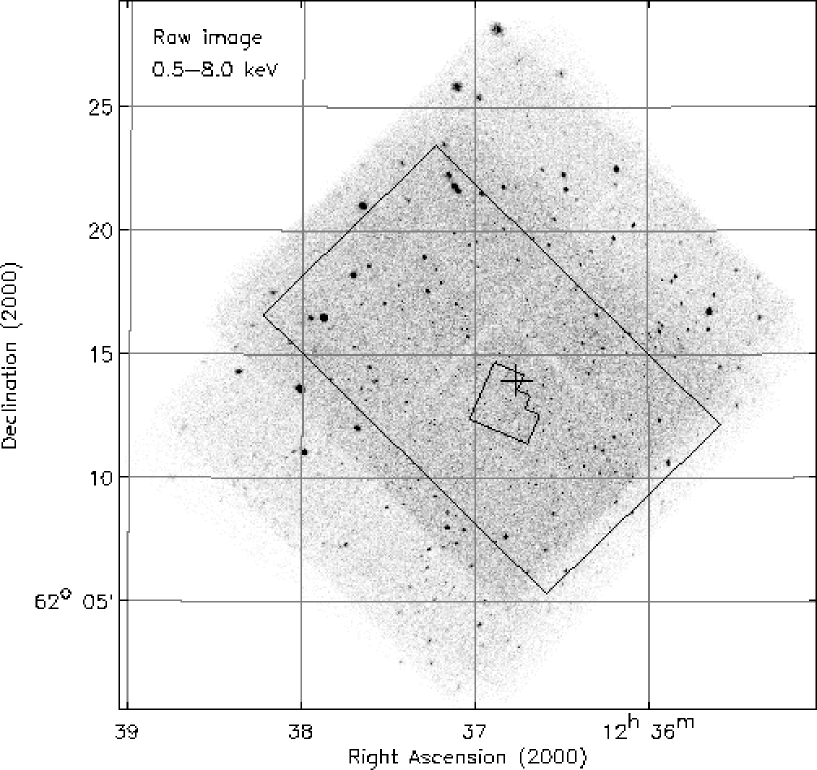
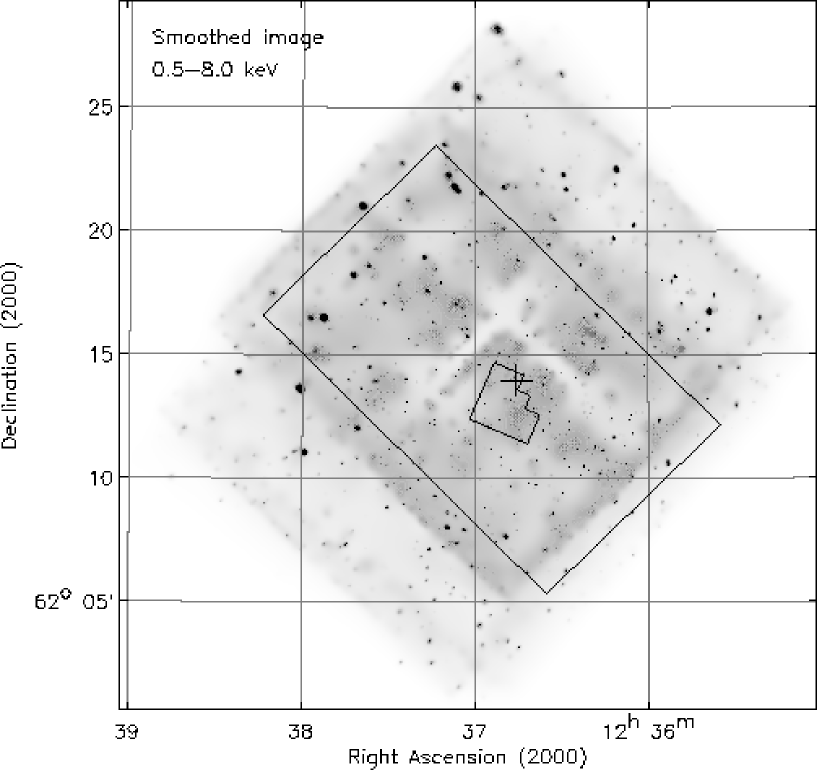
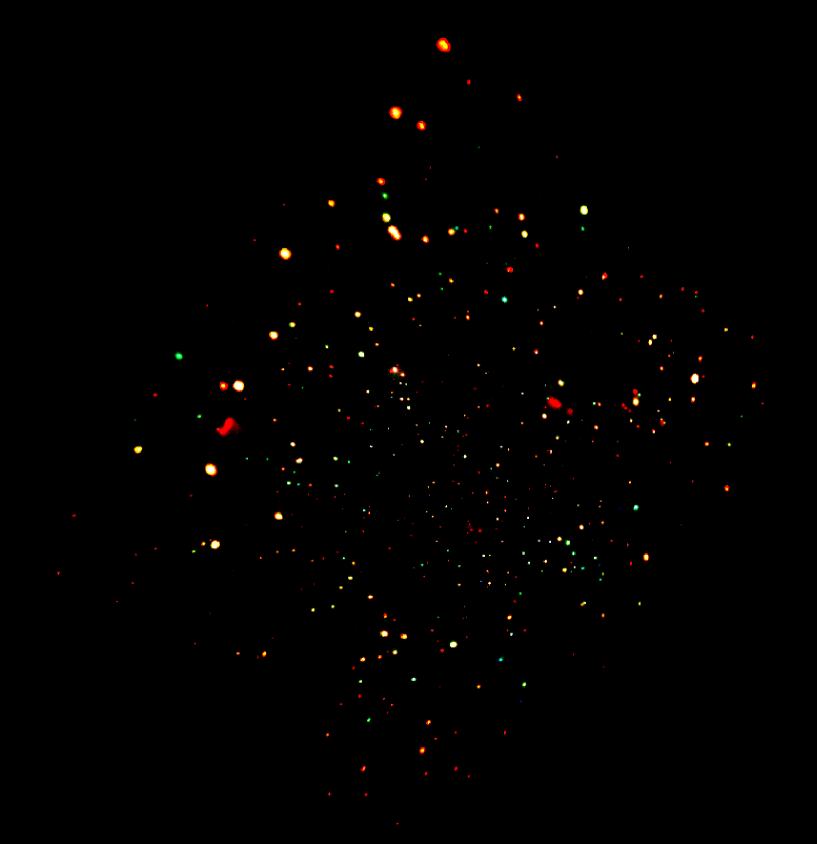
We constructed images using both the standard ASCA grade set and the “restricted ACIS grade set” for seven standard bands: 0.5–8.0 keV (full band; FB), 0.5–2.0 keV (soft band; SB), 2–8 keV (hard band; HB), 0.5–1 keV (SB1), 1–2 keV (SB2), 2–4 keV (HB1), and 4–8 keV (HB2); see Table 2. The restricted ACIS grade set improves our ability to detect faint sources in some cases; see §2.1 in Brandt et al. (2001b). In Figures 2 and 3, we show the full-band raw and adaptively smoothed ASCA-grade images.888Raw and adaptively smoothed ASCA-grade images for all of the seven standard bands (see Table 2) are available from http://www.astro.psu.edu/users/niel/hdf/hdf-chandra.html. The adaptively smoothed images were not used for source detection, but they do show many of the detected X-ray sources more clearly than the raw images. In Figure 4 we show a color composite of the adaptively smoothed 0.5–2.0 keV, 2–4 keV, and 4–8 keV images. Soft sources appear red, moderately hard sources appear green, and the hardest sources appear blue.
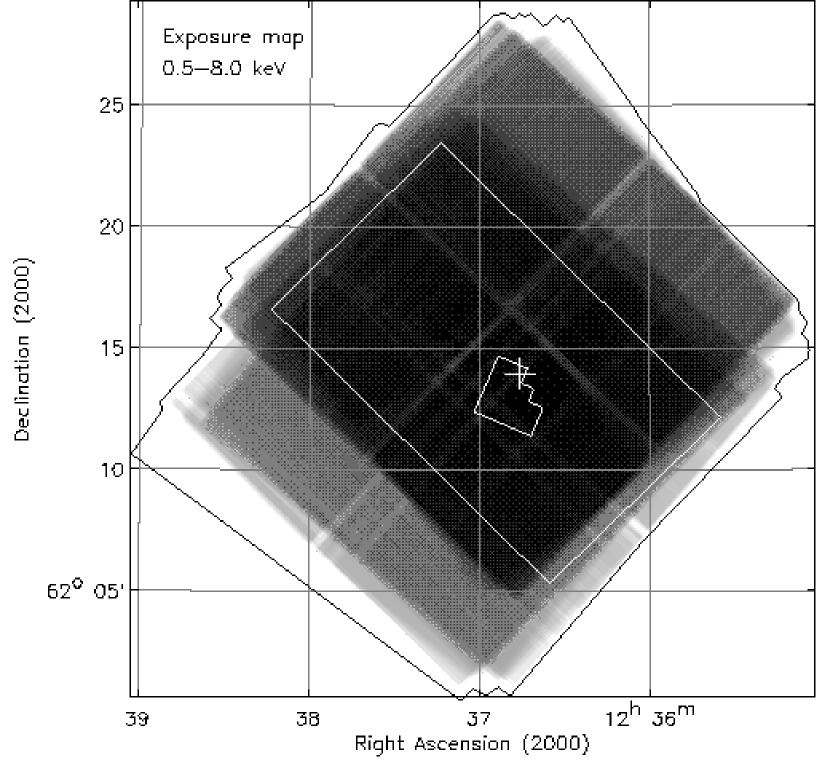
We constructed exposure maps in the seven standard bands. In Figure 5, we show the full-band exposure map.999Exposure maps for all of the seven standard bands (see Table 2) are available from the World Wide Web site listed in Footnote 8. These were created following the basic procedure outlined in §3.2 of Hornschemeier et al. (2001) and are normalized to the effective exposure of a source located at the aim point. Briefly, this procedure takes into account the effects of vignetting, gaps between the CCDs, bad column filtering, and bad pixel filtering. However, it does not take into account the 2–5% CCD “dead time” due to cosmic ray blooming since the magnitude of this effect is not well quantified. A photon index of , the slope of the X-ray background in the 0.5–8.0 keV band (e.g., Marshall et al. 1980; Gendreau et al. 1995; Kushino et al. 2002), was assumed in creating the exposure maps. These exposure maps need to be convolved with the background maps and off-axis angle dependent PSF to generate sensitivity maps; see §4.2.
In Figure 6, we show a cumulative plot of the survey solid angle as a function of full-band effective exposure. Approximately 51% ( 230 arcmin2) of the CDF-N field has Ms of effective exposure.
3.2 Point-source Detection
We extended the number of standard source-detection bands over that presented in B01 to seven. These detection bands were chosen to allow X-ray color analysis and the selection of sources in narrow X-ray bands; the latter can be useful for detecting weak sources that produce X-ray emission over a narrow energy band (e.g., the low-energy thermal emission from normal galaxies, or AGNs with large equivalent width emission lines) and in comparing the rest-frame X-ray emission from sources at different redshifts (e.g., the rest-frame 1–2 keV emission from a source is observed at 0.5–1.0 keV). Two source-detection grade sets were used: the “restricted ACIS grade set”, and the “standard ASCA grade set” (see Table 2). All photometry is reported using the standard ASCA grade set.
Point-source detection was performed in each band with wavdetect (Freeman et al. 2002) using a “ sequence” of wavelet scales (i.e., 1, , 2, , 4, , and 8 pixels). Previous studies have shown that using larger scales can detect a few additional sources at large off-axis angles (see §3.2.2 in B01). However, we have not searched for sources using larger scales here because the source properties and positions are too poorly defined to give useful results. Our key criterion for source detection is that a source must be found with a given false-positive probability threshold in at least one of the seven standard bands using either the standard ASCA or restricted ACIS grade sets. The chosen false-positive probability thresholds in each band are and for the main source catalog and the supplementary optically bright source catalog, respectively.
If we treat the 14 images (i.e., the seven ASCA-grade images and the seven restricted ACIS-grade images) searched as entirely independent, false sources are expected in the main Chandra source catalog for the case of a uniform background. As mentioned in B01, due to the large variation in effective exposure time across the field and the increase in background near bright point sources (due to the PSF “wings”), we might expect the number of false sources to be increased by a factor of 2–3. However, since wavdetect suppresses fluctuations on scales smaller than the PSF, a single pixel is unlikely to be considered a source detection cell, particularly at large off-axis angles. Hence, our false-source estimates are likely to be conservative. Indeed, we argue in §3.4.1 that the true number of false sources is likely to be considerably lower than our predictions. We provide an estimation of the number of false sources in the supplementary optically bright Chandra source catalog in §3.4.2.
We also searched for sources in the 6–8 keV band. Although a few intrinsically hard X-ray sources were detected in this very hard band (12 sources had ), the bulk of the 34 detected sources were found to be bright X-ray sources with comparatively steep X-ray spectral slopes. Only one very faint source was detected in this band and not detected in all of the other bands (the source position is 12h 36m 305, 19′26′′); however, since 1 false source is formally expected in this band for a false-positive probability threshold, this source may not be real. We do not provide counts and flux information for the sources detected in this band, but we do indicate the detected sources in column 13 of Table 3a (see §3.4.1).
3.3 Astrometry
We refined the absolute X-ray source positions by matching X-ray sources from the main point-source catalog (see §3.4.1) to 1.4 GHz radio sources detected by Richards (2000). The 240 1.4 GHz sources detected across the CDF-N field have accurate () individual positions, and the Richards (2000) radio image is tied to the FK5 reference frame to an accuracy of . The X-ray sources were matched to the radio sources using a search radius. One hundred (100) X-ray sources were found to have a radio counterpart (these sources are indicated in column 13 of Table 3a; see §3.4.1). The vast majority of these matches are expected to be correct, but are statistically expected to be false matches. We also note that in some cases the X-ray source may be offset from the radio source even though both are associated with the same galaxy (e.g., a galaxy with a radio-emitting nuclear starburst that also has an off-nuclear ultraluminous X-ray binary). From a comparison of the X-ray and radio source positions, we found small shift and plate-scale corrections. The plate-scale correction [ every 12 in both right ascension (RA) and declination (Dec)] implies a 0.05% adjustment to the pixel size; we found the same correction was required for the CDF-S observations (see the Appendix). These corrections have been applied to the X-ray source positions.
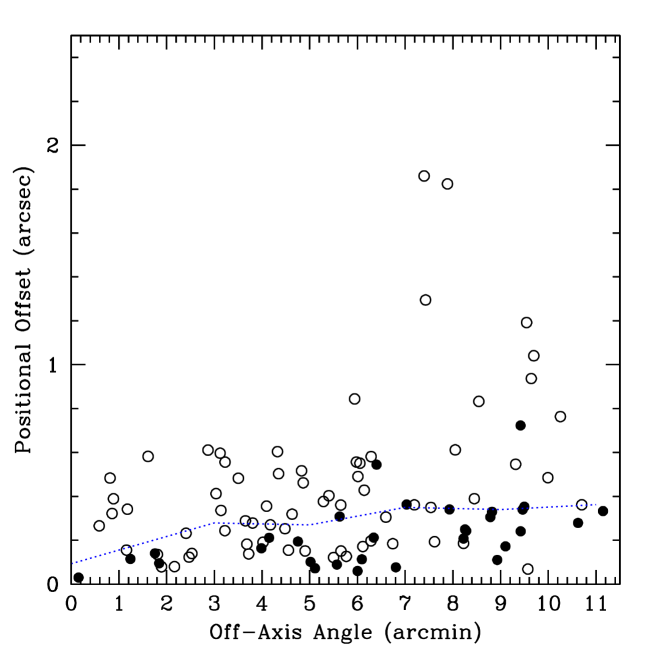
We investigated the accuracy of the X-ray source positions using the 100 X-ray detected radio sources. In Figure 7 we show the positional offset between the X-ray and radio sources versus off-axis angle. The median offset is ; however, there are also clear off-axis angle and source-count dependencies. The off-axis angle dependence is due to the HRMA PSF becoming broad at large off-axis angles, while the count dependency is due to the difficulty of centroiding a faint X-ray source. The median offset of the bright X-ray sources ( 200 full-band counts) is only , and almost all sources have offsets within . The median offset of the faint X-ray sources ( 200 full-band counts) is . However, some faint X-ray sources can have offsets as large as 1–2 at large off-axis angles; for these sources we verified that the radio emission is not extended by visually inspecting the 1.4 GHz image. Since the positional uncertainty of individual radio sources can be up to , it is possible that the accuracy of the X-ray source positions is partially limited by the radio data. The positional uncertainty of each source is estimated following equations 1 & 2 (see §3.4.1).
3.4 Point-source Catalogs
3.4.1 Main Chandra Source Catalog
We ran wavdetect with a false-positive probability threshold of on all of the 14 images. The resulting source lists were then merged to create the point-source catalog given as Tables 3a and 3b. For cross-band matching, a matching radius of was used for sources within of the average aim point. For larger off-axis angles, a matching radius of was used. These matching radii were chosen based on inspection of histograms showing the number of matches obtained as a function of angular separation (see §2 of Boller et al. 1998); with these radii the mismatch probability is % over the entire field.
We also used wavdetect to search the seven standard-band ASCA-grade images for lower-significance, cross-band counterparts to the highly significant sources already detected at the level in at least one of the seven standard bands; in these runs we used a false-positive probability threshold of . We found 195 additional cross-band counterparts in this manner. Since the spatial-matching requirement greatly reduces the number of pixels being searched, only of these cross-band counterparts is expected to be false.
We improved upon the wavdetect source positions using a matched-filter technique. This technique convolves the full-band image of each source with a combined PSF. The combined PSF is automatically generated as part of the acis_extract procedure (Broos et al. 2002) within tara (see Footnote 4) and is produced by combining the theoretical PSF of a source for each observation, weighted by the number of detected counts.101010acis_extract can be accessed from http://www.astro.psu.edu/xray/docs/TARA/ae_users_guide.html. The theoretical PSFs are taken from the CXC PSF library; see http://asc.harvard.edu/ciao2.2/documents_dictionary.html#psf. This technique takes into account of the fact that, due to the complex PSF at large off-axis angles, the peak of the X-ray emission does not always correspond to the X-ray source position. The matched-filter technique provides a significant improvement ( on average) in the positional accuracy for sources further than 5 from the average aim-point. For smaller off-axis angles there was no overall improvement, and the source positions were determined using a simple centroiding algorithm.
Manual correction of the source properties and source positions were required in some special cases. We manually separated five close doubles (–) and determined the position of each separated source. These sources incur larger photometric errors due to the difficulty of the separation process. It was also necessary to perform manual photometry for 75 sources that were located close to bright sources, lay in regions of high background, or lay partially outside of the field. Finally, visual inspection of the X-ray source positions showed small offsets from the peak of the X-ray emission for 31 sources; we took into account of the fact that the peak of the X-ray emission does not always correspond to the X-ray source position for sources at large off-axis angles. The positions of these sources were adjusted manually. We have flagged sources that required manual correction in column 13 of Table 3a (see below).
The main Chandra source catalog is presented as Tables 3a and 3b. Table 3a provides the basic source properties: source position and uncertainty, source counts in each band, and additional notes. Details of the columns in Table 3a are given below.
-
•
Column 1 gives the source number. Sources are listed in order of increasing RA.
-
•
Columns 2 and 3 give the RA and Dec of the X-ray source, respectively. These positions have been determined using the procedure described above. To avoid truncation error, we quote the positions to higher precision than in the International Astronomical Union approved names beginning with the acronym “CXO HDFN.”111111See http://cxc.harvard.edu/udocs/naming.html.
-
•
Column 4 gives the positional uncertainty. As shown in §3.3, the positional uncertainty is dependent on off-axis angle and the number of detected counts. For the brighter X-ray sources ( 200 full-band counts) the positional uncertainties are given by the empirically determined equation:
(1) where is the positional uncertainty in arcsec and is the off-axis angle in arcmin (compare with Figure 7). The stated positional uncertainties are for 80–90% confidence (see also Barger et al. 2003a for analyses using optical data), and the accuracy of our astrometric solution is discussed in §3.3.
For the fainter X-ray sources ( 200 full-band counts) the positional uncertainties are given by the empirically determined equation:
(2) -
•
Column 5 gives the off-axis angle for each source in arcminutes. This is calculated using the source position given in columns 2 and 3 and the average aim point (see Table 1).
-
•
Columns 6–12 give the counts in the seven standard bands. All values are for the standard ASCA grade set, and they have not been corrected for vignetting. Source counts and statistical errors (from Gehrels 1986) have been calculated using circular aperture photometry; extensive testing showed this method to be more reliable than the wavdetect photometry. The circular aperture was centered at the position given in columns 2 and 3 for all bands.
The local background is determined in an annulus outside of the source-extraction region. The mean number of background counts per pixel is calculated from a Poisson model using , where is the number of pixels with 0 counts and is the number of pixels with 1 count. Although only the numbers of pixels with 0 and 1 counts are measured, this technique directly provides the mean background even when . This technique is more robust than , which is only applicable when the mean background is count pixel-1. Furthermore, by ignoring all pixels with count, this technique guards against background contamination from sources. The principal requirement for using this technique is that the background follows a Poisson distribution; we show in §4.2 that the ACIS-I background matches this criterion. The total background for each source is calculated and subtracted to give the net number of source counts.
For sources with fewer than 1000 full-band counts, we have chosen the aperture radii based on the encircled-energy function of the Chandra PSF as determined using the CXC’s mkpsf software (Feigelson et al. 2000; Jerius et al. 2000; M. Karovska and P. Zhao 2001, private communication). In the softest bands (i.e., SB, SB1, and SB2), where the image quality is the best, the aperture radius was set to the 95% encircled-energy radius of the PSF. In the other bands, the 90% encircled-energy radius of the PSF was used. Appropriate aperture corrections were applied to the source counts.
For sources with more than 1000 full-band counts, systematic errors in the aperture corrections often exceed the expected errors from photon statistics when the apertures described in the previous paragraph are used. Therefore, for such sources we used larger apertures to minimize the importance of the aperture corrections; this is appropriate since these bright sources dominate over the background. We set the aperture radii to be twice those used in the previous paragraph and manually inspected these sources to verify that the measurements were not contaminated by neighboring objects.
We have performed several consistency checks to verify the quality of the photometry. For example, we have checked that the sum of the counts measured in the soft and hard bands does not differ from the counts measured in the full band by an amount larger than that expected from measurement error (we also performed similar tests for SB1, SB2, HB1, and HB2). Systematic errors in our photometry are estimated to be %.
We have verified that the cosmic ray afterglow removal procedure (see §2.2) has not led to significant systematic photometric errors. Due to the low count rates of our sources, incident X-ray photons are almost never incorrectly flagged as afterglow events. To guard against the possibility that some of the faintest X-ray sources are cosmic ray afterglows missed by the cosmic ray afterglow removal procedure, we inspected the photon arrival times of all of the X-ray sources with 10 counts in either the soft or hard band. None of the sources appeared to be a cosmic ray afterglow.
When a source is not detected in a given band, an upper limit is calculated. All upper limits are determined using the circular apertures described above. When the number of counts in the aperture is , the upper limit is calculated using the Bayesian method of Kraft, Burrows, & Nousek (1991) for 99% confidence. The uniform prior used by these authors results in fairly conservative upper limits (see Bickel 1992), and other reasonable choices of priors do not materially change our scientific results. For larger numbers of counts in the aperture, upper limits are calculated at the level for Gaussian statistics.
-
•
Column 13 gives notes on the sources. “H” denotes objects lying in the HDF-N (see Figure 2). “O” refers to objects that have large cross-band positional offsets (). All but one of these sources lie at off-axis angles of , and the flagged counterpart may not be associated with the main counterpart in some cases. “M” refers to sources where the photometry was performed manually. “S” refers to close-double sources where manual separation was required. “R” refers to radio-detected sources that were used in determining the astrometric accuracy (see §3.3). “HB3” refers to a detection in the 6–8 keV band. For further explanation of many of these notes, see the above text in this section on manual correction of the wavdetect results.
Table 3b provides additional source properties: effective exposure, band ratios, the effective photon index, and source fluxes. Details of the columns in Table 3b are given below.
-
•
Column 1 gives the source number (see column 1 of Table 3a for details).
-
•
Columns 2 and 3 give the RA and Dec of the X-ray source, respectively (see columns 2 and 3 of Table 3a for details).
-
•
Column 4 gives the effective exposure time derived from the full-band exposure map (see §3.1 for details on the exposure maps). Dividing the counts listed in columns 6–12 of Table 3a by the effective exposure will provide vignetting-corrected count rates.
-
•
Column 5 gives the main band ratio, defined as the ratio of counts between the hard and soft bands (see columns 14–16 for descriptions of the other band ratios). Quoted band ratios have been corrected for differential vignetting between the hard band and soft band using the appropriate exposure maps. Errors for this quantity are calculated following the “numerical method” described in §1.7.3 of Lyons (1991); this avoids the failure of the standard approximate variance formula when the number of counts is small (see §2.4.5 of Eadie et al. 1971). Note that the error distribution is not Gaussian when the number of counts is small.
-
•
Column 6 gives the effective photon index () for a power-law model with the Galactic column density, taking into account the continuous ACIS quantum efficiency degradation described in columns 7–13. The effective photon index has been calculated based on the band ratio in column 5 when the number of counts is not low.
A source with a low number of counts is defined as being (1) detected in the soft band with counts and not detected in the hard band, (2) detected in the hard band with counts and not detected in the soft band, (3) detected in both the soft and hard bands, but with counts in each, or (4) detected only in the full band. When the number of counts is low, the photon index is poorly constrained and set to , a representative value for faint sources that should give reasonable fluxes.
-
•
Columns 7–13 give observed-frame fluxes in the seven standard bands; fluxes are in units of erg cm-2 s-1. Fluxes have been computed using the counts in columns 6–12 of Table 3a, the appropriate exposure maps, and the spectral slopes given in column 6. The fluxes have not been corrected for absorption by the Galaxy or material intrinsic to the source. For a power-law model with , the soft-band and hard-band Galactic absorption corrections are % and %, respectively.
X-ray spectral and variability analyses of the brighter X-ray sources have shown that many have complex X-ray spectra and vary significantly in X-ray count rate over the 20 observations (Bauer et al. 2003). More accurate fluxes for these sources would require direct fitting of the X-ray spectra for each observation, which is beyond the scope of this paper.
It has been recently shown that there has been continuous degradation of the ACIS quantum efficiency since the launch of Chandra. This degradation is thought to be due to absorption caused by molecular contamination of the ACIS optical blocking filters. We have corrected the fluxes for this absorption using acisabs version 1.1, taking into account the dates of each of the 20 observations.121212The IDL code for acisabs can be obtained from http://www.astro.psu.edu/users/chartas/xcontdir/xcont.html. See http://cxc.harvard.edu/cal/Acis/Cal_prods/qeDeg/ for more information on the ACIS quantum efficiency degradation. For a 1.4 source, the soft-band and hard-band corrections are 10% and 0%, respectively.
-
•
Columns 14–16 give additional band ratios. These are used to provide X-ray color information (see §4.1). Band ratio 2 is defined as the ratio of counts between SB2 and SB1, band ratio 3 is defined as the ratio of counts between HB2 and HB1, and band ratio 4 is defined as the ratio of counts between HB1 and SB2. Errors for the band ratios have been calculated following the procedure given in column 5, and all quoted band ratios have been corrected for differential vignetting using the appropriate exposure maps (see §3.1).
Many of the sources in Table 3 have been presented in earlier papers. The source properties given here supersede those presented in earlier papers.
In Table 4 we summarize the source detections in the seven standard bands. In total 503 independent point sources are detected; 20 ( deg-2) of these lie in the HDF-N. In Table 5 we summarize the number of sources detected in one band but not another. All but one of the sources are detected in either the full band or the soft band; the full-band and soft-band undetected source is detected in the hard band.
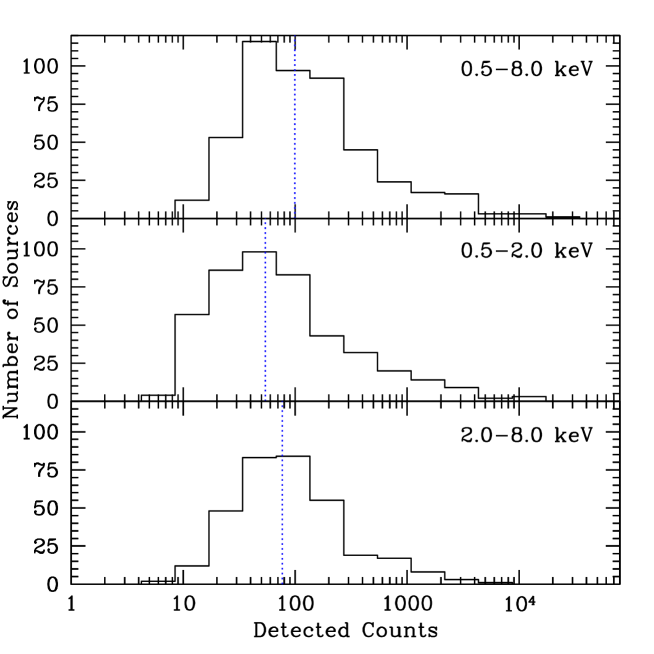
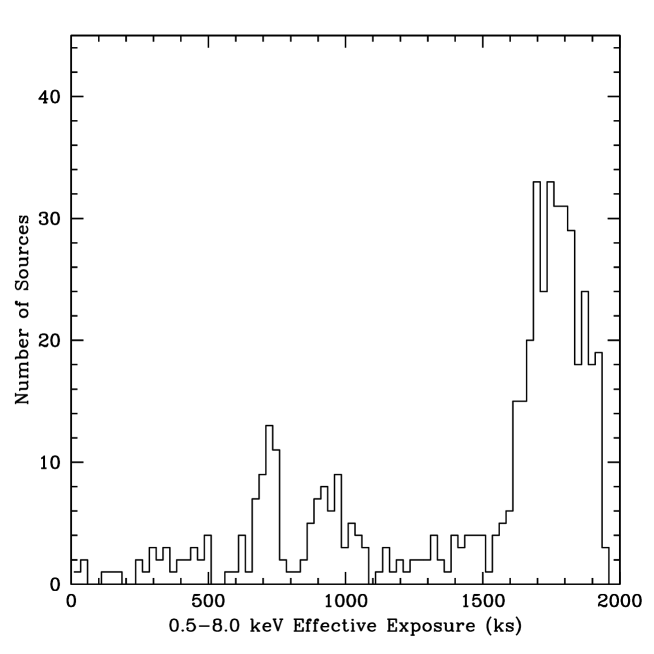
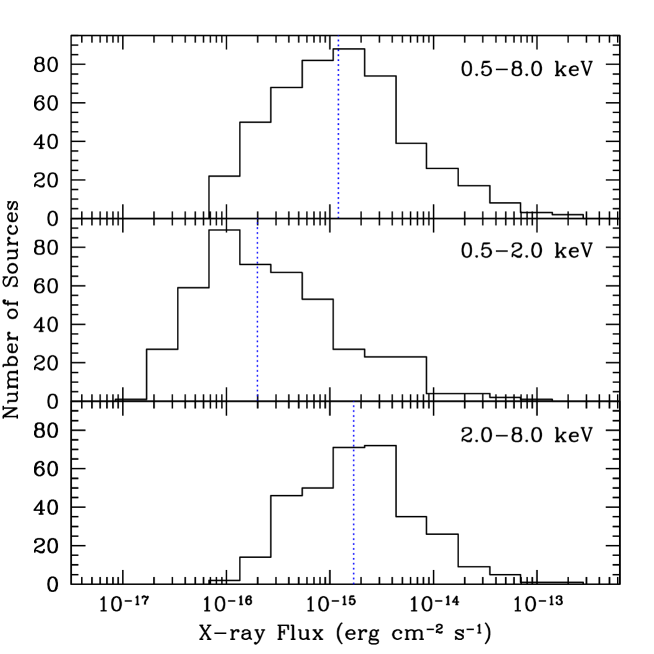
In Figure 8 we show the distributions of detected counts in the full, soft and hard bands. The median number of full-band counts is 100 which is sufficiently large for basic X-ray spectral analysis (see Bauer et al. 2003 for X-ray spectral analyses of the brightest X-ray sources in this field, Vignali et al. 2002a,b for X-ray spectral analyses of EROs and AGNs, and Alexander et al. 2003 for X-ray spectral analyses of X-ray detected bright submm sources). In Figure 9 we show the distribution of full-band effective exposure time. The median exposure time (1.7 Ms) shows that the majority of the sources have deep X-ray coverage. The two “bumps” at 0.7 Ms and 0.95 Ms are due to off-axis sources detected in regions only covered by one of the two main roll angles (see Table 1). In Figure 10 we show the distributions of X-ray flux in the full, soft, and hard bands. A broad range of X-ray fluxes is found, with 50% of the sources having soft-band and hard-band fluxes of erg cm-2 s-1 and erg cm-2 s-1, respectively.
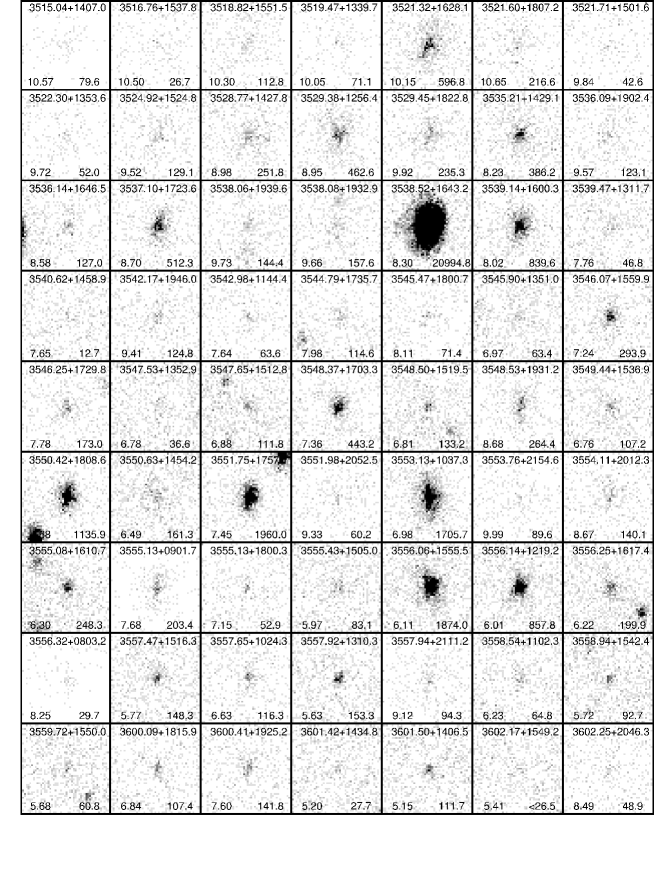
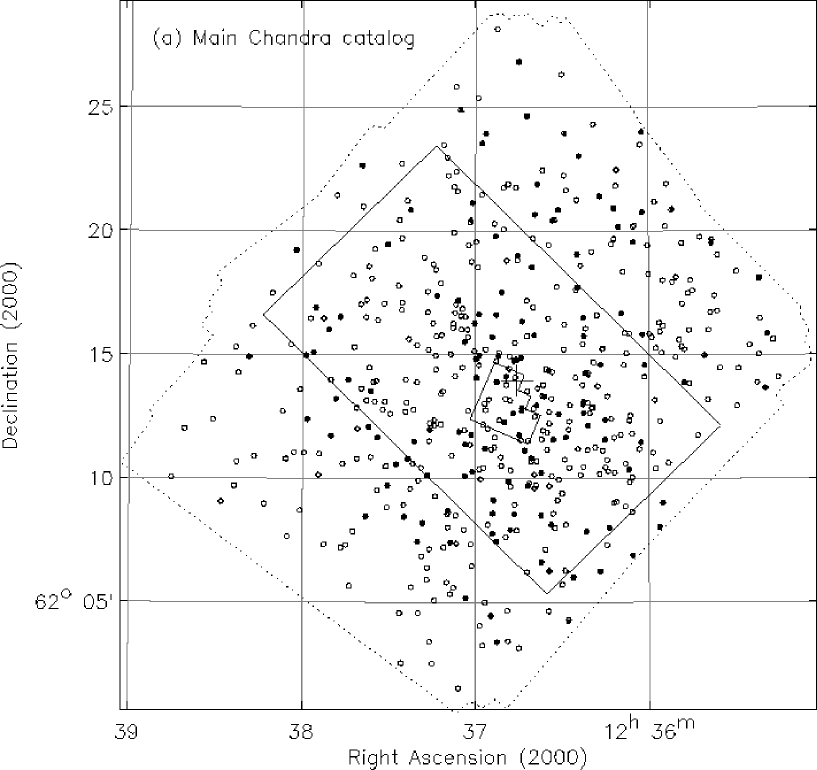
In Figure 11 we show “postage-stamp” images in the full band for all detected sources. The broad range of source sizes is primarily due to the broadening of the HRMA PSF with off-axis angle. A few of the sources appear to be resolved; in most cases this is an artifact of the complex Chandra off-axis PSF. In Figure 12a we plot the positions of the sources. This format removes the illusory effect produced by the changing PSF size across the field of view. The majority of the sources lie in the most sensitive region of the field (i.e., close to the average aim point). One hundred and thirty-eight (138) sources are newly detected in the 2 Ms Chandra exposure. Figure 12a shows that the new sources are detected over the majority of the field.
Five of the 370 sources detected in the 1 Ms Chandra exposure are undetected here (see Table 6). The five undetected sources were weakly detected in the 1 Ms Chandra exposure: four sources were only detected with the restricted ACIS grade set and with 15 full-band counts, while the other source (CXOHDFN J123813.4+621134) had 32.9 full-band counts but lay at a large off-axis angle ( 10) and could have a significant contribution from background. Only one of these five sources (CXOHDFN J123633.8+621327) has an optical counterpart within of the X-ray position (Barger et al. 2002; see Table 6). Such faint or absent optical counterparts raise the possibility that some of these sources are false. We examined the source regions in the full, soft, and hard bands and found evidence for possible X-ray emission in two cases (see Table 6); however, in both cases the emission is not clearly distinct from the background. We also extracted the X-ray events within 1 of the position of each source. In four cases 0–2 counts were found for the second 1 Ms exposure, and in one case 4 counts were found (CXOHDFN J123627.2+621308). With the exception of the latter case, the number of counts is similar to that expected from the background; however, we cannot rule out the possibility that these are variable or transient sources. Since we conservatively predicted 10–15 false X-ray sources in the 1 Ms Chandra catalog, our results here may suggest that the true number of false sources is 2–3 times lower than this.
3.4.2 Supplementary Optically Bright Chandra Source Catalog
Since the density of optically bright sources on the sky is comparatively low, we can search for X-ray counterparts to optically bright sources at a lower significance threshold than that used in the main Chandra source catalog without introducing many false sources (see §5.3 of Richards et al. 1998 for a similar technique at radio frequencies). We ran wavdetect with a false-positive probability threshold of on all of the 14 standard-band images. A basic lower significance Chandra catalog was produced containing 430 independent X-ray sources not present in the main Chandra source catalog. Many of these sources are likely to be false; however, we can extract a large number of real sources by matching to optically bright counterparts.
We used the Liu et al. (1999) -band images in the construction of our optical source catalog. These images are relatively shallow (a 3 magnitude limit of 23.1); however, they cover the entire area of the CDF-N, and deep optical images are not required for this catalog. An optical source list of 3,400 sources was generated using the sextractor photometry tool (Bertin & Arnouts 1996), assuming the “Best” magnitude criteria. We searched for X-ray counterparts to these optical sources using a matching radius of . A false-matching probability was calculated based on the density of optical sources down to the magnitude of each source. The -band number counts used in determining this false-matching probability were derived directly from the Liu et al. (1999) data. In the limited region of overlap, the number counts were found to be consistent with those of Hogg et al. (1997). A “boosted” X-ray significance was then determined by multiplying this false-matching probability with the false-positive threshold used to define the lower significance catalog. Only sources with a boosted X-ray significance of are included in the supplementary optically bright Chandra source catalog; this significance level threshold was empirically chosen to provide a good balance between the number of detected sources and the number of false sources.
In total 74 optically bright X-ray sources met this criterion. We estimated the expected number of false matches by offsetting the X-ray source coordinates in RA and Dec by (both positive and negative shifts) and re-correlating with the optical sources. On average 8 matches were found to the 3,400 optical sources with these tests, demonstrating that the vast majority of the 74 X-ray matches are real; considering the optical source density, the search radius, and the total number of X-ray sources used in the matching, 6 false matches are expected. We also included five sources where the X-ray source lay – from the centroid of the optical source but was still within the extent of the optical emission. The X-ray counterparts for these sources may be off-nuclear X-ray binaries or star forming regions. Since these five sources were identified in a somewhat subjective manner, it is not meaningful to determine a false-matching probability. These sources are indicated in column 18 of Table 7a. Thus the supplementary optically bright Chandra source catalog contains 79 sources.
As for the main Chandra source catalog, the supplementary optically bright Chandra source catalog is divided into two tables (Tables 7a and 7b). The format of Table 7a (basic source properties) is similar to that of Table 3a, with the properties of the optical counterparts and the probabilities of a false match also included. Details of the columns in Table 7a are given below.
-
•
Column 1 gives the source number (see column 1 of Table 3a for details).
-
•
Columns 2 and 3 give the RA and Dec of the X-ray source, respectively. The wavdetect positions are given for these faint X-ray sources. Whenever possible, we quote the position determined in the full band; when a source is not detected in the full band we use, in order of priority, the soft-band position, hard-band position, SB1 position, SB2 position, HB1 position, or HB2 position. The priority ordering of position choices above was designed to maximize the signal-to-noise of the data being used for positional determination. To avoid truncation error, we quote the positions to higher precision than in the International Astronomical Union approved names beginning with the acronym “CXO HDFN” (see Footnote 11).
-
•
Column 4 gives the positional uncertainty in arcseconds. For these faint X-ray sources the positional uncertainty corresponds to , the 90th percentile of the average optical-X-ray positional offsets given in column 15.
-
•
Column 5 gives the off-axis angle for each source in arcminutes (see column 5 of Table 3a for details).
-
•
Columns 6–12 give the counts in the seven standard bands. The photometry is taken directly from wavdetect for these faint X-ray sources.
-
•
Columns 13 and 14 give the RA and Dec of the optical source centroid, respectively.
-
•
Column 15 gives the offset between the optical and X-ray sources in arcseconds.
-
•
Column 16 gives the -band magnitude of the optical source (Vega-based photometric system).
-
•
Column 17 gives the false-match probability described above. This should be multiplied by 10-5 to calculate the boosted X-ray significance.
-
•
Column 18 gives notes on the sources. With the exception of the additional note given below, the key for these notes is given in column 13 of Table 3a. “L” refers to objects where the X-ray source lies from the centroid of the optical source but is still within the extent of the optical emission (see the text above for further discussion).
The format of Table 7b (additional source properties) is similar to that of Table 3b. However, since these are very faint X-ray sources, the band ratios and photon indices are not calculated ( is assumed when calculating the source fluxes below). Details of the columns in Table 7b are given below.
-
•
Column 1 gives the source number (see column 1 of Table 3a for details).
-
•
Columns 2 and 3 give the RA and Dec of the X-ray source, respectively (see columns 2 and 3 of Table 7a for details).
-
•
Column 4 gives the effective exposure time derived from the full-band exposure map (see §3.1 for details of the exposure maps). Dividing by the counts listed in columns 6–12 of Table 7a by the effective exposure will provide vignetting-corrected count rates.
-
•
Columns 5–11 give observed-frame fluxes in the seven standard bands; fluxes are in units of erg cm-2 s-1 and have been calculated assuming (see the stacking results below). The fluxes have not been corrected for absorption by the Galaxy or material intrinsic to the source; however, the fluxes have been adjusted to take into account the continuous ACIS quantum efficiency degradation. See columns 7–13 of Table 3b for further details.
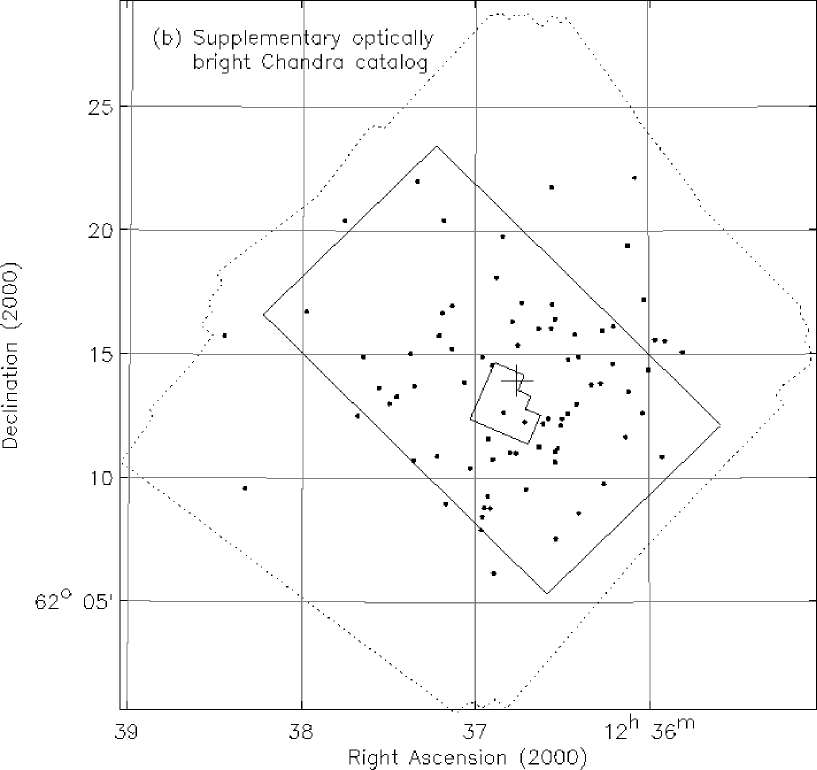
The properties of the 79 sources in Table 7 are more homogeneous than those of the sources in Table 3, probably due to the optical selection criteria. As expected, all of the 79 sources are X-ray faint (all sources have 30 soft-band counts, and all but two sources have soft-band fluxes of erg cm-2 s-1), and the majority lie in the most sensitive region of the field (i.e., close to the average aim point; see Figure 12b). Sixty eight ( 86%) of the sources are detected in at least one of the softest X-ray bands (SB, SB1, and SB2) while, by comparison, only four ( 5%) of the sources are detected in the hardest bands (HB, HB1, and HB2); all but one of the 11 sources not detected in the softest bands are detected in the full band.
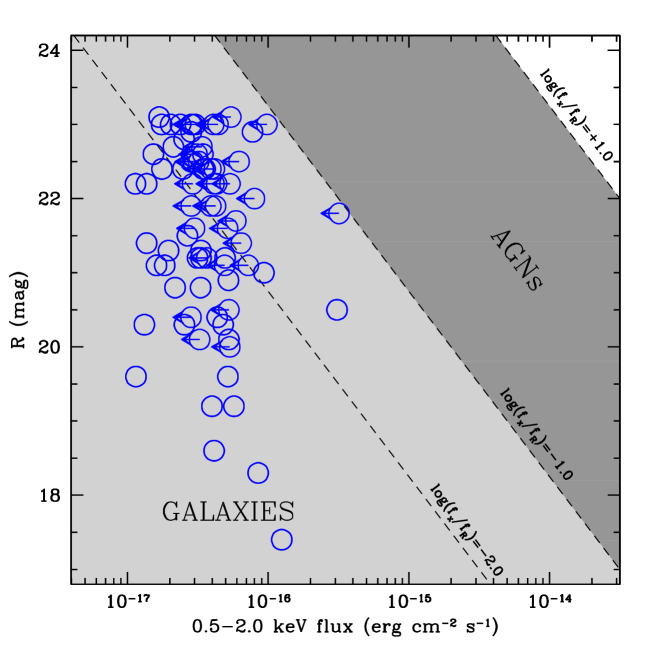
The -band magnitudes of the supplementary sources cover 17.4–23.1, and the majority ( 66%) have 21–23. In Figure 13 we show the -band magnitude versus soft-band flux. All of the sources reside in the region expected for starburst and normal galaxies. A fraction of these sources may be low-luminosity AGNs; however, the small number of hard-band detected sources suggests that very few are luminous absorbed AGNs. We can place an average constraint on the X-ray spectral slopes of these sources by stacking the individual sources together. Following §3.3 of Alexander et al. (2001) we find an average band ratio of , corresponding to an average effective photon index of . This result is consistent with those found by Alexander et al. (2002a) and Hornschemeier et al. (2003) from stacking X-ray-infrared detected emission-line galaxies and optically bright, X-ray faint sources, respectively. This supports the idea that few absorbed AGNs are present in these optically bright sources.
Due to their optical selection, the optically bright supplementary sources may not be representative of the faintest X-ray sources. However, we cannot easily extract a reliable list of 23 lower significance sources as a comparison to these optically bright sources. Although clearly an optically bright X-ray faint selection will favor the identification of non-AGNs (e.g., Hornschemeier et al. 2003), the observed steepening of the stacked-average photon index at the lowest count rates found in §4.1 provides evidence that normal and starburst galaxies are comparitively common at faint X-ray fluxes (see also Alexander et al. 2002a and Bauer et al. 2002b).
4 Data and Background Analysis
4.1 X-ray Band Ratio and X-ray Color-Color Analysis
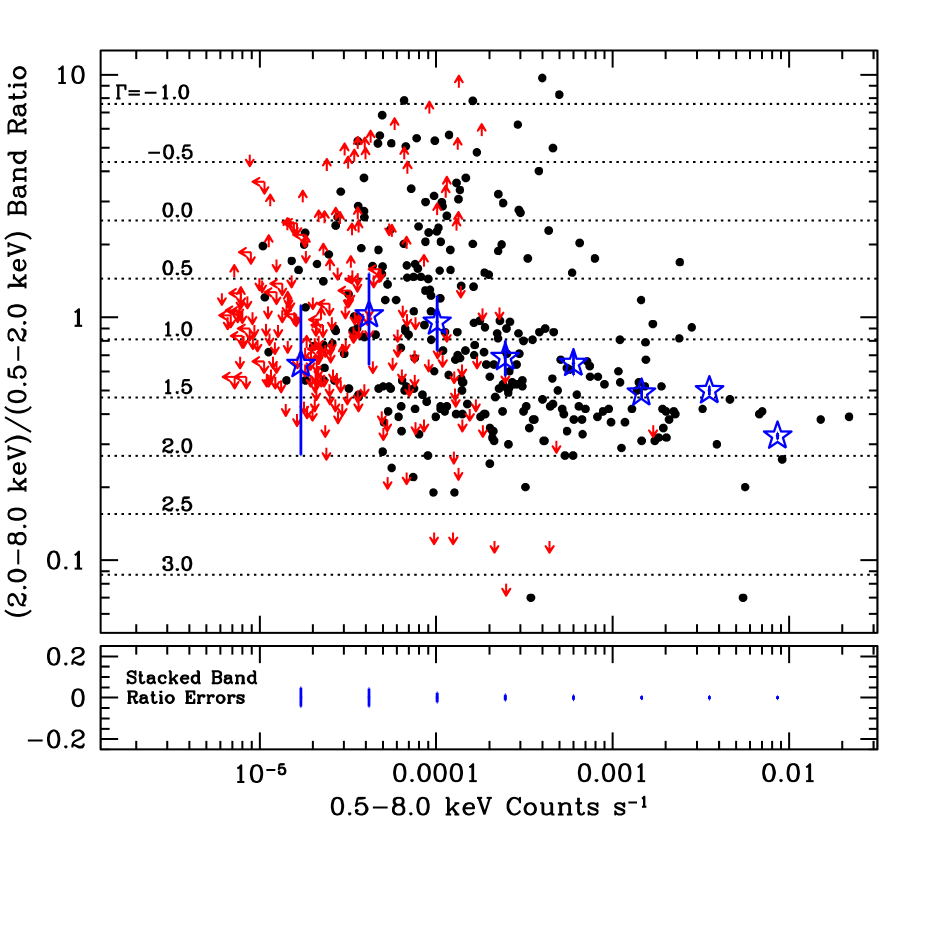
In Figure 14 we show the band ratio as a function of full-band count rate for the sources in the main Chandra catalog. A trend toward larger band ratios for decreasing count rates is seen. This hardening of the X-ray spectral slope has been reported in other studies (e.g., della Ceca et al. 1999; Ueda et al. 1999; Mushotzky et al. 2000; Tozzi et al. 2001; B01) and appears to be due to an increase in the number of absorbed AGNs detected. For the sources in this study the stacked-average photon index flattens from 1.8 to 0.8 for full-band count rates of to counts s-1. At the lowest full-band count rates ( counts s-1) the stacked-average photon index steepens ( 1.2), possibly due to the increasingly large contribution from normal and starburst galaxies (e.g., Hornschemeier et al. 2003); the difference is significant at the 6.4 level. Absorbed AGNs are undoubtedly detected at these low count rates; however, they are likely to represent a smaller fraction of the X-ray source population than that found at higher count rates.
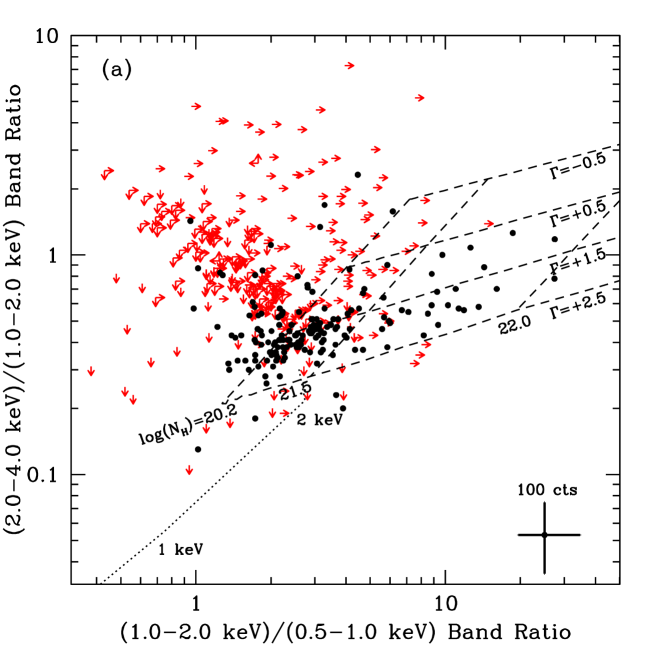
In Figure 15 we show X-ray color-color diagrams. These diagrams provide diagnostics on the nature of X-ray detected sources and they are particularly useful for investigating X-ray sources too faint for X-ray spectral analysis. In our comparisons we have simplistically assumed that AGNs can be characterized by power-law emission with varying amounts of neutral intrinsic absorption. Starburst and normal galaxies are also often characterized by power-law emission in the rest-frame 2–8 keV band due to the presence of X-ray binaries (e.g., Kim, Fabbiano, & Trinchieri 1992a,b; Ptak et al. 1999). However, at soft X-ray energies (i.e., 2 keV), the emission from starburst and normal galaxies is often better modeled with a soft thermal component (e.g., Ptak et al. 1999).
Figure 15a compares the SB2/SB1 and HB1/SB2 band ratios. This choice of band ratios is useful for identifying AGNs with low-to-moderate absorption, starburst galaxies, and normal galaxies. The bulk of the sources fall in the region where AGNs are expected to lie (i.e., an average spectral slope of 1.8 with varying amounts of intrinsic absorption); similar conclusions were drawn by Barger et al. (2002) and Mainieri et al. (2002) from X-ray color-color analyses of bright X-ray sources. However, a considerable fraction ( 20%, 103 sources) have very flat X-ray spectra (HB1/SB21.0) and hence properties inconsistent with simple AGN models. The majority of these sources also show flat X-ray spectra from other diagnostics (e.g., all but two of the sources have HB/SB1.0, and 75 of the 87 sources with HB/SB2.0 have HB1/SB21.0). At high column densities the direct AGN emission is weak, and other components such as reflection, scattering, and line emission can become important. In such cases the X-ray spectrum of a highly absorbed AGN is often poorly characterized by a simple absorbed power-law model.
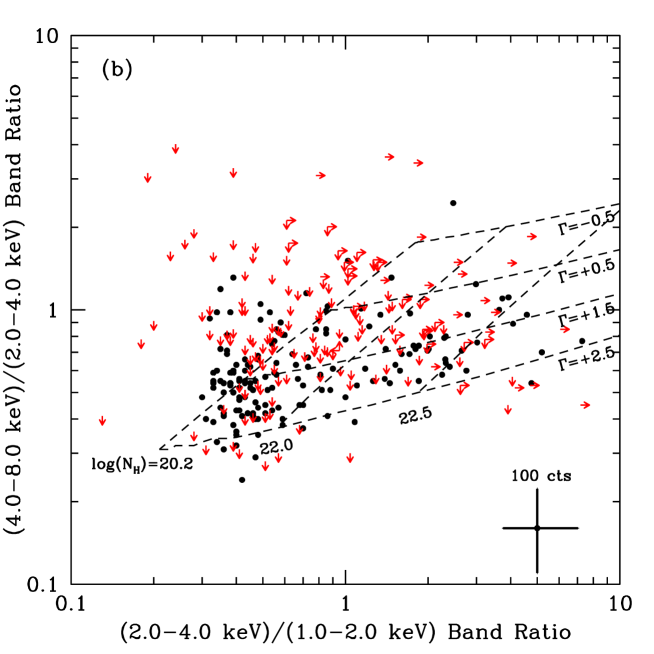
Figure 15b compares the HB1/SB2 and HB2/HB1 band ratios. This choice of band ratios is useful for identifying highly absorbed AGNs. Approximately 70–90% of the AGNs that showed very flat X-ray spectra in Figure 15a (i.e., HB1/SB21.0) fall in the region where highly absorbed AGN are expected to lie in Figure 15b; the very flat X-ray spectra that these sources showed in Figure 15a may be due to other components dominating over the absorbed power-law emission at softer X-ray energies (e.g., scattering, reflection, and line emission). The X-ray emission from the other AGNs with very flat X-ray spectra is still not well characterized by a simple absorbed power-law model, and these sources may be Compton thick AGNs (i.e., cm-2; e.g., Matt et al. 2000).
Based on these simple models, there appears to be few ( 10–30) Compton-thick AGNs; see also Bauer et al. 2003 for direct X-ray spectral analysis constraints of the X-ray brightest sources. Given that Compton-thick AGNs account for 50% of nearby AGNs (e.g., Maiolino et al. 1998; Risaliti et al. 1999), this result may seem surprising. However, since the observed luminosities of nearby Compton-thick AGNs are typically erg s-1 (see Figure 4 in Maiolino et al. 1998), a similar source at 0.5–2.0 would have an X-ray flux of (0.1–1.4) erg cm-2 s-1 (calculated assuming a typical observed spectral slope for Compton-thick AGNs of 1.0; e.g., Maiolino et al. 1998, Bassani et al. 1999). Thus, even in a 2 Ms Chandra exposure, few typical Compton-thick AGNs are expected.
Finally, we note that very few sources lie along the tracks expected for soft thermal emission. This is because we have not yet reached the sensitivity to detect such emission in the HB1 band (see Figure 15a).
4.2 Background and Sensitivity Limits
The faintest sources in the main Chandra catalog have 5 counts (soft band) and 7 counts (hard band), corresponding to count rates of 1 count every 4.5 days (soft band) and 3.2 days (hard band). For a 1.4 power law with Galactic absorption, the corresponding soft-band and hard-band fluxes at the aim point are erg cm-2 s-1 and erg cm-2 s-1, respectively. This gives a measure of the ultimate sensitivity of this survey; however, these numbers are only relevant for a small region close to the aim point. In order to determine the sensitivity across the field it is necessary to take into account the broadening of the PSF with off-axis angle, as well as changes in the effective exposure and background rate across the field. Under the simplifying assumption of uncertainties, we can determine the sensitivity across the field following Muno et al. (2003) as
| (3) |
where is the number of source counts for a given signal-to-noise ratio () and the number of background counts () in a source cell. The only component within this equation that we need to measure is the background. For the sensitivity calculations here we measured the background in a source cell using the background maps described below and assuming an aperture size of 70% of the encircled-energy radius of the PSF; the 70% encircled energy-radius was chosen as a compromise between having too few source counts and too many background counts. The total background includes contributions from the unresolved cosmic background, particle background, and instrumental background (e.g., Markevitch 2001; Markevitch et al. 2003). For our analyses we are only interested in the total background and do not distinguish between these different components.
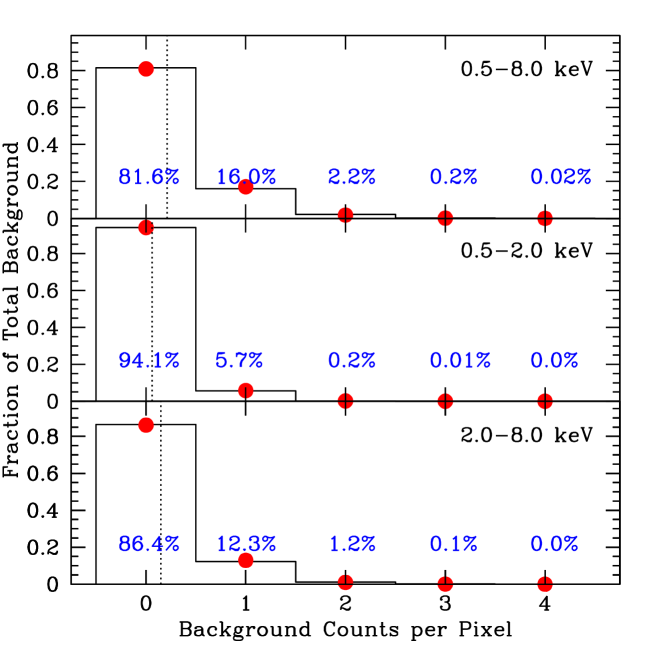
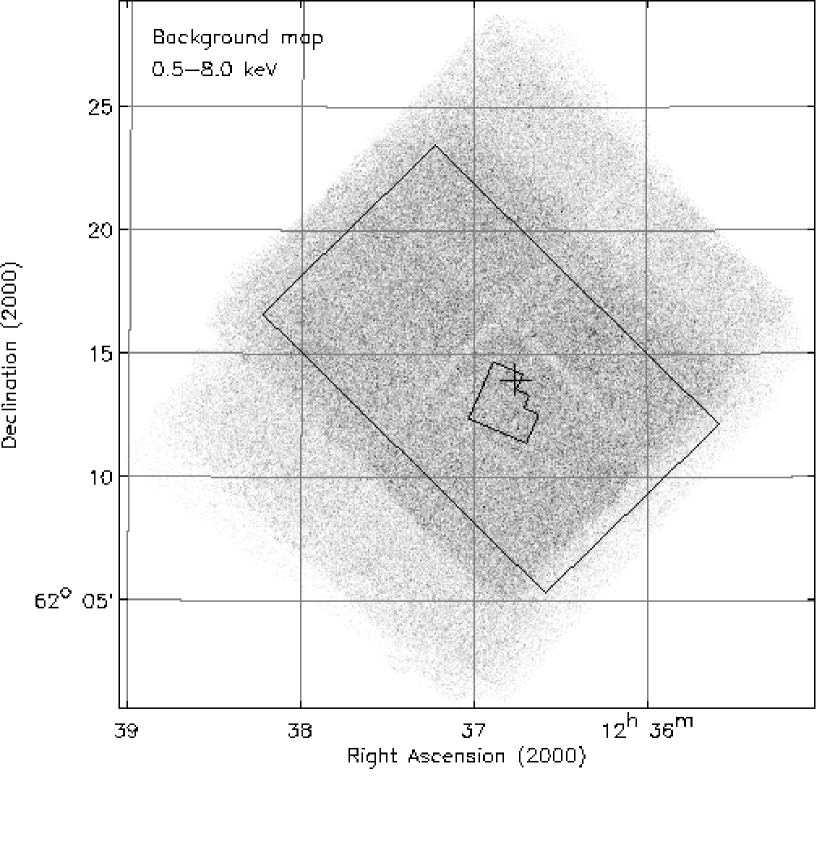
To create background maps in all of the seven ASCA-grade images, we first masked out the point-sources from the main Chandra catalog using apertures with radii twice that of the 90% PSF encircled-energy radii. The resultant images should include minimal contributions from detected point sources. They will include contributions from extended sources (e.g., Bauer et al. 2002a), which will cause a slight overestimation of the measured background close to extended sources. In Figure 16 we show the distributions of background counts per pixel in the full, soft, and hard bands, and in Table 8 we provide the mean backgrounds in the seven standard bands. Even with a 2 Ms Chandra exposure, most of the pixels have no background counts (e.g., in the full band 81.6% of the pixels are zero). For a small number of detected counts, the expected distribution is Poissonian. We compared the background count distributions to Poisson distributions and found them to be very similar (the probability as derived from the Kolmogorov-Smirnov test is 99.99% in all of the seven standard bands; see Figure 16). Since the effective exposure varies across the field, we must be careful that this result is not an effect due to the combination of many different Poisson distributions. To guard against this, we performed the same analyses on many different small ( 4 arcmin2) regions of similar exposure across the field. In all cases the Kolmogorov-Smirnov test probabilities were 99.99% in all of the seven standard bands. We filled in the masked regions for each source with a local background estimated by making a probability distribution of counts using an annulus with inner and outer radii of 2 and 4 times the 90% PSF encircled-energy radius, respectively. The full-band background map is shown in Figure 17. The total number of background counts over the whole image dominates the counts in the detected sources (see Table 8). Since these detected sources contribute the bulk of the cosmic X-ray background, this shows that the unresolved cosmic X-ray background component is a small fraction of the total background counts. Detailed modeling would be required in order to measure the unresolved cosmic X-ray background (see Markevitch et al. 2003 for modeling of the total background using ACIS-S observations).
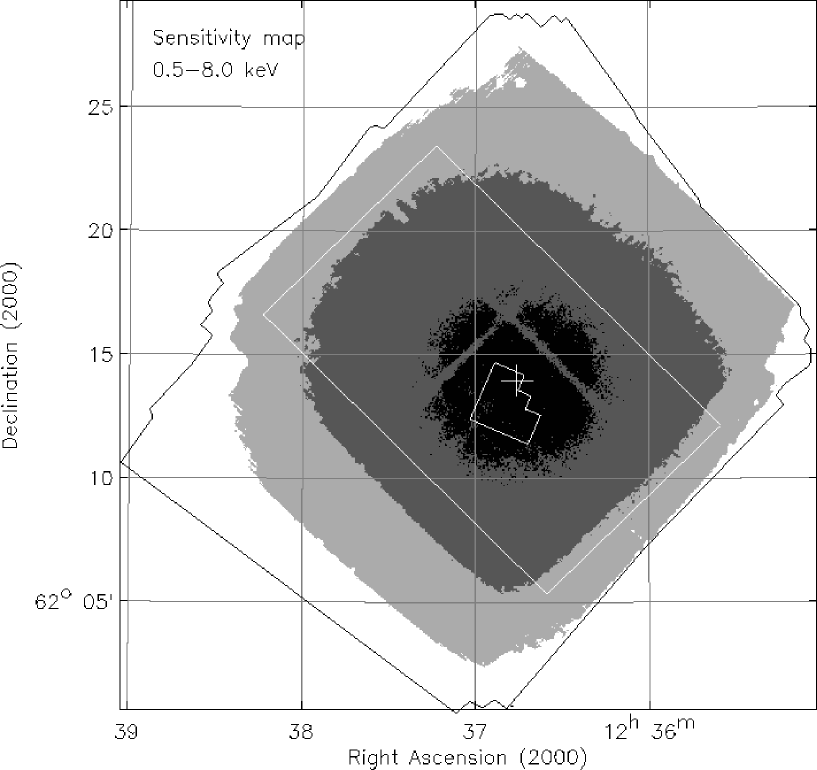
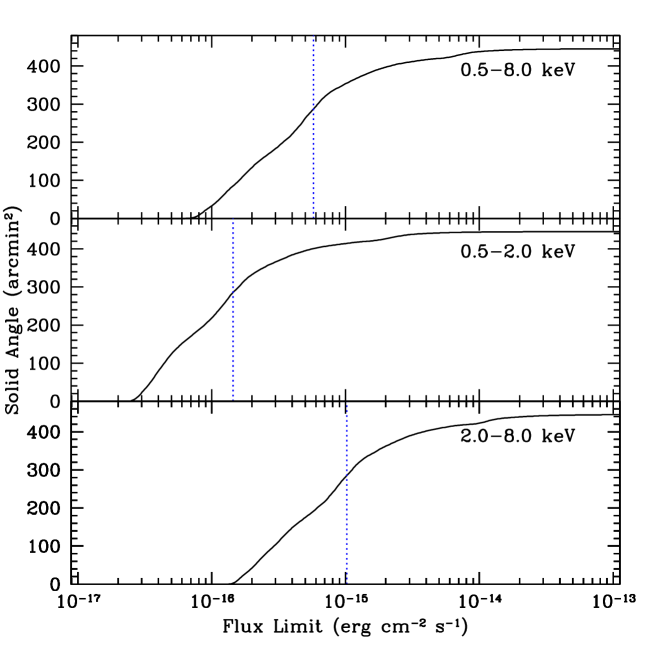
Following equation 3, we generated sensitivity maps [for a signal-to-noise ratio (S/N) of 3] using the background and exposure maps; we assumed a 1.4 power-law model with Galactic absorption. In Figure 18 we show the full-band sensitivity map, and in Figure 19 we show plots of flux limit versus solid angle for the full, soft, and hard bands. The arcmin2 region at the aim point has 0.5–2.0 keV and 2–8 keV sensitivity limits of erg cm-2 s-1 and erg cm-2 s-1, respectively (see Table 9 for the aim point sensitivities in all of the seven standard bands). Since we do not filter out detected sources with S/N, a few sources have fluxes below these sensitivity limits (35 sources in the soft band and 22 sources in the hard band). Approximately 190 arcmin2 of the field [including almost all of the expected area of the IRAC observations for the Great Observatories Origins Deep Survey (GOODS; e.g., Dickinson & Giavalisco 2003)] has a full-band sensitivity limit of erg cm-2 s-1, and 360 arcmin2 (i.e., 1.3 times the size of a single ACIS-I field) has a full-band sensitivity limit of erg cm-2 s-1. The latter flux limit is equivalent to the faintest X-ray sources detected at the aim point in moderately deep ( 100 ks) Chandra observations (see Figure 1).
4.3 Prospects for Longer Chandra Exposures
Doubling the exposure of a Chandra observation leads to an increase in sensitivity between a factor of (for the case of a large background; background limited) and 2 (for the case of no background; photon limited). The total number of background counts is larger than the total number of source counts in the CDF-N field (see Table 8). However, the number of background counts in a detection cell is often negligible; in our analyses here, we will again assume a circular detection cell with a radius equal to the 70% encircled-energy radius of the PSF. For example, the average numbers of background counts in a detection cell 2 from the aim point in the soft and hard bands are 0.8 and 2.5, respectively.
We can examine the transition from photon to background limited using equation 3. For S/N, 3.3 background counts per detection cell marks the point when an observation moves toward being background limited; for 3.3 background counts, the effective increase in sensitivity when doubling the exposure is 1.71 (i.e., between and 2). For our analyses here we will take photon limited as being when there are 3.3 background counts in a detection cell.
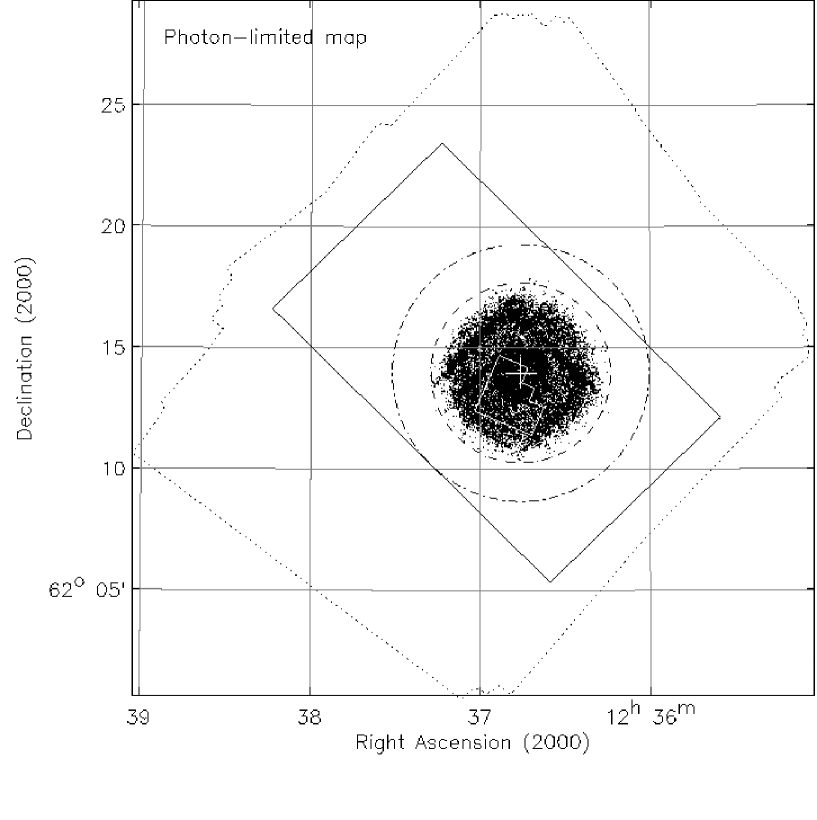
In Figure 20 we show the approximate photon-limited regions for the full, soft, and hard bands, and in Table 9 we provide the approximate photon-limited solid angles in the seven standard bands. The photon-limited region is the largest in the softest bands due to their lower backgrounds and smaller PSFs; however, even in the full band 25 arcmin2 of the field is photon limited. We can estimate the longest Chandra exposure for a photon-limited observation by increasing the background in the current background images (assuming a Poisson distribution with mean count rates taken from Table 8) and re-calculating the photon-limited area for the new exposure. In Table 9 we provide the longest photon-limited exposures in the seven standard bands; for our analyses here the longest exposure corresponds to that found when 1 arcmin2 of the field remains photon limited. The longest photon-limited exposures (25–50 Ms) are in the softest bands (i.e., 2 keV). The shorter photon-limited exposures in the hard bands are largely due to the large background contribution from 4–8 keV (see column 3 in Table 8), although photon-limited exposures up to 15 Ms should be possible in the HB1 band (2–4 keV). Since 489 ( 97%) of the 503 sources are detected in either the soft band or the HB1 band, significantly deeper observations should be able to efficiently detect sources out to 4 keV. Chandra clearly cannot detect hard sources as efficiently as soft sources; however, due to the negative -correction of absorbed AGN emission, significantly longer Chandra exposures should be an effective tool in the identification of high-redshift heavily absorbed AGNs.
In Table 9 we provide predicted S/N sensitivities at the aim point for 4 and 8 Ms Chandra exposures in all of the seven X-ray bands.131313The future effects of the optical blocking filter contamination on the ACIS quantum efficiency is uncertain (see columns 7–13 of Table 3b). In our calculations here, we have assumed that ACIS has been “baked” out to remove the contaminants and restore the quantum efficiency to pre-contamination values. The soft-band limiting fluxes (down to erg cm-2 s-1) are faint enough to start individually detecting sources from the source populations statistically detected in stacking analyses (e.g., Brandt et al. 2001c; Alexander et al. 2002b; Brusa et al. 2002; Hornschemeier et al. 2002; Nandra et al. 2002). Based on the fluctuation analyses of the 1 Ms CDF-N observation, X-ray source densities up to 70,000 deg-2 are possible down to soft-band fluxes of erg cm-2 s-1 (e.g., Miyaji & Griffiths 2002). At such large source densities, the effects of source confusion upon source positional determination, source photometry, and source density must be considered.
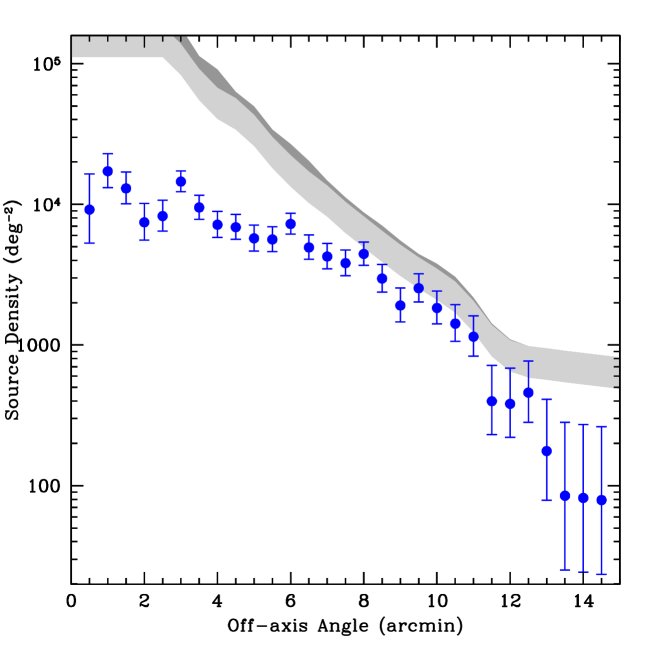
The source-confusion limit is based on the number of “beams” per source. A beam is typically taken to be a circle with a radius equal to the FWHM of the PSF (e.g., Hogg 2001). Since the shape of the HRMA PSF is complex at large off-axis angles, we conservatively assume here a “beam” as a circle with a radius equal to the 70% encircled-energy radius of the PSF. The minimum required number of beams per source is determined from the number of sources lying below the detection threshold and depends upon the slope of the number counts for these undetected sources. Based on the predicted number count slopes from the fluctuation analysis of the 1 Ms CDF-N observation (Miyaji & Griffiths 2002), the minimum required number of beams per source for source confusion is likely to be 30–50 (e.g., Hogg 2001). In Figure 21 we show the density of the detected sources versus off-axis angle and compare this to our calculated source-confusion limit. Within 6 of the aim point source confusion is unlikely to be a problem even in the most pessimistic sources-per-beam scenario; however, we may suffer source confusion at larger off-axis angles. Within 3 of the aim point, source confusion is unlikely to be present even with extremely deep observations (i.e., where source densities exceed 100,000 deg-2). These calculations do not take into account source clustering, which can also effect the determination of source properties.
A 4–8 Ms Chandra exposure can reach the flux limits being discussed for the next generation of X-ray observatories such as XEUS (not to be launched for at least 12 years).141414Details of the XEUS mission can be found at http://astro.esa.int/SA-general/Projects/XEUS/main/xeus_main.html. Although the prime scientific focus of XEUS is X-ray spectral analysis rather than X-ray imaging (e.g., Bleeker & Mendez 2003), an extremely deep Chandra survey can explore the likely source populations to be detected in deep XEUS surveys. In addition to exploring new discovery space, such a survey would also provide firm constraints on the X-ray source density while being free of source confusion. This information could prove important for the design of XEUS and the next generation of X-ray observatories.
5 Conclusions
We have presented source catalogs and basic analyses for point sources detected in the 2 Ms Chandra Deep Field-North survey down to on-axis flux limits of erg cm-2 s-1 (0.5–2.0 keV) and erg cm-2 s-1 (2–8 keV). We have provided two point-source catalogs: a main Chandra catalog of 503 X-ray sources detected with a wavdetect false-positive probability threshold of 10-7 and a supplementary optically bright Chandra catalog of 79 X-ray sources detected with a wavdetect false-positive probability threshold of 10-5 but matched to optically bright ( 23) counterparts. The X-ray colors of the sources in the main Chandra catalog imply a broad variety of source types; however, absorbed AGNs (including a small number of possible Compton-thick sources) are clearly the dominant source type. The X-ray and optical properties of the sources in the supplementary optically bright Chandra catalog are mostly consisent with those expected from starburst and normal galaxies. Due to their optical selection, these sources may not be representative of the faintest X-ray sources.
We have provided analyses of the image backgrounds and X-ray sensitivity across the field. We found that the background count distributions are very similar to Poisson distributions for all seven X-ray bands. We showed that this Chandra observation is nearly photon limited for regions close to the aim point in all of the seven X-ray bands and predicted that exposures up to 25 Ms (0.5–2.0 keV) and 4 Ms (2–8 keV) should remain nearly photon limited. We also demonstrated that this observation does not suffer from source confusion within 6 of the aim point and showed that future observations are unlikely to be source-confusion limited within 3 of the aim point even for source densities exceeding 100,000 deg-2. These analyses directly show that Chandra can achieve significantly fainter X-ray fluxes in an efficient nearly photon-limited manner and be largely free of source confusion.
Appendix A The 1 Ms Chandra Deep Field-South
The 1 Ms CDF-S observation provides the second deepest view of the Universe in the 0.5–8.0 keV band. X-ray catalogs have already been published in G02. However, the source searching and data processing procedures used to create the G02 catalogs were, in many respects, quite different from those applied to the CDF-N observations. In order to allow consistent comparisons between the CDF-N and CDF-S, we have produced catalogs for the CDF-S using the methods described in §2 and §3. We only provide details regarding the differences required for the production of the CDF-S catalogs here. The CDF-S catalogs, images, and exposure maps can be accessed from the World Wide Web site listed in Footnote 8.
A.1 Observations and Conditions
The CDF-S consists of 12 separate observations taken between 1999 Oct 14 and 2000 Dec 23. Observation 581 (1999 Oct 14) is not included in the reduction due to telemetry saturation and CCD problems; see Table A1 for the details of the 11 observations used in this analysis. The four ACIS-I CCDs and the ACIS-S CCD S2 were operated in all of the observations; however, due to its large off-axis angle, and consequently its low sensitivity, CCD S2 is not used here. The first observation was taken in Very Faint mode while the other 10 observations were taken in Faint mode; the focal-plane temperature was C for the first two observations and C for the other nine observations. The background light curves were inspected using event browser. The background was found to be high during the first observation, and 8.3 ks of exposure was removed. The total exposure time for the 11 observations is 939.4 ks; see Table A1. The observing strategy for the CDF-S observations was to keep the aim point approximately constant throughout the observations. The average aim point weighted by exposure time is 3h 32m , 48′36′′, and the individual aim points are offset by 5–30′′ from the average aim point; see Table A1. Due to the different roll angles, the total region covered by the 11 observations is 391.3 arcmin2.
A.2 Production of the Point-Source Catalogs
The main Chandra catalog and supplementary optically bright Chandra catalog were both produced following §3. The images and exposure maps were created following §3.1; the images were registered to observation 582. Point-source detection was performed following §3.2. Since the CDF-S region does not have deep published radio coverage, absolute source positions were determined by matching X-ray sources to optical counterparts, following the method given in §3.3. The optical data used to create the optical source list was the -band Wide-Field Imager (WFI) observations taken as part of the ESO Imaging Survey (Arnouts et al. 2001). The optical source list was generated using sextractor, assuming the “Best” magnitude criteria. We matched X-ray sources to point-like (FWHM 1.4, as measured by sextractor) 25 sources with a search radius. From a comparison of the X-ray and optical source positions we found a small shift in the X-ray source positions. We also found a plate-scale correction identical to that found in the CDF-N (i.e., every 12 in both RA and Dec; see §3.3). These corrections have been applied to the X-ray source positions.
The main Chandra catalog was produced following §3.4.1 and is presented as Tables A2a and A2b. The format of these tables are the same as those of Tables 3a and 3b. In total 326 independent sources are detected. In 18 cases we had to perform manual photometry, in 52 cases we had to make positional changes, and in two cases we had to separate manually a close double and determine the position of each separated source. The fluxes and photon indices have been determined taking into account the continuous ACIS quantum efficiency degradation described in columns 7–13 of Table 3b; for a 1.4 source, the soft-band and hard-band corrections are 2% and 0%, respectively.
The supplementary optically bright Chandra catalog was produced following §3.4.2 and is presented as Tables A3a and A3b. The format of these tables are the same as those of Tables 7a and 7b. A basic lower significance Chandra catalog of 363 sources was constructed. The optical data used to identify the optically bright counterparts to these Chandra sources were produced from the -band WFI observations (see above). We matched optical counterparts to the X-ray sources with a search radius of , and selected sources with a “boosted” X-ray significance of (see §3.4.2). In total 40 optically bright sources were selected; by offsetting the source coordinates in RA and Dec we estimate 5 of these matches are false. We also included two sources where the X-ray source lay – from the centroid of the optical source but was still within the extent of the optical emission. Thus, 42 sources are included in the supplementary optically bright Chandra catalog.
We determined S/N sensitivity limits following §4.2. The arcmin2 region at the aim point has 0.5–8.0 keV, 0.5–2.0 keV, and 2–8 keV sensitivity limits of erg cm-2 s-1, erg cm-2 s-1, and erg cm-2 s-1, respectively.
A.3 Comparisons of the Main CDF-S Catalogs
In this final section we compare our main Chandra catalog to the catalogs of G02. The source-searching strategy of G02 had four main differences from that employed by us: (1) they searched for X-ray sources using both wavdetect and a modified version of sextractor, (2) they only performed source searching in the 0.5–7.0 keV band (detections in the 0.5–2.0 keV and 2–10 keV bands were determined based on the signal-to-noise ratio of the 0.5–7.0 keV detected sources in those bands), (3) when searching for sources with wavdetect they used a false-positive probability threshold of , and (4) they performed additional processing of their results, removing all sources with S/N. Since we only used wavdetect for source searching, we will generally only make comparisons to the G02 wavdetect sources.
We matched the sources from both studies. G02 detected 346 independent sources: 318 with wavdetect, and 332 with sextractor. The published G02 source positions are offset from the true source positions by in RA and in Dec; see the accompanying notes with the Centre de Donnees astronomiques de Strasbourg (CDS) on-line version of the catalogs.151515The CDS World Wide Web site is at http://cdsweb.u-strasbg.fr/. We removed this offset from the G02 source positions when performing our source matching. Using a search radius we matched the X-ray sources from the main Chandra catalog to the G02 wavdetect sources, finding 284 in common; a further five sextractor-only sources were also matched. In Figure A1 we show the results of this source matching. The sources unique to the G02 wavdetect catalog tend to lie at large off-axis angles. We visually inspected all of these sources, and the majority are plausibly real. If we match the G02 wavdetect sources to both our main Chandra catalog and the lower significance Chandra catalog of 363 sources we find 308 of the wavdetect sources in common; a further 18 sextractor-only sources are also matched. These results suggest that a lower false-positive probability threshold than that adopted by us for the main Chandra catalog is probably required to identify all of the sources at large off-axis angles. By comparison, many of the sources unique to our catalog lie close to the aim point; see Figure A1. Visual inspection of these sources also suggests that the majority are real. Many of these sources are not included in the G02 catalogs because they are either detected with S/N or they are not detected in the full band (i.e., they would not have been detected in the 0.5–7.0 keV band used by G02). From these basic analyses it therefore seems that a source-searching strategy that combines our approach with that of G02 would optimize the number of detected sources.
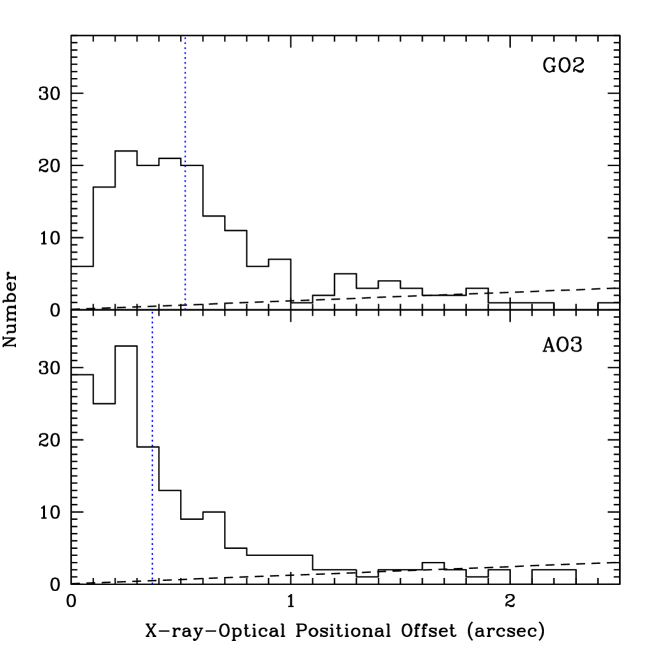
We compared the overall positional accuracy of the sources in the wavdetect catalogs. In this comparison we matched X-ray sources to sources detected in the WFI observations; we removed the offset from the G02 source positions before performing the source matching. Using a search radius, we found counterparts for 176 of the 284 wavdetect sources common to both studies. In Figure A2 we show the X-ray-optical positional offset distributions. The distribution is considerably tighter for our sources and the median positional offset is better by ( versus ); the median positional offset for the 176 sources is also if the published G02 X-ray-optical offsets are used (based on FORS1 -band observations). Our improvements in positional accuracy are mostly due to the plate-scale correction (see §3.3) and our refined source position technique (see §3.4.1).
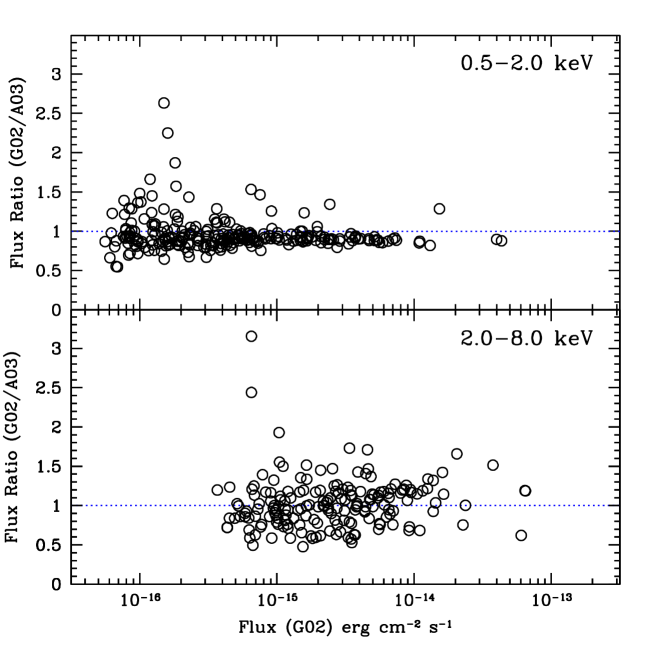
We compared the photometry between the sources in the wavdetect catalogs. G02 performed source photometry in the 0.5–2.0 keV and 2–10 keV bands. Although we did not perform source photometry in the 2–10 keV band, few source counts are detected at 8–10 keV so a comparison to our 2–8 keV band photometry is valid. In Figure A3 we show the results of the photometry comparisons. Our source photometry is systematically higher than that of G02 by 2% in the 0.5–2.0 keV band and 4% in the 2–8 keV band. Since the results of extensive simulations by G02 showed that their photometric technique underestimated the true number of counts by 4%, the agreement between the catalogs is very good. There are large disagreements (i.e., 50%) in the measured counts for a small number of faint sources (i.e., 150 counts). Visual inspection of these sources showed that they generally lay in regions where the estimation of the background is problematic (i.e., the background was high or variable due to diffuse emission, a bright nearby source, or the edge of a CCD).
We compared the fluxes between the sources in the wavdetect catalogs. The source fluxes in both studies were calculated using the measured counts, an effective exposure, and a spectral slope. In their flux determination, G02 assumed a spectral slope of 1.4 for all sources while we determined spectral slopes on a source-by-source basis (see column 6 of Table 3a). The average fluxes in the 0.5–2.0 keV and 2–8 keV bands are higher in our catalog by 9% and 18%, respectively (see Figure A4); we corrected the 2–10 keV fluxes of the G02 sources to the 2–8 keV band assuming 1.4. These small differences are mostly due to the measured counts and effective exposures for the sources. However, there is some scatter, particularly in the 2–8 keV band, due to differences in the adopted spectral slopes; see Figure A4.
References
- (1)
- (2) Alexander, D. M., Brandt, W.N., Hornschemeier, A.E., Garmire, G.P., Schneider, D.P., Bauer, F.E., & Griffiths, R.E., 2001, AJ, 122, 2156
- (3)
- (4) Alexander, D. M., Aussel, H., Bauer, F. E., Brandt, W. N., Hornschemeier, A. E., Vignali, C., Garmire, G. P., & Schneider, D. P., 2002a, ApJ, 568, L85
- (5)
- (6) Alexander, D. M., Vignali, C., Bauer, F.E., Brandt, W.N., Hornschemeier, A.E., Garmire, G.P., & Schneider, D.P., 2002b, AJ, 123, 1149
- (7)
- (8) Alexander, D. M., et al. 2003, AJ, 125, 383
- (9)
- (10) Arnouts, S. et al. 2001, A&A, 379, 740
- (11)
- (12) Baldi, A., Molendi, S., Comastri, A., Fiore, F., Matt, G., & Vignali, C. 2002, ApJ, 564, 190
- (13)
- (14) Barcons, X. et al. 2002, A&A, 382, 522
- (15)
- (16) Barger, A.J., Cowie, L.L., Bautz, M.W., Brandt, W.N., Garmire, G.P., Hornschemeier, A.E., Ivison, R.J., & Owen, F.N. 2001, AJ, 122, 2177
- (17)
- (18) Barger, A. J., et al. 2002, AJ, 124, 1839
- (19)
- (20) Barger, A. J., et al. 2003a, AJ, submitted
- (21)
- (22) Barger, A. J., et al. 2003b, ApJ, 584, L61
- (23)
- (24) Bassani, L., Dadina, M., Maiolino, R., Salvati, M., Risaliti, G., della Ceca, R., Matt, G., & Zamorani, G. 1999, ApJS, 121, 473
- (25)
- (26) Bauer, F. E., et al. 2002a, AJ, 123, 1163
- (27)
- (28) Bauer, F. E., Alexander, D. M., Brandt, W. N., Hornschemeier, A. E., Vignali, C., Garmire, G. P., & Schneider, D. P. 2002b, AJ, 124, 2351
- (29)
- (30) Bauer, F. E., et al. 2003, Advances in Space Research, submitted (astro-ph/0209415)
- (31)
- (32) Bertin, E., & Arnouts, S. 1996, A&AS, 117, 393
- (33)
- (34) Bickel, P.J. 1992, in Statistical Challenges in Modern Astronomy, eds. Feigelson, E.D., & Babu, G.J. (Springer-Verlag, New York), p. 320
- (35)
- (36) Bleeker, J., & Mendez, M. 2003, in New Visions of the X-ray Universe, in press (astro-ph/0207283)
- (37)
- (38) Boller, Th., Bertoldi, F., Dennefeld, M., & Voges, W. 1998, A&AS, 129, 87
- (39)
- (40) Brandt, W. N. et al. 2000, AJ, 119, 2349
- (41)
- (42) Brandt, W. N., et al. 2001a, AJ, 122, 2810 (B01)
- (43)
- (44) Brandt, W.N., et al. 2001b, AJ, 122, 1
- (45)
- (46) Brandt, W.N., Hornschemeier, A.E., Schneider, D.P., Alexander, D.M., Bauer, F.E., Garmire, G.P., & Vignali, C. 2001c, ApJ, 558, L5
- (47)
- (48) Brandt, W. N., Alexander, D. M., Bauer, F. E., Hornschemeier, A. E. 2002, Philos. Trans. R. Soc. London, A, 360, 2057
- (49)
- (50) Broos, P., et al. 2000, User’s Guide for the tara Package. The Pennsylvania State University, University Park
- (51)
- (52) Broos, P. S., Townsley, L. K., Getman, K., & Bauer, F. E. 2002, ACIS Extract, An ACIS Point Source Extraction Package, The Pennsylvania State University, University Park
- (53)
- (54) Brusa, M., Comastri, A., Daddi, E., Cimatti, A., Mignoli, M., & Pozzetti, L. 2002, ApJ, 581, L89
- (55)
- (56) Cagnoni, I., della Ceca, R., & Maccacaro, T. 1998, ApJ, 493, 54
- (57)
- (58) Calderwood, T., Dobrzycki, A., Jessop, H., & Harris, D. E. 2001, ASP Conf. Ser. 238: Astronomical Data Analysis Software and Systems X, 10, 443
- (59)
- (60) Campana, S., Moretti, A., Lazzati, D., & Tagliaferri, G. 2001, ApJ, 560, L19
- (61)
- (62) Cowie, L. L., Garmire, G. P., Bautz, M. W., Barger, A. J., Brandt, W. N., & Hornschemeier, A. E. 2002, ApJ, 566, L5
- (63)
- (64) Crawford, C. S., Fabian, A. C., Gandhi, P., Wilman, R. J., & Johnstone, R. M. 2001, MNRAS, 324, 427
- (65)
- (66) della Ceca, R., Castelli, G., Braito, V., Cagnoni, I., & Maccacaro, T. 1999, ApJ, 524, 674
- (67)
- (68) Dickinson, M., & Giavalisco, M. 2003, The Mass of Galaxies at Low and High Redshift. Proceedings of the ESO Workshop held in Venice, Italy, 24-26 October 2001, 324
- (69)
- (70) Eadie, W.T., Dryard, D., James, F.E., Roos, M., & Sadoulet, B. 1971, Statistical Methods in Experimental Physics. North-Holland, Amsterdam
- (71)
- (72) Ebeling, H., White, D.A., & Rangarajan, F.V.N. 2003, MNRAS, submitted
- (73)
- (74) Feigelson, E.D., Broos, P.S., & Gaffney, J. 2000, Memo on the Optimal Extraction Radius for ACIS Point Sources. The Pennsylvania State University, University Park
- (75)
- (76) Fiore, F. et al. 2000, New Astronomy, 5, 143
- (77)
- (78) Fiore, F. et al. 2001, MNRAS, 327, 771
- (79)
- (80) Freeman, P.E., Kashyap, V., Rosner, R., & Lamb, D.Q. 2002, ApJS, 138, 185
- (81)
- (82) Garmire, G. P., Bautz, M. W., Ford, P. G., Nousek, J. A., & Ricker, G. R. 2003, Proc. SPIE, 4851, 28
- (83)
- (84) Gehrels, N. 1986, ApJ, 303, 336
- (85)
- (86) Gendreau, K. C. et al. 1995, PASJ, 47, L5
- (87)
- (88) Giacconi, R. et al. 2002, ApJS, 139, 369 (G02)
- (89)
- (90) Hasinger, G., et al. 2001, A&A, 365, L45
- (91)
- (92) Hasinger, G., Bergeron, J., Mainieri, V., Rosati, P., Szokoly, G., & CDF-S Team 2002, The Messenger, 108, 11
- (93)
- (94) Hogg, D. W. 2001, AJ, 121, 1207
- (95)
- (96) Hogg, D. W., Pahre, M. A., McCarthy, J. K., Cohen, J. G., Blandford, R., Smail, I., & Soifer, B. T. 1997, MNRAS, 288, 404
- (97)
- (98) Hornschemeier, A.E., et al. 2001, ApJ, 554, 742
- (99)
- (100) Hornschemeier, A. E., Brandt, W. N., Alexander, D. M., Bauer, F. E., Garmire, G. P., Schneider, D. P., Bautz, M. W., & Chartas, G. 2002, ApJ, 568, 82
- (101)
- (102) Hornschemeier, A. E., et al. 2003, AJ, submitted
- (103)
- (104) Jansen, F., et al. 2001, A&A, 365, L1
- (105)
- (106) Jerius, D., Donnelly, R.H., Tibbetts, M.S., Edgar, R.J., Gaetz, T.J., Schwartz, D.A., Van Speybroeck, L.P., & Zhao, P. 2000, Proc. SPIE, 4012, 17
- (107)
- (108) Kim, D.-W., Fabbiano, G., & Trinchieri, G. 1992a, ApJS, 80, 645
- (109)
- (110) Kim, D.-W., Fabbiano, G., & Trinchieri, G. 1992b, ApJ, 393, 134
- (111)
- (112) Kraft, R.P., Burrows, D.N. & Nousek, J.A. 1991, ApJ, 374, 344
- (113)
- (114) Kushino, A., Ishisaki, Y., Morita, U., Yamasaki, N. Y., Ishida, M., Ohashi, T., & Ueda, Y. 2002, PASJ, 54, 327
- (115)
- (116) Lehmann, I., et al. 2001, A&A, 371, 833
- (117)
- (118) Liu, C.T., Petry, C.E., Impey, C.D., & Foltz, C.B. 1999, AJ, 118, 1912
- (119)
- (120) Lyons, L. 1991, Data Analysis for Physical Science Students. Cambridge University Press, Cambridge
- (121)
- (122) Maccacaro, T., Gioia, I.M., Wolter, A., Zamorani, G., & Stocke, J.T. 1988, ApJ, 326, 680
- (123)
- (124) Mainieri, V., Bergeron, J., Hasinger, G., Lehmann, I., Rosati, P., Schmidt, M., Szokoly, G., & Della Ceca, R. 2002, A&A, 393, 425
- (125)
- (126) Maiolino, R., Salvati, M., Bassani, L., Dadina, M., della Ceca, R., Matt, G., Risaliti, G., & Zamorani, G. 1998, A&A, 338, 781
- (127)
- (128) Manners, J. C., et al. 2003, MNRAS, submitted (astro-ph/0207622)
- (129)
- (130) Markevitch, M. 2001, CXC memo (http://asc.harvard,edu/cal/)
- (131)
- (132) Markevitch, M., et al. 2003, ApJ, 583, 70
- (133)
- (134) Marshall, F. E., Boldt, E. A., Holt, S. S., Miller, R. B., Mushotzky, R. F., Rose, L. A., Rothschild, R. E., & Serlemitsos, P. J. 1980, ApJ, 235, 4
- (135)
- (136) Mason, K. O., et al. 2000, MNRAS, 311, 456
- (137)
- (138) Matt, G., Fabian, A. C., Guainazzi, M., Iwasawa, K., Bassani, L., & Malaguti, G. 2000, MNRAS, 318, 173
- (139)
- (140) McHardy, I. M., et al. 2003, MNRAS, in press (astro-ph/0302553)
- (141)
- (142) Miyaji, T. & Griffiths, R. E. 2002, ApJ, 564, L5
- (143)
- (144) Moretti, A., Campana, S., Lazzati, D., & Tagliaferri, G. 2003, ApJ, in press (astro-ph/0301555)
- (145)
- (146) Muno, M. et al. 2003, ApJ, accepted (astro-ph/0301371)
- (147)
- (148) Mushotzky, R. F., Cowie, L.L., Barger, A.J., & Arnaud, K.A. 2000, Nature, 404, 459
- (149)
- (150) Nandra, K., Mushotzky, R. F., Arnaud, K., Steidel, C. C., Adelberger, K. L., Gardner, J. P., Teplitz, H. I., & Windhorst, R. A. 2002, ApJ, 576, 625
- (151)
- (152) Ogasaka, Y., et al. 1998, Astr Nach, 319, 43
- (153)
- (154) Piccinotti, G., Mushotzky, R. F., Boldt, E. A., Holt, S. S., Marshall, F. E., Serlemitsos, P. J., & Shafer, R. A. 1982, ApJ, 253, 485
- (155)
- (156) Ptak, A. Griffiths, R., White, N., & Ghosh, P. 2001, ApJ, 559, L91
- (157)
- (158) Ptak, A., Serlemitsos, P., Yaqoob, T., & Mushotzky, R. 1999, ApJS, 120, 179
- (159)
- (160) Ranalli, P., Comastri, A., & Setti, G. 2003, A&A, 399, 39
- (161)
- (162) Richards, E.A. 2000, ApJ, 533, 611
- (163)
- (164) Richards, E. A., Kellermann, K. I., Fomalont, E. B., Windhorst, R. A., & Partridge, R. B. 1998, AJ, 116, 1039
- (165)
- (166) Risaliti, G., Maiolino, R., & Salvati, M. 1999, ApJ, 522, 157
- (167)
- (168) Rosati, P. et al. 2002, ApJ, 566, 667
- (169)
- (170) Szokoly, G. et al. 2003, in preparation
- (171)
- (172) Stark, A.A., Gammie, C.F., Wilson, R.W., Bally, J., Linke, R.A., Heiles, C., & Hurwitz, M. 1992, ApJS, 79, 77
- (173)
- (174) Stern, D. et al. 2002, AJ, 123, 2223
- (175)
- (176) Stocke, J.T., Morris, S.L., Gioia, I.M., Maccacaro, T., Schild, R., Wolter, A., Fleming, T.A., & Henry, J.P. 1991, ApJS, 76, 813
- (177)
- (178) Townsley, L.K., Broos, P.S., Garmire, G.P., & Nousek, J.A. 2000, ApJ, 534, L139
- (179)
- (180) Townsley, L.K., Broos, P.S., Nousek, J.A., & Garmire, G.P. 2002, Nuclear Instruments and Methods in Physics Research A, 486, 751
- (181)
- (182) Tozzi, P., et al. 2001, ApJ, 562, 42
- (183)
- (184) Ueda, Y., Takahashi, T., Ishisaki, Y., Ohashi, T., & Makishima, K. 1999, ApJ, 524, L11
- (185)
- (186) Vignali, C., Alexander D.M., Bauer F.E., Brandt W.N., Hornschemeier A., Garmire G.P., & Schneider D.P. 2002a, Proceedings of the 5th Italian National Meeting, Web edition (astro-ph/0209415)
- (187)
- (188) Vignali, C., Bauer, F. E., Alexander, D. M., Brandt, W. N., Hornschemeier, A. E., Schneider, D.P., & Garmire, G.P. 2002b, ApJ, 580, L105
- (189)
- (190) Vikhlinin, A. 2001, CXC memo (http://asc.harvard,edu/cal/)
- (191)
- (192) Voges, W., et al. 1999, A&A, 349, 389
- (193)
- (194) Watson, M. G., et al. 2001, A&A, 365, L51
- (195)
- (196) Watson, M. G., et al. 2003, AN, 324, 89
- (197)
- (198) Weisskopf, M.C., Tananbaum, H.D., Van Speybroeck, L.P., & O’Dell, S.L. 2000, Proc. SPIE, 4012, 2
- (199)
- (200) Wilkes, B.J., et al. 2001, ASP Conf. Ser. 232: The New Era of Wide Field Astronomy, 47
- (201)
- (202) Williams, R.E., et al. 1996, AJ, 112, 1335
- (203)
| Obs. | Obs. | Exposure | Aim Pointb | Roll | Obs. | Pipeline | |
|---|---|---|---|---|---|---|---|
| ID | Start (UT) | Time (ks)a | Angle (∘)c | Moded | Versione | ||
| 580 | 1999 Nov 13, 01:14 | 49.4 | 12 37 16.3 | +62 12 37 | 36.6 | F | R4CU5UPD9 |
| 967 | 1999 Nov 14, 19:47 | 57.4 | 12 37 04.3 | +62 12 53 | 38.2 | F | R4CU5UPD9 |
| 966 | 1999 Nov 21, 04:03 | 57.4 | 12 37 04.3 | +62 12 55 | 39.2 | F | R4CU5UPD9 |
| 957 | 2000 Feb 23, 06:31 | 57.4 | 12 36 36.4 | +62 14 44 | 134.3 | F | R4CU5UPD12.1 |
| 2386 | 2000 Nov 20, 05:39 | 9.8 | 12 37 04.3 | +62 13 04 | 44.5 | F | R4CU5UPD11.2 |
| 1671 | 2000 Nov 21, 13:26 | 166.8 | 12 37 04.3 | +62 13 04 | 44.5 | F | R4CU5UPD13.1 |
| 2344 | 2000 Nov 24, 05:41 | 90.8 | 12 37 04.3 | +62 13 04 | 44.5 | F | R4CU5UPD12.1 |
| 2232 | 2001 Feb 19, 14:24 | 129.2 | 12 36 35.8 | +62 14 40 | 136.8 | F | R4CU5UPD14.1 |
| 2233 | 2001 Feb 22, 03:44 | 63.1 | 12 36 35.4 | +62 14 37 | 138.3 | F | R4CU5UPD14.1 |
| 2423 | 2001 Feb 23, 06:57 | 68.4 | 12 36 35.4 | +62 14 37 | 138.3 | F | R4CU5UPD14.1 |
| 2234 | 2001 Mar 02, 02:00 | 165.9 | 12 36 34.5 | +62 14 30 | 142.3 | F | R4CU5UPD14.1 |
| 2421 | 2001 Mar 04, 16:52 | 61.6 | 12 36 34.1 | +62 14 27 | 143.8 | F | R4CU5UPD14.1 |
| 3293 | 2001 Nov 13, 15:04 | 161.3 | 12 36 51.8 | +62 13 03 | 40.5 | VF | 6.4.0 |
| 3388 | 2001 Nov 16, 05:41 | 49.6 | 12 36 51.8 | +62 13 03 | 40.5 | VF | 6.4.0 |
| 3408 | 2001 Nov 17, 01:09 | 66.2 | 12 36 51.8 | +62 13 03 | 40.5 | VF | 6.4.0 |
| 3389 | 2001 Nov 21, 14:16 | 108.6 | 12 36 51.7 | +62 13 04 | 44.3 | VF | 6.4.0 |
| 3409 | 2002 Feb 12, 10:59 | 82.2 | 12 36 36.9 | +62 14 42 | 133.1 | VF | 6.6.0 |
| 3294 | 2002 Feb 14, 03:22 | 170.4 | 12 36 36.9 | +62 14 42 | 133.1 | VF | 6.6.0 |
| 3390 | 2002 Feb 16, 18:58 | 164.4 | 12 36 36.9 | +62 14 42 | 133.1 | VF | 6.6.0 |
| 3391 | 2002 Feb 22, 01:52 | 164.7 | 12 36 36.9 | +62 14 42 | 133.1 | VF | 6.6.0 |
Note. — The focal-plane temperature was C during the first three observations and C during the others.
| Energy | Standard ASCA | Restricted ACIS | |
|---|---|---|---|
| Band | (keV) | Grade Set | Grade Set |
| Full | 0.5–8.0 | ASCA grades 0, 2, 3, 4, 6 | ACIS grades 0, 2, 8, 16, 64 |
| Soft | 0.5–2.0 | ASCA grades 0, 2, 3, 4, 6 | ACIS grades 0, 64 |
| Hard | 2–8 | ASCA grades 0, 2, 3, 4, 6 | ACIS grades 0, 2, 8, 16 |
| SB1 | 0.5–1.0 | ASCA grades 0, 2, 3, 4, 6 | ACIS grades 0, 64 |
| SB2 | 1–2 | ASCA grades 0, 2, 3, 4, 6 | ACIS grades 0, 64 |
| HB1 | 2–4 | ASCA grades 0, 2, 3, 4, 6 | ACIS grades 0, 2, 8, 16 |
| HB2 | 4–8 | ASCA grades 0, 2, 3, 4, 6 | ACIS grades 0, 2, 8, 16 |
| X-ray Coordinates | Pos | Off-Axis | Counts | |||||||||
|---|---|---|---|---|---|---|---|---|---|---|---|---|
| # | Error | Angle | FB | SB | HB | SB1 | SB2 | HB1 | HB2 | Notes | ||
| (1) | (2) | (3) | (4) | (5) | (6) | (7) | (8) | (9) | (10) | (11) | (12) | (13) |
| 1 | 12 35 15.04 | +62 14 07.0 | 1.5 | 10.57 | 79.6 | 68.0 | 19.6 | 14.2b | 53.8 | 13.0 | 14.8 | M |
| 2 | 12 35 16.76 | +62 15 37.8 | 1.5 | 10.50 | 26.7 | 14.3b | 32.9 | 16.8 | 13.3b | 21.5 | 24.9 | |
| 3 | 12 35 18.82 | +62 15 51.5 | 1.4 | 10.30 | 112.8 | 68.7 | 39.5 | 19.6 | 56.0 | 26.0 | 29.9 | |
| 4 | 12 35 19.47 | +62 13 39.7 | 1.4 | 10.05 | 71.1 | 40.2 | 26.6 | 13.1 | 33.2 | 18.9 | 18.8 | |
| 5 | 12 35 21.32 | +62 16 28.1 | 0.5 | 10.15 | 596.8 | 410.0 | 169.6 | 124.8 | 286.0 | 120.9 | 46.7 | |
| 6 | 12 35 21.60 | +62 18 07.2 | 0.5 | 10.65 | 216.6 | 177.2 | 33.4 | 64.4 | 112.8 | 21.5 | 29.3 | M,R |
| 7 | 12 35 21.71 | +62 15 01.6 | 1.4 | 9.84 | 42.6bc | 23.0 | 35.0a | 13.1 | 18.9 | 19.6b | 25.2 | O,M |
| 8 | 12 35 22.30 | +62 13 53.6 | 1.4 | 9.72 | 52.0a | 39.0a | 28.4 | 15.5 | 26.5 | 18.9 | 21.3 | |
| 9 | 12 35 24.92 | +62 15 24.8 | 1.3 | 9.52 | 129.1 | 25.7 | 120.3 | 15.8 | 20.3 | 60.4 | 59.7b | |
| 10 | 12 35 28.77 | +62 14 27.8 | 0.5 | 8.98 | 251.8 | 90.6 | 164.8 | 17.9 | 76.3 | 108.9 | 54.6 | |
| 11 | 12 35 29.38 | +62 12 56.4 | 0.5 | 8.95 | 462.6 | 319.0 | 147.3 | 76.4 | 242.1 | 90.2 | 55.6a | R |
| 12 | 12 35 29.45 | +62 18 22.8 | 0.5 | 9.92 | 235.3 | 120.8 | 112.0 | 21.7 | 94.1 | 73.0 | 38.7b | |
| 13 | 12 35 35.21 | +62 14 29.1 | 0.4 | 8.23 | 386.2 | 248.1 | 127.2 | 61.8 | 186.1 | 79.3 | 46.8 | |
| 14 | 12 35 36.09 | +62 19 02.4 | 1.3 | 9.57 | 123.1 | 97.8 | 35.7 | 29.3b | 67.4 | 25.5 | 25.3 | |
| 15 | 12 35 36.14 | +62 16 46.5 | 1.2 | 8.58 | 127.0 | 129.6 | 30.1 | 84.8 | 40.2 | 18.4 | 24.4 | M |
| 16 | 12 35 37.10 | +62 17 23.6 | 0.4 | 8.70 | 512.3 | 371.6 | 121.7 | 127.2 | 239.7 | 77.4 | 42.8a | |
| 17 | 12 35 38.06 | +62 19 39.6 | 1.4 | 9.73 | 144.4 | 84.2 | 59.0bc | 20.4 | 58.6 | 33.2 | 24.6 | O,M |
| 18 | 12 35 38.08 | +62 19 32.9 | 1.3 | 9.66 | 157.6a | 54.0 | 103.8c | 13.6 | 39.8 | 64.4 | 33.9 | O,M,R |
| 19 | 12 35 38.52 | +62 16 43.2 | 0.4 | 8.30 | 20994.8 | 15233.9 | 5793.7 | 4696.3 | 10517.2 | 3933.0 | 1851.1 | HB3,R |
| 20 | 12 35 39.14 | +62 16 00.3 | 0.4 | 8.02 | 839.6 | 595.6 | 218.6 | 163.7 | 430.2 | 149.3 | 69.7 | |
| 21 | 12 35 39.47 | +62 13 11.7 | 1.0 | 7.76 | 46.8 | 39.8 | 31.3 | 16.4 | 30.2 | 18.4 | 26.0 | |
| 22 | 12 35 40.62 | +62 14 58.9 | 1.0 | 7.65 | 12.7 | 6.8 | 30.9 | 10.7 | 15.9 | 19.8 | 24.1 | |
| 23 | 12 35 42.17 | +62 19 46.0 | 1.3 | 9.41 | 124.8 | 84.3 | 38.8 | 18.5 | 71.1 | 28.7b | 29.2 | |
| 24 | 12 35 42.98 | +62 11 44.4 | 1.0 | 7.64 | 63.6 | 23.0 | 36.9b | 10.0 | 23.5 | 21.0b | 21.3 | |
| 25 | 12 35 44.79 | +62 17 35.7 | 1.1 | 7.98 | 114.6 | 45.2 | 68.6 | 15.0 | 44.6 | 41.2 | 24.0 | M |
| 26 | 12 35 45.47 | +62 18 00.7 | 1.1 | 8.11 | 71.4 | 66.2 | 24.1 | 14.8b | 51.4 | 15.6 | 18.5 | M |
| 27 | 12 35 45.90 | +62 13 51.0 | 0.9 | 6.97 | 63.4 | 29.7 | 31.2 | 14.6 | 21.6 | 20.2 | 24.8 | |
| 28 | 12 35 46.07 | +62 15 59.9 | 0.4 | 7.24 | 293.9 | 156.7 | 125.3 | 43.9 | 113.2 | 80.2 | 47.0 | |
| 29 | 12 35 46.25 | +62 17 29.8 | 1.0 | 7.78 | 173.0 | 101.6 | 71.2 | 14.6 | 99.6 | 34.0 | 38.2b | M |
| 30 | 12 35 47.53 | +62 13 52.9 | 0.9 | 6.78 | 36.6 | 22.0 | 18.7b | 10.5 | 19.4 | 19.0 | 23.9 | |
Note. — Table 3a is available in its entirety from the World Wide Web site listed in Footnote 8.
| X-ray Coordinates | Effective | Band | Effective | Flux | Band | Band | Band | ||||||||
|---|---|---|---|---|---|---|---|---|---|---|---|---|---|---|---|
| # | Exposure | Ratio1 | FB | SB | HB | SB1 | SB2 | HB1 | HB2 | Ratio2 | Ratio3 | Ratio4 | |||
| (1) | (2) | (3) | (4) | (5) | (6) | (7) | (8) | (9) | (10) | (11) | (12) | (13) | (14) | (15) | (16) |
| 1 | 12 35 15.04 | +62 14 07.0 | 165.7 | 0.31 | 1.87 | 4.41 | 2.09 | 2.59 | 0.56 | 1.39 | 1.16 | 3.57 | 0.24 | ||
| 2 | 12 35 16.76 | +62 15 37.8 | 492.8 | 2.44 | 1.40a | 0.63 | 0.14 | 1.60 | 0.23 | 0.13 | 0.70 | 2.17 | 0.83 | 1.60 | |
| 3 | 12 35 18.82 | +62 15 51.5 | 891.1 | 0.60 | 1.28 | 1.57 | 0.38 | 1.10 | 0.15 | 0.32 | 0.47 | 1.55 | 3.19 | 0.49 | |
| 4 | 12 35 19.47 | +62 13 39.7 | 417.6 | 0.69 | 1.15 | 2.26 | 0.48 | 1.62 | 0.20 | 0.35 | 0.67 | 1.98 | 2.59 | 0.56 | |
| 5 | 12 35 21.32 | +62 16 28.1 | 926.8 | 6.87 | 2.23 | 4.22 | 0.91 | 1.55 | 2.10 | 2.24 | |||||
| 6 | 12 35 21.60 | +62 18 07.2 | 675.8 | 2.48 | 1.41 | 1.00 | 0.70 | 0.87 | 0.52 | 1.84 | 0.20 | ||||
| 7 | 12 35 21.71 | +62 15 01.6 | 500.4 | 1.62 | 0.39 | 1.67 | 0.22 | 2.11 | 0.16 | 0.18 | 0.63 | 2.43 | 1.33 | 1.02 | |
| 8 | 12 35 22.30 | +62 13 53.6 | 509.6 | 0.76 | 1.06 | 1.42 | 0.37 | 1.45 | 0.19 | 0.23 | 0.55 | 1.85 | 1.76 | 0.70 | |
| 9 | 12 35 24.92 | +62 15 24.8 | 974.4 | 4.91 | -0.60 | 4.10 | 0.13 | 4.77 | 0.09 | 0.11 | 1.03 | 3.61 | 3.11 | ||
| 10 | 12 35 28.77 | +62 14 27.8 | 1121.1 | 4.70 | 0.39 | 4.58 | 0.10 | 0.34 | 1.55 | 2.45 | 4.57 | ||||
| 11 | 12 35 29.38 | +62 12 56.4 | 738.4 | 7.02 | 2.18 | 4.72 | 0.66 | 1.44 | 1.80 | 3.15 | |||||
| 12 | 12 35 29.45 | +62 18 22.8 | 899.7 | 4.05 | 0.65 | 3.36 | 0.15 | 0.54 | 1.32 | 2.08 | 4.86 | ||||
| 13 | 12 35 35.21 | +62 14 29.1 | 1409.1 | 3.22 | 0.88 | 2.16 | 0.29 | 0.63 | 0.88 | 1.44 | |||||
| 14 | 12 35 36.09 | +62 19 02.4 | 873.6 | 0.38 | 1.70 | 1.41 | 0.57 | 0.90 | 0.23 | 0.38 | 0.47 | 1.24 | 0.39 | ||
| 15 | 12 35 36.14 | +62 16 46.5 | 948.4 | 0.24 | 2.09 | 1.11 | 0.72 | 0.66 | 0.63 | 0.21 | 0.31 | 1.05 | 0.48 | ||
| 16 | 12 35 37.10 | +62 17 23.6 | 929.3 | 5.27 | 2.04 | 2.85 | 0.94 | 1.28 | 1.33 | 1.93 | |||||
| 17 | 12 35 38.06 | +62 19 39.6 | 984.3 | 2.00 | 0.42 | 1.54 | 0.13 | 0.30 | 0.54 | 1.17 | 3.22 | ||||
| 18 | 12 35 38.08 | +62 19 32.9 | 978.4 | 3.47 | 0.26 | 3.38 | 0.08 | 0.21 | 1.08 | 1.83 | 0.57 | ||||
| 19 | 12 35 38.52 | +62 16 43.2 | 961.7 | 223.39 | 80.52 | 136.02 | 33.26 | 54.87 | 65.45 | 82.33 | |||||
| 20 | 12 35 39.14 | +62 16 00.3 | 1251.6 | 6.76 | 2.43 | 3.92 | 0.88 | 1.66 | 1.87 | 2.33 | |||||
| 21 | 12 35 39.47 | +62 13 11.7 | 1521.9 | 0.81 | 1.01 | 0.44 | 0.13 | 0.53 | 0.07 | 0.09 | 0.19 | 0.76 | 1.95 | 0.62 | |
| 22 | 12 35 40.62 | +62 14 58.9 | 1442.2 | 4.69 | 1.40a | 0.10 | 0.02 | 0.51 | 0.05 | 0.05 | 0.21 | 0.72 | 1.62 | 1.28 | |
| 23 | 12 35 42.17 | +62 19 46.0 | 967.5 | 0.48 | 1.48 | 1.44 | 0.44 | 0.94 | 0.13 | 0.37 | 0.48 | 1.34 | 4.31 | 1.10 | |
| 24 | 12 35 42.98 | +62 11 44.4 | 835.3 | 1.51 | 0.13 | 1.34 | 0.07 | 0.13 | 0.38 | 1.20 | 2.39 | 1.10 | |||
| 25 | 12 35 44.79 | +62 17 35.7 | 950.4 | 2.33 | 0.23 | 2.15 | 0.10 | 0.24 | 0.70 | 1.25 | 3.33 | 0.62 | |||
| 26 | 12 35 45.47 | +62 18 00.7 | 934.9 | 0.37 | 1.71 | 0.76 | 0.36 | 0.57 | 0.11 | 0.27 | 0.27 | 0.83 | 0.32 | ||
| 27 | 12 35 45.90 | +62 13 51.0 | 1741.5 | 1.08 | 1.40a | 0.42 | 0.09 | 0.43 | 0.06 | 0.06 | 0.18 | 0.60 | 1.58 | 0.96 | |
| 28 | 12 35 46.07 | +62 15 59.9 | 1310.1 | 3.23 | 0.58 | 2.48 | 0.21 | 0.42 | 0.96 | 1.61 | |||||
| 29 | 12 35 46.25 | +62 17 29.8 | 927.8 | 2.52 | 0.54 | 1.93 | 0.10 | 0.54 | 0.58 | 1.85 | 7.60 | ||||
| 30 | 12 35 47.53 | +62 13 52.9 | 1741.4 | 0.87 | 0.94 | 0.31 | 0.06 | 0.28 | 0.04 | 0.05 | 0.17 | 0.61 | |||
Note. — Table 3b is available in its entirety from the World Wide Web site listed in Footnote 8. Band Ratio1=HB/SB; Band Ratio2=SB2/SB1; Band Ratio3=HB2/HB1; Band Ratio4=HB1/SB2.
| Number of | Detected Counts Per Source | ||||
|---|---|---|---|---|---|
| Band (keV) | Sources | Maximum | Minimum | Median | Mean |
| Full (0.5–8.0) | 479 | 20994.8 | 11.4 | 99.3 | 438.7 |
| Soft (0.5–2.0) | 451 | 15233.9 | 4.3 | 54.3 | 307.8 |
| Hard (2–8) | 332 | 5793.7 | 6.6 | 76.7 | 209.2 |
| SB1 (0.5–1.0) | 249 | 4696.3 | 4.1 | 33.8 | 161.3 |
| SB2 (1–2) | 413 | 10517.2 | 4.8 | 48.6 | 234.5 |
| HB1 (2–4) | 310 | 3933.0 | 4.1 | 49.1 | 146.7 |
| HB2 (4–8) | 183 | 1851.1 | 6.7 | 53.3 | 114.8 |
Note. — There are 503 independent X-ray sources detected in total with a false-positive probability threshold of . We have included cross-band counterparts from the wavdetect runs with a false-positive probability threshold of (see §3.4.1).
| Detection | Non-Detection Energy Band | ||||||
|---|---|---|---|---|---|---|---|
| Band (keV) | Full | Soft | Hard | SB1 | SB2 | HB1 | HB2 |
| Full (0.5–8.0) | – | 51 | 148 | 230 | 84 | 169 | 296 |
| Soft (0.5–2.0) | 23 | – | 166 | 203 | 43 | 179 | 289 |
| Hard (2–8) | 1 | 47 | – | 162 | 56 | 34 | 149 |
| SB1 (0.5–1.0) | 0 | 1 | 79 | – | 18 | 82 | 142 |
| SB2 (1–2) | 18 | 5 | 137 | 182 | – | 145 | 254 |
| HB1 (2–4) | 0 | 38 | 12 | 143 | 42 | – | 131 |
| HB2 (4–8) | 0 | 21 | 0 | 76 | 24 | 0 | – |
Note. — For example, there were 51 sources detected in the full band that were not detected in the soft band.
| X-ray Coordinates | mag | Notes | |
|---|---|---|---|
| 12 36 27.28 | +62 13 08.3 | 27.2 | Possible very weak full and hard-band emission |
| 12 36 33.86 | +62 13 27.7 | 24.5 | No evidence for X-ray emission |
| 12 37 12.66 | +62 13 42.5 | 27.5 | No evidence for X-ray emission |
| 12 37 44.53 | +62 06 41.4 | 27.3 | Possible very weak full and soft-band emission |
| 12 38 13.46 | +62 11 34.1 | 28.4 | No evidence for X-ray emission |
| X-ray Coordinates | Pos | Off-Axis | Counts | Optical Coordinates | Offset | False | |||||||||||
|---|---|---|---|---|---|---|---|---|---|---|---|---|---|---|---|---|---|
| # | Error | Angle | FB | SB | HB | SB1 | SB2 | HB1 | HB2 | mag | Prob | Notes | |||||
| (1) | (2) | (3) | (4) | (5) | (6) | (7) | (8) | (9) | (10) | (11) | (12) | (13) | (14) | (15) | (16) | (17) | (18) |
| 1 | 12 35 48.31 | +62 15 05.7 | 1.2 | 6.78 | 25.2b | 16.9b | 27.3 | 14.4 | 21.9 | 16.1 | 23.1 | 12 35 48.26 | +62 15 06.6 | 1.0 | 20.9 | 0.00270 | |
| 2 | 12 35 54.31 | +62 15 33.3 | 1.2 | 6.20 | 29.3 | 20.2 | 23.1 | 11.8 | 9.1a | 13.9 | 18.7 | 12 35 54.28 | +62 15 32.0 | 1.3 | 22.5 | 0.00902 | |
| 3 | 12 35 55.47 | +62 10 51.9 | 1.2 | 6.62 | 26.3 | 10.7b | 22.0 | 11.5 | 9.5a | 13.7 | 17.0 | 12 35 55.40 | +62 10 51.1 | 1.0 | 20.1 | 0.00150 | |
| 4 | 12 35 57.88 | +62 15 36.5 | 1.2 | 5.81 | 28.9 | 17.2b | 21.6 | 16.1 | 15.8 | 12.9 | 17.9 | 12 35 57.97 | +62 15 36.7 | 0.7 | 19.6 | 0.00104 | |
| 5 | 12 36 00.07 | +62 14 23.0 | 1.2 | 5.34 | 21.9b | 14.2 | 21.8b | 9.7 | 11.3 | 9.6b | 18.6 | 12 35 59.89 | +62 14 22.7 | 1.3 | 21.9 | 0.00606 | |
| 6 | 12 36 01.61 | +62 17 13.2 | 1.2 | 6.09 | 26.8 | 14.0b | 22.0 | 7.7 | 15.5 | 13.2 | 17.3 | 12 36 01.55 | +62 17 12.2 | 1.1 | 20.3 | 0.00166 | |
| 7 | 12 36 02.20 | +62 12 38.7 | 1.2 | 5.24 | 18.1b | 18.0 | 21.0 | 10.8 | 6.3b | 13.3 | 16.4 | 12 36 02.20 | +62 12 38.0 | 0.7 | 22.2 | 0.00730 | |
| 8 | 12 36 04.63 | +62 22 09.7 | 1.2 | 9.50 | 37.0 | 16.8b | 29.5 | 14.3 | 20.1 | 18.4 | 23.3 | 12 36 04.57 | +62 22 10.5 | 1.0 | 17.4 | 0.00019 | |
| 9 | 12 36 07.06 | +62 13 29.5 | 1.2 | 4.53 | 18.9 | 17.3 | 13.2 | 8.4a | 10.7 | 8.8 | 11.9 | 12 36 07.16 | +62 13 28.5 | 1.2 | 21.6 | 0.00479 | |
| 10 | 12 36 07.16 | +62 19 24.2 | 1.2 | 7.06 | 23.7 | 15.6 | 20.1 | 11.3 | 10.7 | 7.0a | 16.6 | 12 36 07.25 | +62 19 25.2 | 1.2 | 22.0 | 0.00629 | |
| 11 | 12 36 08.08 | +62 11 40.2 | 1.2 | 4.95 | 21.6 | 13.8 | 17.1 | 8.8 | 8.6b | 9.5 | 15.0 | 12 36 08.12 | +62 11 40.4 | 0.4 | 22.2 | 0.00723 | |
| 12 | 12 36 12.29 | +62 16 08.4 | 1.2 | 4.46 | 19.8 | 15.1 | 14.4 | 10.3 | 8.2a | 10.9 | 11.8 | 12 36 12.33 | +62 16 08.0 | 0.5 | 23.0 | 0.01400 | |
| 13 | 12 36 12.53 | +62 14 38.1 | 1.2 | 3.93 | 12.5b | 8.8b | 14.0 | 10.9 | 6.8b | 13.8 | 10.9 | 12 36 12.44 | +62 14 38.2 | 0.7 | 21.5 | 0.00446 | |
| 14 | 12 36 15.57 | +62 09 46.5 | 1.2 | 5.46 | 26.6b | 18.6 | 21.4 | 12.4 | 13.9 | 14.8 | 15.6 | 12 36 15.64 | +62 09 46.6 | 0.5 | 23.1 | 0.01490 | |
| 15 | 12 36 16.07 | +62 15 58.2 | 1.2 | 4.00 | 15.5 | 5.4b | 11.7 | 10.4 | 5.0b | 13.4 | 7.0 | 12 36 16.00 | +62 15 58.4 | 0.5 | 22.6 | 0.00972 | |
| 16 | 12 36 16.70 | +62 13 50.8 | 1.2 | 3.38 | 14.7 | 5.7b | 10.7 | 11.6 | 13.9 | 9.5 | 11.1 | 12 36 16.67 | +62 13 50.9 | 0.2 | 23.0 | 0.01410 | |
| 17 | 12 36 19.89 | +62 13 47.7 | 1.2 | 3.02 | 14.8 | 10.5b | 10.3 | 12.1 | 16.0 | 11.6 | 8.0 | 12 36 19.87 | +62 13 47.9 | 0.2 | 21.2 | 0.00350 | |
| 18 | 12 36 24.34 | +62 08 36.2 | 1.2 | 5.91 | 28.2 | 16.1a | 22.3 | 12.7 | 15.4 | 13.6 | 18.6 | 12 36 24.45 | +62 08 36.1 | 0.8 | 21.2 | 0.00337 | |
| 19 | 12 36 24.41 | +62 14 54.5 | 1.2 | 2.66 | 10.3b | 6.7b | 13.7 | 10.7 | 17.5 | 17.5 | 11.4 | 12 36 24.40 | +62 14 54.2 | 0.4 | 21.1 | 0.00320 | |
| 20 | 12 36 24.99 | +62 13 00.8 | 1.2 | 2.60 | 16.5a | 10.3 | 11.9 | 8.2 | 5.4b | 7.6 | 10.6 | 12 36 25.07 | +62 13 00.6 | 0.6 | 21.6 | 0.00450 | |
| 21 | 12 36 25.59 | +62 15 48.8 | 1.2 | 2.99 | 8.7b | 10.2 | 14.5 | 12.1 | 10.2 | 13.0 | 12.6 | 12 36 25.51 | +62 15 48.8 | 0.6 | 22.5 | 0.00918 | |
| 22 | 12 36 27.89 | +62 14 48.8 | 1.2 | 2.25 | 12.2b | 11.3 | 13.4 | 4.6b | 13.5 | 13.5 | 11.1 | 12 36 27.87 | +62 14 49.1 | 0.4 | 22.6 | 0.00988 | |
| 23 | 12 36 28.09 | +62 12 37.5 | 1.2 | 2.45 | 13.1 | 9.6 | 10.2 | 9.7 | 3.5b | 13.5 | 6.7 | 12 36 28.24 | +62 12 37.6 | 1.0 | 21.9 | 0.00573 | |
| 24 | 12 36 29.98 | +62 12 24.5 | 1.2 | 2.40 | 13.0 | 5.7a | 10.0 | 15.7 | 12.1 | 9.3 | 9.0 | 12 36 30.00 | +62 12 24.3 | 0.2 | 23.1 | 0.01440 | |
| 25 | 12 36 30.45 | +62 12 08.7 | 1.2 | 2.54 | 13.9 | 6.8a | 12.0 | 11.1 | 13.5 | 11.6 | 10.5 | 12 36 30.40 | +62 12 08.6 | 0.4 | 21.3 | 0.00360 | |
| 26 | 12 36 31.54 | +62 11 13.6 | 1.2 | 3.20 | 16.4 | 4.1b | 13.5 | 8.9 | 15.3 | 14.8 | 10.2 | 12 36 31.49 | +62 11 14.1 | 0.6 | 22.2 | 0.00735 | |
| 27 | 12 36 32.30 | +62 07 34.3 | 1.2 | 6.58 | 31.6 | 11.1b | 27.0 | 11.9 | 5.6b | 14.7 | 24.1 | 12 36 32.40 | +62 07 34.2 | 0.7 | 20.8 | 0.00257 | |
| 28 | 12 36 32.46 | +62 11 05.3 | 1.2 | 3.26 | 17.8b | 9.1b | 13.8 | 13.0 | 13.9 | 9.8 | 10.7 | 12 36 32.44 | +62 11 05.8 | 0.5 | 20.3 | 0.00174 | |
| 29 | 12 36 32.48 | +62 16 27.1 | 1.2 | 2.93 | 13.5 | 6.0b | 11.4 | 7.9 | 10.2 | 13.0 | 10.7 | 12 36 32.45 | +62 16 27.6 | 0.6 | 22.4 | 0.00848 | |
| 30 | 12 36 32.55 | +62 10 39.5 | 1.2 | 3.64 | 4.4b | 9.5 | 2.5b | 7.4 | 11.6 | 9.1 | 3.0b | 12 36 32.44 | +62 10 37.8 | 1.9 | 20.4 | – | L |
Note. — Table 7a is available in its entirety from the World Wide Web site listed in Footnote 8.
| X-ray Coordinates | Effective | Flux | ||||||||
|---|---|---|---|---|---|---|---|---|---|---|
| # | Exposure | FB | SB | HB | SB1 | SB2 | HB1 | HB2 | ||
| (1) | (2) | (3) | (4) | (5) | (6) | (7) | (8) | (9) | (10) | (11) |
| 1 | 12 35 48.31 | +62 15 05.7 | 1689.3 | 0.13 | 0.05 | 0.34 | 0.06 | 0.06 | 0.15 | 0.54 |
| 2 | 12 35 54.31 | +62 15 33.3 | 1694.9 | 0.15 | 0.06 | 0.28 | 0.05 | 0.02 | 0.13 | 0.43 |
| 3 | 12 35 55.47 | +62 10 51.9 | 1063.7 | 0.21 | 0.05 | 0.43 | 0.07 | 0.04 | 0.19 | 0.60 |
| 4 | 12 35 57.88 | +62 15 36.5 | 1739.4 | 0.14 | 0.05 | 0.26 | 0.06 | 0.04 | 0.11 | 0.40 |
| 5 | 12 36 00.07 | +62 14 23.0 | 1756.4 | 0.11 | 0.04 | 0.26 | 0.04 | 0.03 | 0.08 | 0.41 |
| 6 | 12 36 01.61 | +62 17 13.2 | 1530.7 | 0.15 | 0.05 | 0.30 | 0.03 | 0.05 | 0.13 | 0.44 |
| 7 | 12 36 02.20 | +62 12 38.7 | 1769.7 | 0.09 | 0.05 | 0.25 | 0.04 | 0.02 | 0.11 | 0.35 |
| 8 | 12 36 04.63 | +62 22 09.7 | 695.8 | 0.46 | 0.13 | 0.88 | 0.14 | 0.14 | 0.41 | 1.34 |
| 9 | 12 36 07.06 | +62 13 29.5 | 1764.3 | 0.09 | 0.05 | 0.15 | 0.03 | 0.03 | 0.08 | 0.26 |
| 10 | 12 36 07.16 | +62 19 24.2 | 1017.5 | 0.20 | 0.08 | 0.41 | 0.08 | 0.05 | 0.11 | 0.66 |
| 11 | 12 36 08.08 | +62 11 40.2 | 1685.1 | 0.11 | 0.04 | 0.21 | 0.04 | 0.02 | 0.08 | 0.34 |
| 12 | 12 36 12.29 | +62 16 08.4 | 1799.7 | 0.10 | 0.04 | 0.17 | 0.04 | 0.02 | 0.09 | 0.25 |
| 13 | 12 36 12.53 | +62 14 38.1 | 1737.8 | 0.06 | 0.03 | 0.17 | 0.04 | 0.02 | 0.12 | 0.24 |
| 14 | 12 36 15.57 | +62 09 46.5 | 1795.8 | 0.13 | 0.05 | 0.25 | 0.05 | 0.04 | 0.12 | 0.33 |
| 15 | 12 36 16.07 | +62 15 58.2 | 1856.0 | 0.07 | 0.02 | 0.13 | 0.04 | 0.01 | 0.11 | 0.14 |
| 16 | 12 36 16.70 | +62 13 50.8 | 1705.3 | 0.07 | 0.02 | 0.13 | 0.05 | 0.04 | 0.08 | 0.24 |
| 17 | 12 36 19.89 | +62 13 47.7 | 1746.9 | 0.07 | 0.03 | 0.12 | 0.05 | 0.04 | 0.10 | 0.17 |
| 18 | 12 36 24.34 | +62 08 36.2 | 1709.5 | 0.14 | 0.05 | 0.27 | 0.05 | 0.04 | 0.12 | 0.42 |
| 19 | 12 36 24.41 | +62 14 54.5 | 1906.6 | 0.05 | 0.02 | 0.15 | 0.04 | 0.04 | 0.14 | 0.22 |
| 20 | 12 36 24.99 | +62 13 00.8 | 1798.5 | 0.08 | 0.03 | 0.14 | 0.03 | 0.01 | 0.06 | 0.22 |
| 21 | 12 36 25.59 | +62 15 48.8 | 1823.9 | 0.04 | 0.03 | 0.16 | 0.05 | 0.03 | 0.11 | 0.26 |
| 22 | 12 36 27.89 | +62 14 48.8 | 1899.2 | 0.06 | 0.03 | 0.15 | 0.02 | 0.03 | 0.11 | 0.22 |
| 23 | 12 36 28.09 | +62 12 37.5 | 1775.7 | 0.06 | 0.03 | 0.12 | 0.04 | 0.01 | 0.11 | 0.14 |
| 24 | 12 36 29.98 | +62 12 24.5 | 1790.0 | 0.06 | 0.02 | 0.11 | 0.06 | 0.03 | 0.08 | 0.19 |
| 25 | 12 36 30.45 | +62 12 08.7 | 1829.2 | 0.07 | 0.02 | 0.13 | 0.04 | 0.03 | 0.09 | 0.21 |
| 26 | 12 36 31.54 | +62 11 13.6 | 1885.1 | 0.08 | 0.01 | 0.15 | 0.03 | 0.04 | 0.12 | 0.20 |
| 27 | 12 36 32.30 | +62 07 34.3 | 1759.7 | 0.16 | 0.03 | 0.32 | 0.05 | 0.01 | 0.12 | 0.53 |
| 28 | 12 36 32.46 | +62 11 05.3 | 1882.6 | 0.08 | 0.03 | 0.15 | 0.05 | 0.03 | 0.08 | 0.21 |
| 29 | 12 36 32.48 | +62 16 27.1 | 1786.2 | 0.07 | 0.02 | 0.13 | 0.03 | 0.03 | 0.11 | 0.23 |
| 30 | 12 36 32.55 | +62 10 39.5 | 1763.7 | 0.02 | 0.03 | 0.03 | 0.03 | 0.03 | 0.08 | 0.06 |
Note. — Table 7b is available in its entirety from the World Wide Web site listed in Footnote 8.
| Mean Background | Total Backgroundc | Count Ratiod | ||
|---|---|---|---|---|
| Band (keV) | (Counts pixel-1)a | (Counts Ms-1 pixel-1)b | ( counts) | (Background/Source) |
| Full (0.5–8.0) | 0.211 | 0.191 | 14.1 | 6.7 |
| Soft (0.5–2.0) | 0.062 | 0.056 | 4.1 | 2.9 |
| Hard (2–8) | 0.150 | 0.135 | 10.0 | 14.0 |
| SB1 (0.5–1.0) | 0.027 | 0.025 | 1.8 | 4.4 |
| SB2 (1–2) | 0.035 | 0.031 | 2.3 | 2.3 |
| HB1 (2–4) | 0.051 | 0.046 | 3.4 | 7.2 |
| HB2 (4–8) | 0.099 | 0.089 | 6.6 | 27.6 |
| Photon Limited | Flux Limit | ||||
|---|---|---|---|---|---|
| Band (keV) | Areaa | Exposureb | Currentc | 4 Msd | 8 Msd |
| Full (0.5–8.0) | 25 | 4 | 7.1 | 4.2 | 2.6 |
| Soft (0.5–2.0) | 83 | 25 | 2.5 | 1.3 | 0.7 |
| Hard (2–8) | 34 | 4 | 14.1 | 8.1 | 5.1 |
| SB1 (0.5–1.0) | 134 | 50 | 3.2 | 1.6 | 0.8 |
| SB2 (1–2) | 122 | 40 | 2.3 | 1.2 | 0.6 |
| HB1 (2–4) | 92 | 15 | 7.4 | 3.9 | 2.2 |
| HB2 (4–8) | 47 | 6 | 22.4 | 12.6 | 7.8 |
| Obs. | Obs. | Exposure | Aim Pointb | Roll | Obs. | Pipeline | |
|---|---|---|---|---|---|---|---|
| ID | Start (UT) | Time (ks)a | Angle (∘)c | Moded | Versione | ||
| 1431-0 | 1999 Oct 15, 17:38 | 21.1 | 3 32 29.44 | 27 48 21.8 | 47.3 | VF | R4CU5UPD9 |
| 1431-1 | 1999 Nov 23, 02:30 | 93.6 | 3 32 29.35 | 27 48 40.4 | 353.9 | F | R4CU5UPD9 |
| 441 | 2000 May 27, 01:18 | 56.0 | 3 32 26.75 | 27 48 17.4 | 166.7 | F | R4CU5UPD13.3 |
| 582 | 2000 June 03, 02:38 | 130.5 | 3 32 26.82 | 27 48 16.3 | 162.9 | F | R4CU5UPD13.3 |
| 2406 | 2000 Dec 10, 23:35 | 29.7 | 3 32 28.47 | 27 48 39.3 | 332.2 | F | R4CU5UPD12.1 |
| 2405 | 2000 Dec 11, 08:14 | 59.6 | 3 32 28.96 | 27 48 46.4 | 331.8 | F | R4CU5UPD12.1 |
| 2312 | 2000 Dec 13, 03:28 | 123.7 | 3 32 28.42 | 27 48 39.8 | 329.9 | F | R4CU5UPD13.1 |
| 1672 | 2000 Dec 16, 05:07 | 95.1 | 3 32 28.85 | 27 48 47.5 | 326.9 | F | R4CU5UPD13.2 |
| 2409 | 2000 Dec 19, 03:55 | 69.0 | 3 32 28.17 | 27 48 41.8 | 319.2 | F | R4CU5UPD13.2 |
| 2313 | 2000 Dec 21, 02:08 | 130.4 | 3 32 28.17 | 27 48 41.8 | 319.2 | F | R4CU5UPD13.2 |
| 2239 | 2000 Dec 23, 17:28 | 130.7 | 3 32 28.17 | 27 48 41.8 | 319.2 | F | R4CU5UPD13.2 |
Note. — The focal-plane temperature was C during the first two observations and C during the others.
| X-ray Coordinates | Pos | Off-Axis | Counts | |||||||||
|---|---|---|---|---|---|---|---|---|---|---|---|---|
| # | Error | Angle | FB | SB | HB | SB1 | SB2 | HB1 | HB2 | Notes | ||
| (1) | (2) | (3) | (4) | (5) | (6) | (7) | (8) | (9) | (10) | (11) | (12) | (13) |
| 1 | 3 31 44.21 | 27 49 26.1 | 1.4 | 9.76 | 76.0 | 38.1 | 32.0 | 15.1 | 22.3 | 19.4 | 25.5 | |
| 2 | 3 31 44.72 | 27 51 56.3 | 1.4 | 10.18 | 102.7 | 85.8c | 34.4 | 19.0 | 71.9 | 22.4 | 26.2 | O |
| 3 | 3 31 44.85 | 27 51 39.2 | 1.4 | 10.06 | 87.9 | 59.3 | 36.2 | 20.4 | 39.8 | 22.6 | 28.4 | |
| 4 | 3 31 47.30 | 27 53 13.3 | 0.5 | 10.15 | 485.9 | 325.5 | 158.9 | 71.7 | 253.8 | 110.3 | 47.1 | |
| 5 | 3 31 47.98 | 27 50 45.5 | 0.5 | 9.15 | 438.2 | 338.7 | 102.3 | 125.3 | 213.1 | 76.2 | 28.2 | |
| 6 | 3 31 48.02 | 27 48 01.9 | 1.2 | 8.91 | 91.2 | 76.1 | 27.4 | 21.0 | 55.0 | 19.6 | 19.1 | |
| 7 | 3 31 49.43 | 27 46 34.4 | 1.2 | 8.81 | 145.1 | 101.2 | 46.1a | 28.7 | 72.6 | 20.1 | 19.9 | |
| 8 | 3 31 49.49 | 27 50 34.0 | 1.2 | 8.78 | 79.6 | 46.2 | 25.9 | 15.2 | 44.3 | 16.7 | 24.9 | |
| 9 | 3 31 50.39 | 27 50 42.1 | 1.2 | 8.62 | 36.2 | 25.2 | 30.8 | 12.2 | 24.8 | 19.1 | 25.0 | M |
| 10 | 3 31 50.43 | 27 51 51.8 | 0.5 | 8.97 | 403.2 | 282.6 | 116.3 | 60.0 | 223.3 | 73.0 | 31.1 | |
| 11 | 3 31 50.64 | 27 53 00.9 | 1.3 | 9.40 | 99.1 | 66.2 | 33.7 | 12.9 | 52.5 | 19.0 | 28.3 | |
| 12 | 3 31 51.16 | 27 50 51.6 | 1.2 | 8.50 | 114.0 | 69.9 | 38.7 | 16.1 | 53.7 | 29.9 | 23.9 | |
| 13 | 3 31 51.47 | 27 45 54.5 | 1.2 | 8.56 | 32.0 | 32.0 | 20.1 | 15.4 | 15.3 | 11.4 | 17.0 | |
| 14 | 3 31 51.98 | 27 53 26.7 | 1.3 | 9.36 | 79.0 | 41.7 | 33.8 | 15.2 | 39.6 | 21.1 | 26.8 | |
| 15 | 3 31 52.32 | 27 47 52.7 | 1.1 | 7.97 | 125.9 | 76.4 | 45.2 | 14.9 | 61.6 | 19.4 | 22.5 | |
| 16 | 3 31 52.50 | 27 50 17.5 | 0.4 | 8.07 | 458.6 | 245.4 | 221.9 | 16.7 | 230.3 | 135.0 | 87.2 | |
| 17 | 3 31 52.53 | 27 46 42.4 | 0.4 | 8.12 | 231.1 | 157.3 | 74.1 | 39.4 | 118.2 | 55.0 | 21.7 | |
| 18 | 3 31 53.55 | 27 48 43.1 | 1.0 | 7.67 | 79.9 | 59.3 | 25.7 | 12.5 | 46.8 | 15.8 | 21.1 | |
| 19 | 3 31 53.99 | 27 47 57.7 | 1.0 | 7.60 | 22.4 | 12.7 | 23.1 | 7.7 | 18.5 | 6.6 | 18.5 | |
| 20 | 3 31 54.34 | 27 41 59.8 | 1.4 | 9.99 | 17.8 | 11.4 | 16.0 | 3.6 | 11.5 | 10.0 | 12.9 | |
| 21 | 3 31 54.57 | 27 51 03.4 | 1.1 | 7.83 | 62.4 | 26.4 | 29.0 | 11.1 | 30.3 | 18.9 | 22.4 | |
| 22 | 3 31 55.39 | 27 54 47.7 | 1.3 | 9.54 | 181.8 | 60.1 | 114.8 | 10.7 | 60.0 | 85.2 | 29.6a | |
| 23 | 3 31 55.57 | 27 50 43.3 | 1.0 | 7.52 | 65.4 | 61.3 | 23.7 | 26.4 | 34.7 | 15.1 | 18.8 | |
| 24 | 3 31 55.83 | 27 49 20.9 | 1.0 | 7.20 | 48.0 | 27.4a | 24.8 | 13.2 | 19.3 | 16.0 | 19.2 | |
| 25 | 3 31 56.88 | 27 51 01.3 | 1.0 | 7.34 | 48.9 | 24.5 | 26.7 | 15.2 | 19.2 | 14.5 | 22.9 | M |
| 26 | 3 31 57.03 | 27 51 08.6 | 1.0 | 7.35 | 90.8 | 18.9a | 70.7 | 12.3 | 16.3 | 42.7 | 25.8 | M |
| 27 | 3 31 57.71 | 27 42 08.4 | 1.3 | 9.35 | 110.1 | 75.1 | 36.7 | 27.0 | 48.2 | 18.3 | 17.0 | |
| 28 | 3 31 58.10 | 27 48 34.0 | 0.4 | 6.66 | 459.7 | 295.4 | 154.6 | 72.8 | 222.2 | 111.3 | 42.2 | |
| 29 | 3 31 58.12 | 27 44 59.4 | 1.0 | 7.58 | 45.6 | 37.7 | 23.0 | 17.9a | 20.0 | 14.3 | 18.5 | |
| 30 | 3 31 58.29 | 27 50 41.6 | 0.4 | 6.94 | 581.8 | 356.7 | 220.0 | 46.2 | 310.5 | 156.0 | 64.1 | |
Note. — Table A2a is available in its entirety from the World Wide Web site listed in Footnote 8.
| X-ray Coordinates | Effective | Band | Effective | Flux | Band | Band | Band | ||||||||
|---|---|---|---|---|---|---|---|---|---|---|---|---|---|---|---|
| # | Exposure | Ratio1 | FB | SB | HB | SB1 | SB2 | HB1 | HB2 | Ratio2 | Ratio3 | Ratio4 | |||
| (1) | (2) | (3) | (4) | (5) | (6) | (7) | (8) | (9) | (10) | (11) | (12) | (13) | (14) | (15) | (16) |
| 1 | 3 31 44.21 | 27 49 26.1 | 567.5 | 0.87 | 0.88 | 2.18 | 0.34 | 1.68 | 0.16 | 0.19 | 0.56 | 2.29 | |||
| 2 | 3 31 44.72 | 27 51 56.3 | 690.6 | 0.42 | 1.54 | 1.68 | 0.65 | 1.28 | 0.17 | 0.48 | 0.52 | 1.79 | 3.89 | 0.31 | |
| 3 | 3 31 44.85 | 27 51 39.2 | 715.4 | 0.64 | 1.16 | 1.72 | 0.42 | 1.42 | 0.17 | 0.26 | 0.51 | 1.96 | 2.00 | 0.56 | |
| 4 | 3 31 47.30 | 27 53 13.3 | 418.3 | 14.54 | 4.00 | 10.22 | 1.04 | 2.81 | 4.26 | 5.45 | |||||
| 5 | 3 31 47.98 | 27 50 45.5 | 724.5 | 5.96 | 2.46 | 3.42 | 1.09 | 1.34 | 1.68 | 1.74 | 0.41 | ||||
| 6 | 3 31 48.02 | 27 48 01.9 | 650.4 | 0.37 | 1.64 | 1.50 | 0.61 | 1.05 | 0.20 | 0.39 | 0.48 | 1.34 | 0.35 | ||
| 7 | 3 31 49.43 | 27 46 34.4 | 443.0 | 3.95 | 1.17 | 2.73 | 0.40 | 0.75 | 0.73 | 2.10 | 0.27 | ||||
| 8 | 3 31 49.49 | 27 50 34.0 | 728.1 | 1.46 | 0.32 | 0.97 | 0.13 | 0.28 | 0.37 | 1.63 | 2.98 | 1.63 | |||
| 9 | 3 31 50.39 | 27 50 42.1 | 732.0 | 1.27 | 1.40a | 0.60 | 0.18 | 1.11 | 0.10 | 0.16 | 0.42 | 1.59 | 2.08 | 0.76 | |
| 10 | 3 31 50.43 | 27 51 51.8 | 753.7 | 6.12 | 1.94 | 3.96 | 0.49 | 1.36 | 1.55 | 1.90 | 0.47 | ||||
| 11 | 3 31 50.64 | 27 53 00.9 | 786.6 | 0.53 | 1.33 | 1.60 | 0.43 | 1.15 | 0.10 | 0.31 | 0.39 | 1.71 | 0.36 | ||
| 12 | 3 31 51.16 | 27 50 51.6 | 770.3 | 1.96 | 0.46 | 1.36 | 0.13 | 0.32 | 0.62 | 1.46 | 0.87 | ||||
| 13 | 3 31 51.47 | 27 45 54.5 | 434.4 | 0.65 | 1.14 | 1.04 | 0.37 | 1.30 | 0.21 | 0.16 | 0.42 | 1.88 | |||
| 14 | 3 31 51.98 | 27 53 26.7 | 748.1 | 0.83 | 0.92 | 1.69 | 0.28 | 1.33 | 0.12 | 0.25 | 0.46 | 1.80 | 2.66 | 1.40 | |
| 15 | 3 31 52.32 | 27 47 52.7 | 792.7 | 2.17 | 0.49 | 1.57 | 0.11 | 0.36 | 0.39 | 1.34 | 0.31 | ||||
| 16 | 3 31 52.50 | 27 50 17.5 | 769.7 | 10.03 | 1.61 | 8.64 | 0.13 | 1.41 | 2.84 | 5.61 | 14.14 | ||||
| 17 | 3 31 52.53 | 27 46 42.4 | 751.0 | 3.76 | 1.08 | 2.59 | 0.32 | 0.73 | 1.17 | 1.33 | 0.43 | ||||
| 18 | 3 31 53.55 | 27 48 43.1 | 826.7 | 0.44 | 1.48 | 1.13 | 0.37 | 0.80 | 0.09 | 0.26 | 0.31 | 1.15 | 0.34 | ||
| 19 | 3 31 53.99 | 27 47 57.7 | 848.4 | 1.86 | 1.40a | 0.32 | 0.08 | 0.71 | 0.06 | 0.10 | 0.12 | 0.99 | 2.47 | 3.02 | |
| 20 | 3 31 54.34 | 27 41 59.8 | 118.1 | 1.45 | 1.40a | 1.84 | 0.50 | 3.55 | 0.19 | 0.45 | 1.35 | 5.10 | 3.23 | ||
| 21 | 3 31 54.57 | 27 51 03.4 | 846.8 | 1.13 | 1.40a | 0.90 | 0.16 | 0.90 | 0.08 | 0.17 | 0.36 | 1.21 | 2.80 | 0.62 | |
| 22 | 3 31 55.39 | 27 54 47.7 | 233.7 | 18.59 | 1.28 | 17.36 | 0.26 | 1.24 | 5.95 | 6.95 | 5.73 | ||||
| 23 | 3 31 55.57 | 27 50 43.3 | 783.2 | 0.40 | 1.58 | 0.92 | 0.41 | 0.76 | 0.21 | 0.20 | 0.31 | 1.07 | 0.43 | ||
| 24 | 3 31 55.83 | 27 49 20.9 | 833.0 | 0.93 | 1.40a | 0.70 | 0.17 | 0.78 | 0.10 | 0.11 | 0.31 | 1.04 | 1.50 | 0.83 | |
| 25 | 3 31 56.88 | 27 51 01.3 | 791.1 | 1.11 | 1.40a | 0.75 | 0.16 | 0.88 | 0.12 | 0.11 | 0.29 | 1.31 | 1.29 | 0.75 | |
| 26 | 3 31 57.03 | 27 51 08.6 | 811.1 | 3.54 | 0.12 | 3.55 | 0.08 | 0.10 | 0.87 | 1.85 | 1.36 | ||||
| 27 | 3 31 57.71 | 27 42 08.4 | 242.0 | 5.63 | 1.60 | 3.96 | 0.69 | 0.92 | 1.20 | 3.24 | 0.38 | ||||
| 28 | 3 31 58.10 | 27 48 34.0 | 848.2 | 6.94 | 1.79 | 4.83 | 0.52 | 1.22 | 2.10 | 2.26 | |||||
| 29 | 3 31 58.12 | 27 44 59.4 | 789.0 | 0.62 | 1.18 | 0.80 | 0.24 | 0.80 | 0.14 | 0.12 | 0.29 | 1.10 | 0.71 | ||
| 30 | 3 31 58.29 | 27 50 41.6 | 806.7 | 10.03 | 2.24 | 7.48 | 0.35 | 1.79 | 3.10 | 3.68 | |||||
Note. — Table A2b is available in its entirety from the World Wide Web site listed in Footnote 8. Band Ratio1=HB/SB; Band Ratio2=SB2/SB1; Band Ratio3=HB2/HB1; Band Ratio4=HB1/SB2.
| X-ray Coordinates | Pos | Off-Axis | Counts | Optical Coordinates | Offset | False | |||||||||||
|---|---|---|---|---|---|---|---|---|---|---|---|---|---|---|---|---|---|
| # | Error | Angle | FB | SB | HB | SB1 | SB2 | HB1 | HB2 | mag | Prob | Notes | |||||
| (1) | (2) | (3) | (4) | (5) | (6) | (7) | (8) | (9) | (10) | (11) | (12) | (13) | (14) | (15) | (16) | (17) | (18) |
| 1 | 3 31 59.36 | 27 46 50.8 | 1.2 | 6.62 | 22.8 | 16.6 | 19.7 | 11.0 | 13.8 | 13.1 | 15.0 | 3 31 59.31 | 27 46 51.3 | 0.8 | 22.8 | 0.01200 | |
| 2 | 3 32 10.87 | 27 47 21.9 | 1.2 | 4.03 | 5.8 | 4.1 | 12.1 | 15.7 | 13.5 | 9.3 | 10.5 | 3 32 10.91 | 27 47 22.7 | 0.9 | 20.5 | 0.00193 | |
| 3 | 3 32 12.33 | 27 49 12.1 | 1.2 | 3.56 | 8.9a | 5.1a | 10.3 | 2.8a | 9.3 | 7.9 | 8.3 | 3 32 12.38 | 27 49 12.6 | 0.9 | 22.7 | 0.01120 | |
| 4 | 3 32 12.46 | 27 47 53.6 | 1.2 | 3.56 | 5.9 | 4.3 | 11.7 | 9.7 | 10.7 | 7.9 | 9.4 | 3 32 12.52 | 27 47 53.7 | 0.7 | 22.6 | 0.00990 | |
| 5 | 3 32 15.86 | 27 47 49.9 | 1.2 | 2.84 | 5.9 | 15.1 | 13.4 | 7.5 | 3.7 | 8.6 | 9.1 | 3 32 15.90 | 27 47 50.0 | 0.6 | 22.4 | 0.00825 | |
| 6 | 3 32 16.10 | 27 49 41.1 | 1.2 | 2.89 | 8.2 | 4.3 | 9.8 | 4.6 | 13.2 | 5.8 | 10.4 | 3 32 16.15 | 27 49 41.6 | 0.9 | 21.4 | 0.00397 | |
| 7 | 3 32 16.89 | 27 52 29.8 | 1.2 | 4.62 | 14.8 | 10.0 | 12.0 | 7.4 | 3.3 | 9.5 | 10.4 | 3 32 16.91 | 27 52 31.1 | 1.4 | 22.3 | 0.00808 | |
| 8 | 3 32 17.31 | 27 49 20.2 | 1.2 | 2.52 | 11.6 | 8.1a | 10.9 | 13.8 | 10.1 | 5.8 | 10.4 | 3 32 17.40 | 27 49 20.6 | 1.2 | 20.0 | 0.00131 | |
| 9 | 3 32 18.39 | 27 45 55.4 | 1.2 | 3.45 | 9.5 | 10.8 | 14.1 | 9.7 | 6.9 | 13.5 | 12.0 | 3 32 18.44 | 27 45 55.8 | 0.8 | 22.3 | 0.00817 | |
| 10 | 3 32 19.10 | 27 44 45.6 | 1.2 | 4.35 | 15.6 | 5.0 | 13.0 | 7.9 | 0.8a | 11.2 | 10.4 | 3 32 19.17 | 27 44 46.4 | 1.1 | 20.6 | 0.00224 | |
| 11 | 3 32 20.25 | 27 56 44.4 | 1.2 | 8.32 | 30.9 | 19.4 | 26.3 | 13.8 | 5.9 | 14.3 | 22.4 | 3 32 20.21 | 27 56 45.6 | 1.2 | 20.8 | 0.00258 | |
| 12 | 3 32 21.24 | 27 44 35.9 | 1.2 | 4.30 | 16.3 | 13.8 | 12.2 | 4.2a | 13.9 | 11.2 | 9.5 | 3 32 21.28 | 27 44 35.8 | 0.5 | 20.4 | 0.00189 | |
| 13 | 3 32 21.91 | 27 54 27.2 | 1.2 | 6.01 | 21.5 | 6.9 | 15.8 | 12.5 | 13.4 | 11.0 | 12.0 | 3 32 22.01 | 27 54 28.1 | 1.6 | 19.5 | – | L |
| 14 | 3 32 23.63 | 27 53 24.2 | 1.2 | 4.90 | 16.6 | 6.4a | 12.0 | 8.6 | 10.9 | 9.1 | 10.1 | 3 32 23.68 | 27 53 24.1 | 0.6 | 21.3 | 0.00360 | |
| 15 | 3 32 24.54 | 27 48 50.8 | 1.2 | 0.85 | 14.4 | 2.8 | 9.7 | 4.6 | 11.2 | 7.9 | 8.2 | 3 32 24.61 | 27 48 51.3 | 1.0 | 21.2 | 0.00332 | |
| 16 | 3 32 25.42 | 27 46 17.4 | 1.2 | 2.40 | 11.8 | 1.8a | 10.0 | 10.6 | 11.6 | 7.2 | 9.1 | 3 32 25.42 | 27 46 17.1 | 0.3 | 22.5 | 0.00920 | |
| 17 | 3 32 25.75 | 27 44 58.5 | 1.2 | 3.68 | 14.2 | 4.7a | 10.1 | 15.7 | 2.7 | 9.3 | 10.1 | 3 32 25.77 | 27 44 59.4 | 1.0 | 23.0 | 0.01360 | |
| 18 | 3 32 26.00 | 27 53 34.5 | 1.2 | 4.99 | 16.8 | 8.3a | 13.1 | 9.6 | 9.1 | 11.2 | 10.8 | 3 32 25.96 | 27 53 34.5 | 0.6 | 21.3 | 0.00372 | |
| 19 | 3 32 27.67 | 27 50 40.7 | 1.2 | 2.07 | 9.4a | 5.6 | 11.2 | 10.6 | 3.8a | 7.2 | 8.0 | 3 32 27.71 | 27 50 40.6 | 0.6 | 22.7 | 0.01100 | |
| 20 | 3 32 29.15 | 27 47 07.6 | 1.2 | 1.50 | 14.4a | 7.2 | 12.1 | 13.8 | 10.6 | 7.2 | 11.2 | 3 32 29.20 | 27 47 07.5 | 0.7 | 22.0 | 0.00607 | |
| 21 | 3 32 29.75 | 27 45 20.3 | 1.2 | 3.29 | 15.9 | 11.3 | 4.8 | 13.2 | 15.7 | 12.6 | 10.7 | 3 32 29.85 | 27 45 20.5 | 1.4 | 22.3 | 0.00804 | |
| 22 | 3 32 30.09 | 27 53 06.6 | 1.2 | 4.52 | 18.2 | 8.4 | 14.0 | 8.9 | 11.3 | 14.8 | 11.2 | 3 32 30.16 | 27 53 05.8 | 1.2 | 21.2 | 0.00345 | |
| 23 | 3 32 31.25 | 27 53 14.1 | 1.2 | 4.67 | 11.9 | 8.6 | 10.4 | 8.6 | 6.2 | 2.4a | 11.1 | 3 32 31.30 | 27 53 15.0 | 1.2 | 22.7 | 0.01060 | |
| 24 | 3 32 31.32 | 27 57 26.1 | 1.2 | 8.85 | 34.7 | 25.6 | 25.9 | 16.9 | 11.2 | 15.5 | 21.0 | 3 32 31.41 | 27 57 26.1 | 1.2 | 21.5 | 0.00415 | |
| 25 | 3 32 32.94 | 27 50 29.8 | 1.2 | 2.16 | 8.7 | 6.4 | 8.0 | 16.8 | 12.2 | 9.1 | 5.3 | 3 32 33.00 | 27 50 29.9 | 0.7 | 21.9 | 0.00605 | |
| 26 | 3 32 33.15 | 27 49 20.6 | 1.2 | 1.31 | 7.2 | 4.6 | 8.6 | 12.2 | 6.0 | 7.2 | 7.4 | 3 32 33.21 | 27 49 20.7 | 0.8 | 22.3 | 0.00823 | |
| 27 | 3 32 34.72 | 27 50 24.4 | 1.2 | 2.30 | 8.2 | 12.6 | 9.9 | 6.0 | 2.8 | 10.6 | 11.2 | 3 32 34.80 | 27 50 24.8 | 1.1 | 22.8 | 0.01150 | |
| 28 | 3 32 35.53 | 27 49 43.7 | 1.2 | 1.97 | 10.2 | 5.4a | 10.1 | 10.6 | 10.1 | 13.2 | 9.5 | 3 32 35.61 | 27 49 43.9 | 1.1 | 21.4 | 0.00405 | |
| 29 | 3 32 39.09 | 27 48 44.6 | 1.2 | 2.41 | 9.9 | 10.0 | 7.8 | 7.5 | 3.9 | 4.6 | 9.5 | 3 32 39.16 | 27 48 44.6 | 0.9 | 19.8 | 0.00117 | |
| 30 | 3 32 39.25 | 27 42 19.2 | 1.2 | 6.75 | 23.0 | 11.0a | 16.6 | 13.8 | 12.2 | 11.0 | 13.2 | 3 32 39.26 | 27 42 19.3 | 0.2 | 22.7 | 0.01060 | |
Note. — Table A3a is available in its entirety from the World Wide Web site listed in Footnote 8.
| X-ray Coordinates | Effective | Flux | ||||||||
|---|---|---|---|---|---|---|---|---|---|---|
| # | Exposure | FB | SB | HB | SB1 | SB2 | HB1 | HB2 | ||
| (1) | (2) | (3) | (4) | (5) | (6) | (7) | (8) | (9) | (10) | (11) |
| 1 | 3 31 59.36 | 27 46 50.8 | 855.6 | 0.24 | 0.10 | 0.53 | 0.08 | 0.07 | 0.24 | 0.73 |
| 2 | 3 32 10.87 | 27 47 21.9 | 842.6 | 0.06 | 0.03 | 0.32 | 0.12 | 0.07 | 0.17 | 0.50 |
| 3 | 3 32 12.33 | 27 49 12.1 | 909.2 | 0.09 | 0.03 | 0.26 | 0.02 | 0.05 | 0.14 | 0.37 |
| 4 | 3 32 12.46 | 27 47 53.6 | 887.0 | 0.06 | 0.03 | 0.30 | 0.07 | 0.05 | 0.14 | 0.42 |
| 5 | 3 32 15.86 | 27 47 49.9 | 815.0 | 0.06 | 0.10 | 0.37 | 0.06 | 0.02 | 0.17 | 0.45 |
| 6 | 3 32 16.10 | 27 49 41.1 | 938.8 | 0.08 | 0.02 | 0.24 | 0.03 | 0.06 | 0.10 | 0.44 |
| 7 | 3 32 16.89 | 27 52 29.8 | 909.4 | 0.14 | 0.06 | 0.30 | 0.05 | 0.02 | 0.16 | 0.46 |
| 8 | 3 32 17.31 | 27 49 20.2 | 938.1 | 0.11 | 0.05 | 0.26 | 0.09 | 0.05 | 0.10 | 0.44 |
| 9 | 3 32 18.39 | 27 45 55.4 | 914.4 | 0.09 | 0.06 | 0.35 | 0.07 | 0.03 | 0.23 | 0.53 |
| 10 | 3 32 19.10 | 27 44 45.6 | 888.7 | 0.16 | 0.03 | 0.33 | 0.06 | 0.00 | 0.20 | 0.47 |
| 11 | 3 32 20.25 | 27 56 44.4 | 654.9 | 0.42 | 0.16 | 0.92 | 0.14 | 0.04 | 0.34 | 1.45 |
| 12 | 3 32 21.24 | 27 44 35.9 | 900.1 | 0.16 | 0.08 | 0.31 | 0.03 | 0.07 | 0.20 | 0.43 |
| 13 | 3 32 21.91 | 27 54 27.2 | 877.4 | 0.22 | 0.04 | 0.41 | 0.09 | 0.07 | 0.20 | 0.56 |
| 14 | 3 32 23.63 | 27 53 24.2 | 860.7 | 0.17 | 0.04 | 0.31 | 0.06 | 0.06 | 0.17 | 0.47 |
| 15 | 3 32 24.54 | 27 48 50.8 | 484.5 | 0.26 | 0.03 | 0.45 | 0.06 | 0.10 | 0.26 | 0.67 |
| 16 | 3 32 25.42 | 27 46 17.4 | 915.9 | 0.11 | 0.01 | 0.25 | 0.08 | 0.06 | 0.12 | 0.39 |
| 17 | 3 32 25.75 | 27 44 58.5 | 911.4 | 0.14 | 0.03 | 0.25 | 0.11 | 0.01 | 0.16 | 0.45 |
| 18 | 3 32 26.00 | 27 53 34.5 | 885.5 | 0.17 | 0.05 | 0.33 | 0.07 | 0.05 | 0.20 | 0.49 |
| 19 | 3 32 27.67 | 27 50 40.7 | 935.7 | 0.09 | 0.03 | 0.27 | 0.07 | 0.02 | 0.12 | 0.34 |
| 20 | 3 32 29.15 | 27 47 07.6 | 923.8 | 0.14 | 0.04 | 0.29 | 0.10 | 0.05 | 0.12 | 0.48 |
| 21 | 3 32 29.75 | 27 45 20.3 | 831.3 | 0.17 | 0.07 | 0.13 | 0.10 | 0.09 | 0.24 | 0.52 |
| 22 | 3 32 30.09 | 27 53 06.6 | 899.7 | 0.18 | 0.05 | 0.35 | 0.06 | 0.06 | 0.26 | 0.50 |
| 23 | 3 32 31.25 | 27 53 14.1 | 896.7 | 0.12 | 0.05 | 0.26 | 0.06 | 0.03 | 0.04 | 0.50 |
| 24 | 3 32 31.32 | 27 57 26.1 | 653.2 | 0.47 | 0.21 | 0.91 | 0.17 | 0.08 | 0.37 | 1.38 |
| 25 | 3 32 32.94 | 27 50 29.8 | 788.3 | 0.10 | 0.04 | 0.23 | 0.14 | 0.07 | 0.18 | 0.27 |
| 26 | 3 32 33.15 | 27 49 20.6 | 899.9 | 0.07 | 0.03 | 0.22 | 0.09 | 0.03 | 0.13 | 0.33 |
| 27 | 3 32 34.72 | 27 50 24.4 | 693.7 | 0.10 | 0.10 | 0.32 | 0.06 | 0.02 | 0.24 | 0.64 |
| 28 | 3 32 35.53 | 27 49 43.7 | 931.5 | 0.10 | 0.03 | 0.25 | 0.07 | 0.05 | 0.23 | 0.41 |
| 29 | 3 32 39.09 | 27 48 44.6 | 883.6 | 0.10 | 0.06 | 0.20 | 0.05 | 0.02 | 0.08 | 0.43 |
| 30 | 3 32 39.25 | 27 42 19.2 | 845.8 | 0.24 | 0.07 | 0.45 | 0.10 | 0.07 | 0.21 | 0.66 |
Note. — Table A3b is available in its entirety from the World Wide Web site listed in Footnote 8.