On the influence of Stark broadening on Si i lines in stellar atmospheres
We study the influence of Stark broadening and stratification effects on Si i lines in the rapidly oscillating (roAp) star 10 Aql, where the Si i 6142.48 Å and 6155.13 Å lines are asymmetrical and shifted. First we have calculated Stark broadening parameters using the semiclassical perturbation method for three Si i lines: 5950.2 Å, 6142.48 Å and 6155.13 Å. We revised the synthetic spectrum calculation code taking into account both Stark width and shift for these lines. From the comparison of our calculations with the observations we found that Stark broadening + the stratification effect can explain asymmetry of the Si i 6142.48 Å and 6155.13 Å lines in the atmospere of roAp star 10 Aql.
Key Words.:
Stars: – chemically peculiar – line profiles – atomic processes1 Introduction
The Stark broadening is the most significant pressure broadening mechanism for A and B stars and one has to take into account this effect in investigation, analysis and modeling of their atmospheres. In one of our previous works (Popović et al. 2001) we have shown that the Stark effect may change the equivalent width of spectral lines by 10-45%, hence neglecting this mechanism, we may introduce a significant errors in abundance determinations. On the other hand, high resolution spectra allow us to study different broadening effects using line profiles. In the course of the abundance analyses of peculiar (Ap) stars we noticed that some of the Si i lines are shifted relative to the laboratory wavelength. Moreover, few strong lines mainly from the multiplets and have asymmetrical line profiles, in particular the Si i 6155.13 Å line. We found that this line is slightly shifted and asymmetrical even in the solar spectrum, while in the hotter, e.g. Ap stars, the shift and asymmetry are more pronounced.
The aim of this paper is to explain the asymmetry of Si i lines within the framework of the Stark broadening effect. First we calculated the Stark broadening parameters for these lines, after that we calculated synthetic spectra and compared them with the observations, and finally, we discuss the effects causing shift and asymmetry in the line profile of the Si 6155.13 and 6142.48 Å lines.
2 Observations
For our analysis we used observations of one normal star HD 32115, two Ap stars HD 122970 and 10 Aql and Solar Flux Atlas by Kurucz et al. (1984). High resolution CCD spectra of 10 Aql and HD 122970 are described by Ryabchikova et al. (2000). High resolution CCD spectra (R45000) of HD 32115 in the wavelength region 4000–9500 Å were obtained with the coude-echell spectrometer mounted on the 2m ’Zeiss’ telescope at Peak Terskol Observatory, Russia (see Bikmaev et al. 2002 for more details).
More Ap stars show peculiar line profiles of Si i lines but most stars have rather strong magnetic fields which distort line profiles through Zeeman splitting. Rather weak magnetic fields in Ap stars HD 122970 and 10 Aql allow us to ignore magnetic effects on line shape.
3 The Stark broadening parameter calculation
Calculations have been performed within the semiclassical perturbation formalism, developed and discussed in detail in Sahal-Bréchot (1969ab). This formalism, as well as the corresponding computer code, have been optimized and updated several times (see e.g. Sahal-Bréchot, 1974; Dimitrijević and Sahal- Bréchot, 1984a, Dimitrijević, 1996).
Within this formalism, the full width of a neutral emitter isolated spectral line broadened by electron impacts can be expressed in terms of cross sections for elastic and inelastic processes as
| (1) |
and the corresponding line shift as
| (2) |
Here, is the wavelength of the line originating from the transition with the initial atomic energy level and the final level , is the velocity of light, is the electron density, is the Maxwellian velocity distribution function for electrons, is the electron mass, is the Boltzman constant, is the temperature, and denotes the impact parameter of the incoming electron. The inelastic cross section is determined according to Chapter 3 in Sahal-Bréchot (1969b), and elastic cross section according to Sahal-Bréchot (1969a). The cut-offs, included in order to maintain for the unitarity of the -matrix, are described in Section 1 of Chapter 3 in Sahal-Bréchot (1969a).
The formulae for the ion-impact broadening parameters are analogous to the formulae for electron-impact broadening. We note that the fact that the colliding ions would impact in the far wings should be checked, even for stellar densities.
4 Line profile calculations
Model atmosphere calculations as well as calculations of the absorption coefficients were made with the local thermodynamical equilibrium (LTE) approximation. Model calculations were performed with the ATLAS9 code written by R.L. Kurucz (1993). The next step is the calculation of the outward flux at corresponding wavelengths points using the given model. For this we used the STARSP program written by V.V. Tsymbal (1996). In its current state this code includes the possibility of calculating a synthetic spectrum for an atmosphere with a vertical stratification of chemical elements.
The computational scheme is as follows. For each line we find the central opacity as
| (3) |
where is the mass absorption coefficient at frequency , is the electron charge, is the statistical weight, is the oscillator strength for a given transition, is the excitation energy, is the number density of a corresponding element in a given ionization stage multiplied by partition function, is the density and is the Planck constant. The last factor describes stimulated emission.
The Doppler width is
| (4) |
In this expression is the mass of the absorber and is the microturbulent velocity.
Next, we compute the total damping parameter
| (5) |
Here , and are the radiative, Stark and damping parameters due to neutral atom collisions respectively. The values of , , excitation energy and oscillator strength were taken from the Vienna Atomic Line Database (VALD) (Kupka et al. 1999). In the case of neutral atom broadening we assumed that perturbing particles are atoms of neutral hydrogen and helium only. This assumption is applicable to almost all types of stars due to high hydrogen and helium cosmic abundances. Usually this damping process is called Van der Waals broadening. The best theory for atomic hydrogen collisions which includes not only the Van der Waals potential is given in the papers by Anstee & O’Mara (1991) and Barklem & O’Mara (1998). Barklem, Piskunov & O’Mara (2000) provided calculations for about 5000 lines of the neutral atoms and the first ions of many chemical elements. These damping parameters are included in VALD database per one perturbing particle and for a temperature of 10000 K. Unfortunately, no calculations exist for Si i lines. We shall discuss the competition between the broadenings caused by the Stark effect and neutral hydrogen collisions in the atmospheres of our stars in Section 5.2.
In order to include Stark broadening effects we added the approximate formulas (see Eqs. (14) and (15) in Sec. 5.1) in the code. The Stark width and shift are
| (6) |
| (7) |
where , and are the corresponding densities of electrons, protons and He ii ions respectively. The resulting opacity profile is given by the Voigt function (Doppler + pressure broadening).
Thus, at each point of a given spectral region (with resolution Å for both lines) we computed line absorption coefficient as follows
| (8) |
where is given by Eq. (4) and is a Voigt function with parameters
| (9) |
| (10) |
The Stark shift and the damping parameter have been found from (2) and (11), respectively.
The flux is given by the expression
| (11) |
where is the optical depth, is the source function and is the exponential integral of the order and argument . The flux integral has been evaluated using matrix operators.
5 Results
5.1 Stark broadening data
The atomic energy levels needed for Stark broadening calculations were taken from Martin and Zalubas (1983) and Moore (1971), but LS determination of , , and 7s1Po terms have been adopted according to Moore (1971) and therfore, in order to obtain a consistent set of data, energy levels from Moore (1971) have been used as the principal source. Oscillator strengths have been calculated by using the method of Bates and Damgaard (1949) and tables of Oertel and Shomo (1968). For higher levels, the method described in van Regemorter, Binh Dy and Prud’homme (1979) has been applied.
The spectrum of neutral silicon is complex and not known well enough for a good calculation of the considered lines. First of all upper and lower energy levels for 6142.48 Å and 6155.13 Å lines are not known reliably. According to Striganov & Sventickij (1966) they belong to the and multiplets respectively, while Moore et al. (1966) stated that the lower level of the corresponding transitions is . It is also worth noting that in NIST (2002) the lower and upper levels of the corresponding transitions are not specified. Consequently, we adopted the identification of Striganov & Sventitskij (1966) as the only one enabling the corresponding calculations. Moreover, the level is in fact a mixture of 39% of and 56% of states, and 5% is unknown. Also the state is a mixture of states with 3 12. In calculations, we assumed that we have 30% of state, and our checks show that the difference in final results is negligible if we assume that this state is involved up to 20% only. An additional complication was that levels, which might be very important for the perturbation of the considered 5 levels, are unknown. In accordance with the decrease of distance between and levels, we estimated that the distance from 5 or 5 term to the 5 levels should lie between 500 and 1500 cm-1. We checked results without 5 levels and with a fictive 5 level at 500, 1000 and 1500 cm-1 from the corresponding 5 terms. In all cases, line widths differed by less than 1%, while the shift varies within the limits of 3.5%. If the distance is 500 cm-1, the shift value e.g. at 10000 K for 6142.48 Å line differs by about 20%. If we include a fictive 6 level 500 cm-1 distant from 5 levels, the difference is negligible. Hence, in order to obtain the needed set of atomic energy levels, we adopted a fictive 5 level 1000 cm-1 distant from the 5 levels and a fictive 6 level 500 cm-1 distant from the 5 level. Since the average estimated error of the semiclassical method is 30%, due to additional approximations and uncertainties, we estimate the error bars of our results to be 50%.
Our results for electron-, proton-, and ionized helium-impact line widths and shifts for the three considered Si i spectral lines for a perturber density of 1014 cm-3 and temperatures T 2,500 50,000 K, are shown in Table 1. For perturber densities lower than those tabulated here, Stark broadening parameters vary linearly with perturber density. The nonlinear behaviour of Stark broadening parameters at higher densities is the consequence of the influence of Debye shielding and has been analyzed in detail in Dimitrijević and Sahal-Bréchot (1984b).
| PERTURBERS ARE: | ELECTRONS | PROTONS | HELIUM IONS | ||||
|---|---|---|---|---|---|---|---|
| TRANSITION | T(K) | FWHM(A) | SHIFT(A) | FWHM(A) | SHIFT(A) | FWHM(A) | SHIFT(A) |
| SiI | 2500. | 0.509E-02 | 0.333E-02 | 0.160E-02 | 0.701E-03 | ||
| 5000. | 0.581E-02 | 0.409E-02 | 0.172E-02 | 0.898E-03 | |||
| 5948.55 A | 10000. | 0.652E-02 | 0.381E-02 | 0.183E-02 | 0.109E-02 | 0.167E-02 | 0.851E-03 |
| C= 0.36E+19 | 20000. | 0.740E-02 | 0.328E-02 | 0.194E-02 | 0.127E-02 | 0.175E-02 | 0.101E-02 |
| 30000. | 0.811E-02 | 0.271E-02 | 0.202E-02 | 0.139E-02 | 0.181E-02 | 0.111E-02 | |
| 50000. | 0.903E-02 | 0.212E-02 | 0.213E-02 | 0.153E-02 | 0.188E-02 | 0.123E-02 | |
| SiI | 2500. | 0.967E-01 | -0.576E-01 | 0.175E-01 | -0.145E-01 | *0.145E-01 | -0.114E-01 |
| 5000. | 0.108 | -0.624E-01 | 0.196E-01 | -0.168E-01 | 0.160E-01 | -0.134E-01 | |
| 6142.48 Å | 10000. | 0.120 | -0.609E-01 | 0.219E-01 | -0.192E-01 | 0.178E-01 | -0.154E-01 |
| C= 0.52E+16 | 20000. | 0.132 | -0.472E-01 | 0.247E-01 | -0.219E-01 | 0.198E-01 | -0.176E-01 |
| 30000. | 0.140 | -0.400E-01 | 0.266E-01 | -0.235E-01 | 0.211E-01 | -0.189E-01 | |
| 50000. | 0.147 | -0.326E-01 | 0.294E-01 | -0.258E-01 | 0.228E-01 | -0.208E-01 | |
| SiI | 2500. | 0.905E-01 | -0.622E-01 | 0.184E-01 | -0.152E-01 | *0.151E-01 | -0.120E-01 |
| 5000. | 0.102 | -0.707E-01 | 0.204E-01 | -0.177E-01 | 0.168E-01 | -0.141E-01 | |
| 6155.13 Å | 10000. | 0.112 | -0.706E-01 | 0.228E-01 | -0.203E-01 | 0.187E-01 | -0.162E-01 |
| C= 0.20E+17 | 20000. | 0.121 | -0.571E-01 | 0.255E-01 | -0.231E-01 | 0.208E-01 | -0.185E-01 |
| 30000. | 0.129 | -0.482E-01 | 0.273E-01 | -0.248E-01 | 0.221E-01 | -0.200E-01 | |
| 50000. | 0.137 | -0.392E-01 | 0.298E-01 | -0.272E-01 | 0.240E-01 | -0.219E-01 | |
In Table 1 the Stark widths and shifts for elect-ron-, proton- and He ii ion-impact broadening are presented as a function of temperature for a density of 1014 cm-3. After testing the density dependence of Stark parameters, we have found that the width and shift are linear functions of density for perturber densities smaller than 10 and can be scaled by the simple formula:
| (12) |
where are the width and shift at a perturber density (), and are width and shift given in Table 1, respectively.


In order to simplify the use of Stark broadening data in the codes for stellar spectral synthesis, we have found an analytical expression for Stark widths and shifts
| (13) |
| (14) |
The constants , and are given in Table 2. We take as . The fits of our calculated data to the analytical functions given above are satisfactory (Fig. 1) and the differences are smaller than the expected error of our calculations (50%)
| Line | 5950.2 Å | 6142.48 Å | 6155.13 Å |
| WIDTH | |||
| electrons | |||
| 1E-16 | 1E-14 | 1E-14 | |
| A | -0.33801648 | -0.87997007 | -0.88824105 |
| B | 0.12759724 | 0.01704956 | 0.01525209 |
| protons | |||
| 1E-16 | 1E-15 | 1E-15 | |
| A | -0.81663954 | -0.77664655 | -0.76856840 |
| B | 0.01728187 | 0.03913901 | 0.03758103 |
| He ii | |||
| 1E-16 | 1E-15 | 1E-15 | |
| A | -0.83337682 | -0.81987023 | -0.81114334 |
| B | 0.01297813 | 0.02771659 | 0.02946282 |
| SHIFT | |||
| electrons | |||
| 1E-16 | 1E-15 | 1E-15 | |
| A | 0.38028502 | -0.63997507 | -0.69208568 |
| B | 1.33496618 | 0.88440353 | 1.18033516 |
| C | -0.02047206 | 0.07950743 | 0.04721782 |
| protons | |||
| 1E-16 | 1E-15 | 1E-15 | |
| A | -1.32564473 | 1.12387002 | 0.17032257 |
| B | 0.01917066 | 0.02838789 | 0.10512289 |
| C | 1.43394434 | -1.31786299 | -0.37318012 |
| He ii | |||
| 1E-16 | 1E-15 | 1E-15 | |
| A | -1.67370868 | 0.14785217 | 0.14840180 |
| B | 0.01490401 | 0.10161093 | 0.10439166 |
| C | 1.75773489 | -0.30183339 | -0.31051296 |
5.2 The Stark broadening effect on the shape of Si i lines
The asymmetry and shift of Si i 6142.48 Å and (in particular) 6155.13 Å lines were observed, and it was obvious that the asymmetry is higher for the hotter stars. The most asymmetrical are 6142.48 Å and 6155.13 Å, the strongest lines of and multiplets, respectively. This line is slightly shifted and shows an asymmetry in the red wing even in a rather cool star like the Sun. It is not surprising if the Stark effect is responsible for the observed shifts and asymmetries. From Table 1 one can see that neither widths nor shifts have a strong temperature dependence, but they depend linearly on the perturber density. If a line is strong enough so that line core and line wings are formed at different atmospheric layers where electron density, differs significantly, then we should observe line asymmetry due to differnt shifts at different atmospheric layers even with a homogeneous vertical distribution of the absorbing element in stellar atmosphere (the case of the observed asymmetries in normal stars). Vertical abundance stratification makes this effect more pronounced, and it is observed in cool Ap stars, where an element stratification takes place (Savanov et al. 2001, Ryabchikova et al. 2002, Wade et al. 2001).
Table 3 summarizes the model atmosphere parameters and rotational velocities for the stars of our sample. These data are taken from Ryabchikova et al. (2000) and Bikmaev et al. (2002). For the Sun corresponding parameters were taken from Valenti & Piskunov (1996) except . Si abundances used in the present calculations are given in the last column.
| Star name | |||||
|---|---|---|---|---|---|
| or HD | km s-1 | km s-1 | |||
| Sun | 5777 | 4.44 | 0.75 | 1.6 | -4.49 |
| HD 122970 | 6930 | 4.11 | 0.85 | 5.0 | -4.45 |
| HD 32115 | 7250 | 4.20 | 2.30 | 9.0 | -4.65 |
| 10 Aql | 7550 | 4.00 | 0.00 | 5.0 | strat |
In the Sun the most important broadening is due to collisions with neutral hydrogen and helium. In the hotter stars the importance of the Stark broadening increases. P. Barklem (private communication) has provided us with the value of the broadening parameter due to collisions with atomic hydrogen for the Si i lines of our interest. This value per perturbing particle for a temperature 10000 K, =-6.63, is by 0.4 dex higher than the corresponding value obtained from the Unsöld (1955) approximation. According to P. Barklem his value may be overestimated by 0.1 dex which is proved by a comparison between the calculated and the observed blue wing of the solar Si i lines. The final value used in our calculations is =-6.75. As for the shift due to collisions with the atomic hydrogen, a corresponding theory is not well developped, and the value of the shift is rather uncertain (P. Barklem, private communication). The core and the wings of the strongest Si i 6155 line are formed in the layers with the temperatures 5000 and 5800 K respectively. In these layers the corresponding values for electron-, proton- and atomic hydrogen densities are 4.2 1012 cm-3, 1.5 1011 cm-3, 3.9 1016 cm-3 – line core, and 2.5 1013 cm-3, 9.3 1012 cm-3, 1.0 1017 cm-3 – line wings. The Stark width is 20 times smaller than at the depth of line core formation and 10 times smaller than at the depth of line wing formation. In the solar atmosphere, the Stark shift is 3 mÅ at the line core and about 20 mÅ for the line wings, which is not negligible. In the atmosphere of the hottest star of our sample, 10 Aql, the Stark width is of the order of at the depth of line core formation and exceeds by 5 times at the depth of line wing formation. Stark shifts are 10 and 100 mÅ, respectively. In 10 Aql the line core is formed at the layers with =6500 K, =1.4 1013 cm-3, =1.3 1013 cm-3, =5.9 1015 cm-3 while line wings are formed at the layers with =7500 K, =1.2 1014 cm-3, =1.2 1013 cm-3, =1.1 1016 cm-3.
5.3 The Sun
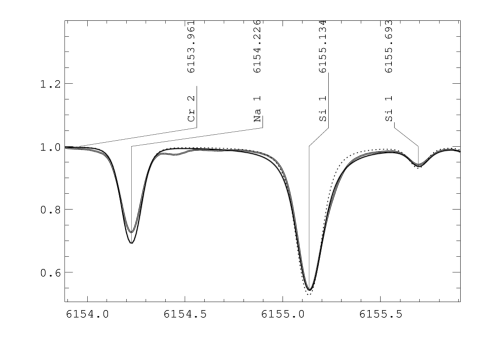
We first calculated Si i lines in the solar spectrum to check the Stark parameters. It was mentioned by Ryabchikova et al. (2002) that available theoretical oscillator strengths for the multiplets and are overestimated by about 0.5 dex compared to the multiplet ( 5948.55 Å). The authors fitted the lines of and multiplets using the solar spectrum. Corrected oscillator strengths – =-1.42 ( 6142.48Å) and =-0.77 ( 6155.13Å) were published in Bikmaev et al. (2002). The latter value was reduced to =-0.82 to get a better fit for the solar Si i 6155 line. We also reduced the oscillator strength (=-2.25) of very weak Si line of the same multiplet, 6155.69Å. We need to decrease both Stark widths and shifts for Si i 6142 and 6155 Å lines by 40% to get a reasonable fit of the synthetic line profiles to the solar ones. Due to relative weakness of the Si i 6142 Å line Stark effect is negligible but it is noticeable for the stronger line Si i 6155 Å. Fig. 2 shows a comparison between the observed profile of the Si i 6155 Å line in the solar spectrum and synthetic profiles calculated with (solid line ) and without (dashed line) taking into account the Stark width and in particular, shift. The strongest Si i 5948.55 Å line in our study is fully symmetric as expected taking into account an order of magnitude smaller values for both the Stark width and shift (see Table 1).
With corrected Stark parameters we calculated Si i line profiles in spectra of other stars.
5.4 HD 32115
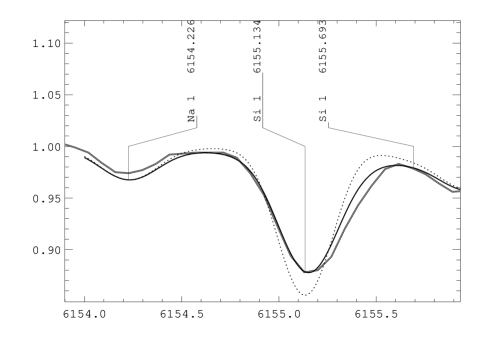
Spectra of this normal late A-type star have the smallest spectral resolution of our sample. As it may be seen from Fig. 3 the fit of the synthetic line profile of 6155.13 Å line to the observed one is much better when it was calculated with both Stark width and shift. As in the solar case, the Stark effect is negligible for the weaker Si i 6142.48 Å line. To get a better fit of the line profiles we decrease the Si abundance by 0.13 dex compared to the results published by Bikmaev et al. (2002) which were based mainly on the equivalent width measurements.
5.5 HD 122970
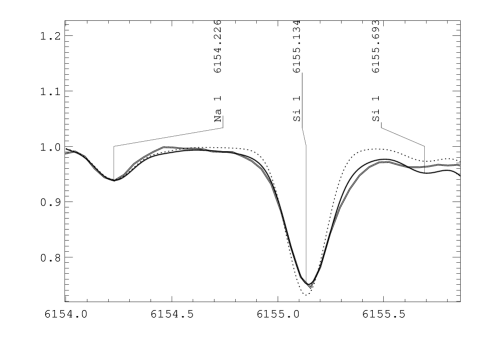
This is one of the coolest Ap stars and is expected to have a chemically stratified atmosphere. Results of the abundance determinations show that except for the rare-earth elements (REE) abundance stratification is marginal if it exists at all (Ryabchikova et al. 2000). Spectral synthesis of Si i lines seems to support this conclusion. We could reproduce the asymmetric and shifted line profile of Si i 6155.13 Å reasonably well, using the uniform distribution of Si and Stark broadening parameters presented here. Fig. 4 shows a comparison between the observed and computed line profiles for two cases similar to Fig. 3. The best fit of Si i line profiles was obtained with the same Si abundance as was derived by Ryabchikova et al. (2000).
5.6 10 Aql
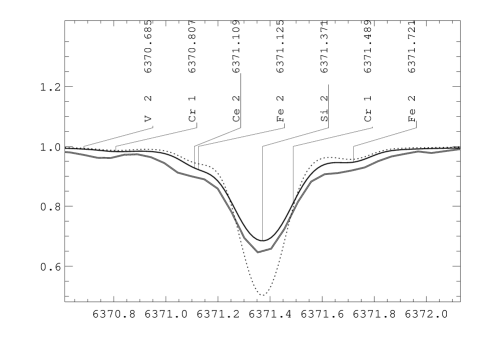
10 Aql= HD 176232 is the hottest star in our sample. It has the most asymmetrical Si i 6155.13 Å line profile, which could not be reproduced by any combination of Stark parameters in a homogeneous atmosphere (Fig. 5). The even weaker line, Si i 6142.48 Å shows a noticeable line shift (Fig. 6). Ryabchikova et al. (2000) mentioned a possibility of Fe and the REE stratification in 10 Aql. Therefore we tried to find a simple distribution of Si in the atmosphere of 10 Aql by trial-and-error which would fit both Si i 6142.48 Å and 6155.13 Å lines. The simplest distribution shown in Fig. 7 gives a reasonable fit to the observed profiles of both Si i lines (Figs. 5 and 6). Moreover, the same Si distribution seems to fit much better the profiles of the strong Si ii 6347, 6371 Å spectral lines compared to the calculations with the homogeneous Si abundance (-4.19) obtained by Ryabchikova et al. (2000). It is beyond the scope of the present paper to derive an exact Si abundance profile in the atmosphere of 10 Aql. We would like to stress here that with the present Stark parameters a sensitivity of 6155.13 Å line asymmetry to Si abundance changes in the stellar atmosphere can be successfully used in empirical studies of abundance stratification in the atmospheres of cool Ap stars.
6 Conclusions
In order to discuss the contribution of the Stark broadening effect to the asymmetry and the shift of Si i 6142.48 Å and 6155.13 Å lines we have calculated Stark broadening parameters for these lines by using the semiclasical perturbation method. The obtained results are the first calculated data for the considered lines. In order to include Stark broadening data we have changed the STARSP code and we have synthesized the considered lines. From our analyzis we can conclude that:
1) The Stark broadening effect is very important for these two lines. The contribution of electron impact is dominant but, impacts with protons and He ii ions should be taken into accout as well.
2) The asymmetry as well as the shift of the Si i 6142.48 Å and 6155.13 Å lines in many stars including the Sun can be explained by the Stark broadening effect.
3) In hotter Ap stars, besides the Stark broadening effect, the stratification plays a very important role in producing line asymmetry. The sensitivity of the line asymmetry to changes in the number of Si atoms through the stellar atmosphere can be used in abundance distribution studies.
Acknowledgements.
We are very grateful to Paul Barklem who provided us with the unpublished calculations of damping constants for Si i lines due to collisions with the atomic hydrogen. This work is a part of the projects “Influence of collisional processes on astrophysical plasma lineshapes” and “Astrophysical Spectroscopy of Extragalactic Objects” supported by the Ministry of Science, Technologies and Development of Serbia. The research was supported also by the Fonds zur Förderung der wissenschaftlichen Forschung P14984 and Os̈terreichische Nationalbank (Jubilaäumsfonds Nr. 7650). TR also thanks Russian Federal program “Astronomy” and the RFBR (grant 00-15-96722) for partial funding.References
- (1) Anstee, S.D., & O’Mara, B.J. 1991. MNRAS, 253, 549
- (2) Barklem, P.S., & O’Mara, B.J. 1998, MNRAS, 300, 863,
- (3) Barklem, P.S., Piskunov, N., & O’Mara, B.J. 2000, A&AS, 142, 467
- (4) Bates, D. R., & Damgaard, A. 1949, Trans.Roy.Soc. London, Ser. A, 242, 101
- (5) Bikmaev I.F., Ryabchikova T.A., Bruntt H., Musaev F.A., Mashonkina L.I., Belyakova E.V., Shimansky V.V., Barklem P.S., & Galazutdinov G. 2002, A&A, 389, 537
- (6) Dimitrijević, M. S. 1996, Zh. Priklad. Spektrosk., 63, 810
- (7) Dimitrijević, M. S., & Sahal-Bréchot, S. 1984a, JQSRT, 31, 301
- (8) Dimitrijević, M. S., & Sahal-Bréchot, S. 1984b, A&A, 136, 289
- (9) Griem, H. R. 1974, Spectral Line Broadening by Plasmas, Academic Press, New York
- (10) Kupka, F., Piskunov, N.E., Ryabchikova, T.A., Stempels, H.C., & Weiss, W.W. 1999, A&AS, 138, 119
- (11) Kurucz, R.L. 1993, CDROM13, SAO, Cambridge
- (12) Kurucz R.L., Furenlid I., Brault J., & Testerman L. 1984, NSO Atlas No. 1: Solar Flux Atlas from 296 to 1300 nm, Sunspot, NSO.
- (13) Martin, W. C., & Zalubas, R. 1983, J. Phys. Chem. Ref. Data, 12, 323
- (14) Moore, C. E. 1971, Atomic Energy Levels Vol. I, NSRDS-NBS 35, U.S. Gov. Print. Office, Washington
- (15) Moore, C. E., Minnaert, M. G. J., Houtgast, J. 1966, The Solar Spectrum 2935 Å to 8770 Å, Second Revision of Rowland’s Preliminary Table of Solar Spectrum Wavelengths,NBS Monograph 61, U.S. Gov. Print. Office, Washington
- (16) NIST, 2002, Atomic Spectra Data Base, Lines, http://physics.nist.gov
- (17) Oertel, G. K., & Shomo, L. P. 1968, ApJS, 16, 175
- (18) Popović, L.C., Simić S., Milovanović N., & Dimitrijević M. 2001, ApJS, 135, 109.
- (19) Ryabchikova, T., Piskunov, N., Kochukhov, O., Tsymbal, V., Mittermayer, P., & Weiss, W. W. 2002, A&A, 384, 545
- (20) Ryabchikova T.A., Savanov I.S., Hatzes A.P., Weiss W.W., & Handler G. 2000, A&A, 357, 981.
- (21) Sahal – Bréchot, S. 1969a, A&A, 1, 91
- (22) Sahal – Bréchot, S. 1969b, A&A, 2, 322
- (23) Sahal – Bréchot, S. 1974, A&A, 35, 321
- (24) Savanov, I.S., Kochukhov, O.P., Tsymbal, V.V. 2001, Ap, 44, 206
- (25) Striganov, A. R., Sventickij, N. S. 1966, Tablicy Spektral’nykh Linij Nejtral’nykh i Ionizovannykh Atomov, Atomizdat, Moskva
- (26) Tsymbal, V.V. 1996, in Model Atmospheres and Spectral Synthesis, ed. S.J. Adelman, F. Kupka & W.W. Weiss, ASP Conf. Ser., 108, 198
- (27) Unsöld, A. 1955, Physik der Stern Atmosphären (Zweite Auflage), Springer-Verlag
- (28) Valenti, J. A., & Piskunov, N. 1996, A&AS, 118, 595
- (29) van Regemorter, H., Hoang Binh Dy, & Prud’homme, M. 1979, J. Phys. B, 12, 1073
- (30) Wade, G. A., Ryabchikova, T. A., Bagnulo, S., & Piskunov, N. 2001, in Magnetic Fields Across the Hertzsprung-Russell Diagram, ed. G. Mathys, S. K. Solanki, & D. T. Wickramasinghe, ASP Conf. Ser., 248, 373