Variable stars in the globular cluster NGC 3201. I. Multimode SX Phe-type variables
Abstract
We report on the discovery of eleven multimode SX Phoenicis–type blue stragglers in the field of the southern globular cluster NGC 3201. In these variables both radial and non-radial modes are excited. For three variables the derived period ratio is close to that observed in SX Phoenicis itself, suggesting that these stars are pulsating in the fundamental and the first-overtone radial modes. Using the McNamara (1997) period-luminosity relation we have estimated the apparent distance modulus to NGC 3201 to be 14.08mag.
keywords:
stars:variables:other – globular clusters: individual: NGC 32011 Introduction
Variable stars in star clusters have long been recognized as unique laboratories that allow the study of both the properties of the variables and the stellar systems they belong to. One of the most important applications is the use of the variables to determine the distance to the parent system. Interest in SX Phoenicis variables as precise distance indicators has grown in the last few years with the publication of results of the Hipparcos mission (ESA 1997). McNamara (1997) used a semiempirical approach to determine the period-luminosity (P-L) relation for high-amplitude Scuti (HADS) stars; the zero point of this relation was set with the aid of Hipparcos parallaxes. Petersen & Høg (1998) derived a P-L relation for HADS which was based on Hipparcos parallaxes of six variables, including SX Phoenicis itself. Both relations yield distances with an uncertainty of mag. Theoretical calculations imply that the inclusion of colour and metallicity terms can significantly decrease the intrinsic scatter of this relation (Petersen & Christensen-Dalsgaard 1999, Santolamazza et al. 2001). Thus SX Phoenicis stars can provide a valuable cross-check for the distance determined with other methods, e.g. with other types of variable stars: detached eclipsing binaries (Paczynski 1997), W UMa-type systems (Rucinski & Duerbeck 1997) and RR Lyraes.
In 1989 we started at Las Campanas Observatory a CCD survey for short-period variables in southern star clusters. The sample contained open clusters (e.g. Cr261 – Mazur, Krzemiński & Kaluzny 1995, NGC 2243 – Kaluzny, Krzemiński & Mazur 1996, Berkeley 39 – Mazur, Krzemiński & Kaluzny 1999a) and globular clusters (e.g. NGC 6362 – Mazur, Kaluzny & Krzemiński 1999b and references therein). The results of the survey have shown that CCD photometry can be an effective method of detection of pulsating stars and short-period binaries, even those with periods of a few days. However an extended data set is a must to detect such binaries. In a continuation of this survey we embarked in January 1993 on an extended CCD study of the globular cluster NGC 3201. Our goal was to obtain as complete a census of variable stars as possible, with the aim of using observations of the variables to derive the distance modulus to the cluster.
NGC 3201 (), is a nearby cluster of low central concentration, and has been the subject of numerous photometric and spectroscopic studies. Historically, the first papers were devoted to variable stars (Woods 1919, Bailey 1922, Dowse 1940, Wright 1941, Wilkens 1965, Cacciari 1984, Samus et al. 1996). Photographic CMDs were published by Alcaino (1976), Lee (1977) and Alcaino & Liller (1981), and CMD’s based on CCD photometry by Penny (1984), Alcaino, Liller & Alvarado (1989), Brewer et al. (1993), Covino & Ortolani (1997), Rosenberg et al. (2000), and von Braun & Mateo (2002). Cote at al. (1994) presented radial velocities of a sample of the cluster giants, they also used these multiple velocity measurements to search for binaries.
The metal abundance of NGC 3201 falls in the intermediate range, however the exact value is still not well established. Zinn & West (1984) derived [Fe/H]=–1.61 and Carretta & Gratton (1997) obtained [Fe/H]=–1.23 from an analysis of echelle spectra of 3 cluster giants. Gonzalez & Wallerstein (1998) found a mean value of [Fe/H]=–1.42 from the echelle spectra of 18 giants.
The Catalogue of Variable Stars in Globular Clusters (Clement et al. 2001) lists 100 entries for NGC 3201, 8 of them with the notation ”not var”. Of the 92 variables, 77 are RR Lyrae stars. Recently, von Braun & Mateo (2002), reported the discovery of 14 short-period variables, mainly eclipsing binaries, in the cluster field. Using radial velocities and location of the variables in the cluster CMD they concluded that only one of their variables, a W UMa-type blue straggler, is a cluster member. No SX Phoenicis-type variables has been reported thus far.
2 Observations and data reductions
Observations reported in this paper were obtained with the 1 m Swope and 2.5 m duPont telescopes of the Las Campanas Observatory with a variety of CCD cameras. A field centered on the cluster core was observed during 24 nights between 1993 Jan 6 and 1994 Jan 3, ut. The log of the observations is summarized in Table 1.
| Date UT | Nobs | Tel. | Field of view | |
|---|---|---|---|---|
| h m | arcmin2 | |||
| Jan 6, 93 | 42 | 4:25 | 1 m | |
| Jan 7, 93 | 44 | 4:26 | 1 m | |
| Jan 8, 93 | 26 | 2:23 | 1 m | |
| Jan 11, 93 | 48 | 4:43 | 1 m | |
| Feb 2, 93 | 68 | 7:18 | 1 m | |
| Feb 3, 93 | 76 | 7:30 | 1 m | |
| Feb 4, 93 | 72 | 7:20 | 1 m | |
| Mar 12, 93 | 78 | 7:42 | 1 m | |
| Mar 13, 93 | 47 | 4:34 | 1 m | |
| Dec 18, 93 | 19 | 2:09 | 1 m | |
| Dec 19, 93 | 29 | 3:31 | 1 m | |
| Dec 20, 93 | 29 | 3:18 | 1 m | |
| Dec 21, 93 | 31 | 3:52 | 1 m | |
| Dec 22, 93 | 36 | 3:56 | 1 m | |
| Dec 23, 93 | 36 | 3:56 | 1 m | |
| Dec 24, 93 | 36 | 3:45 | 1 m | |
| Dec 27, 93 | 22 | 2:48 | 1 m | |
| Dec 28, 93 | 25 | 2:56 | 1 m | |
| Dec 29, 93 | 23 | 2:38 | 1 m | |
| Dec 30, 93 | 18 | 2:06 | 1 m | |
| Dec 31, 93 | 24 | 2:37 | 1 m | |
| Jan 01, 94 | 66 | 3:56 | 2.5 m | |
| Jan 02, 94 | 54 | 3:54 | 2.5 m | |
| Jan 03, 94 | 50 | 2:40 | 2.5 m |
In January 1993 the Texas Instrument TI#1 CCD was used, giving a field size of 5.8 arcmin with a scale of 0.435 arcsec/pixel. In February and March 1993 data were taken with the Tektronix #1 CCD with a scale of 0.7 arcsec/pixel, and the field size of 12 arcmin. The same CCD was used at the beginning of the December 1993 run, later it was replaced with the Tektronix #2 chip, with a scale of 0.61 arcsec/pixel and a field size of 10.5 arcmin. The Tek#1 camera was used again during the January 1994 run on the duPont telescope, this time the field of view was 4.4 arcmin with a scale of 0.21 arcsec/pixel. Most of the frames were collected in the band, in addition several frames were taken with and filters. The exposure time for the frames taken with the Swope telescope was 300-360 s, whereas for those collected with duPont telescope it was 120 s. We obtained a total of 999 frames in the band. On the night of 1994 January 2 several standard stars from Landolt (1992) were observed. They were used to determine the transformations to the standard system.
The preliminary processing of the raw CCD data was performed under iraf 111iraf is distributed by National Optical Astronomy Observatories, which is operated by the Association of Universities for Research in Astronomy, Inc., under cooperative agreement with the National Science Foundation.. All frames were bias subtracted and then flatfielded with median-combined sky flats. Photometry of NGC 3201 stars was measured using two software packages: frames used to extract the cluster CMD were analyzed with daophot (we used a version with variable PSF; Stetson 1987, 1989), while the sequences of observations obtained for searches for variables were reduced with dophot package (Schechter, Mateo & Saha 1993). dophot V1.1 uses an analytic, position-independent point spread function (PSF). In order to minimize the influence of variable PSF on the light curves of individual stars we applied a method of local comparison stars, as described in detail in Kaluzny et al. (1993).
3 Variables
Sequences of observations in the filter were used to search for the variables in the cluster field. Candidate variables were identified following two methods described in detail in Mazur, Krzemiński & Kaluzny (1995). First, we applied the traditional “scatter search” technique – we selected stars exhibiting excessive scatter compared to other stars of comparable brightness. The idea for the second method was taken from Stellingwerf’s (1978) paper on the phase dispersion minimization (PDM) method. We divided the overall variance calculated for consecutive intervals of a time-domain light curve by the global variance obtained from all data points and selected for further examination stars for which the quotient was the smallest. An additional examination was made of light curves of all stars that fall in the blue straggler region.
Analysis of the 1993/94 data set led to the identification of 32 new variable stars (Mazur 1996), half of which are SX Phe–type pulsating blue stragglers. In eleven of these, multiple modes are excited and these stars will be discussed in the present paper.
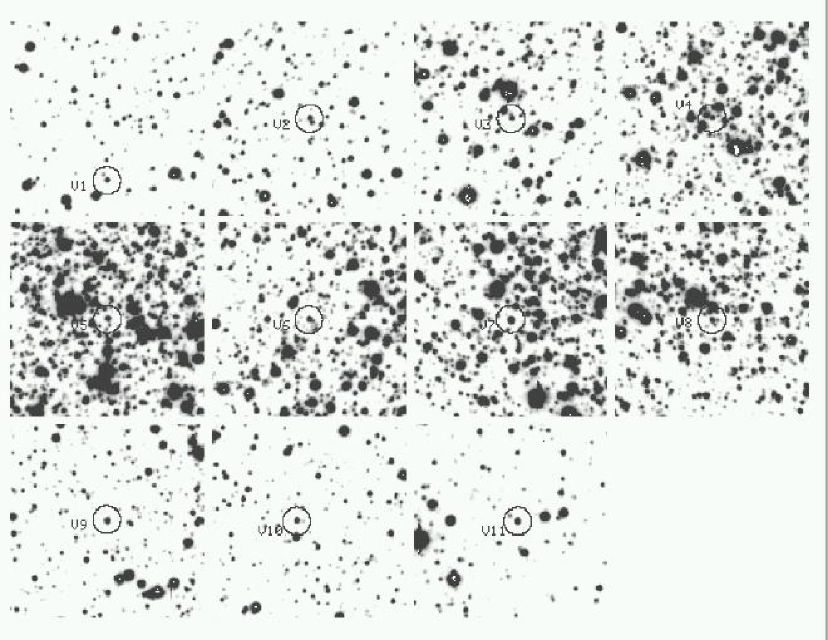
In Fig. 1 we present finding charts for the newly found multimode SX Phe-type variables.
| var | (2000) | (2000) | X | Y |
| h m s | ° | |||
| V1 | 10 17 43.5 | -46 21 53.4 | 67 | 171 |
| V2 | 10 17 32.1 | -46 22 37.9 | -53 | 126 |
| V3 | 10 17 36.6 | -46 23 3.4 | -5 | 100 |
| V4 | 10 17 42.6 | -46 24 19.5 | 58 | 24 |
| V5 | 10 17 36.0 | -46 24 38.2 | -11 | 4 |
| V6 | 10 17 42.5 | -46 24 49.1 | 57 | -7 |
| V7 | 10 17 40.2 | -46 25 7.8 | 32 | -26 |
| V8 | 10 17 36.0 | -46 25 40.2 | -11 | -59 |
| V9 | 10 17 48.1 | -46 25 53.4 | 115 | -78 |
| V10 | 10 17 50.9 | -46 25 57.7 | 145 | -76 |
| V11 | 10 17 20.1 | -46 26 38.0 | -178 | -118 |
Table 2 lists the coordinates of the variables. Column (1) gives the designation of the star; column (2) and (3) are the equatorial coordinates, derived from the position of about 100 stars selected from the USNO-A V1.0 Catalogue of Astrometric Standards (Monet at al. 1996). The errors of the coordinates are about 1 arcsec. Columns (4) and (5) are the coordinates in the system of the Sawyer Hogg Catalogue (Sawyer Hogg 1973).
Fig. 2 shows the locations of the variables in the cluster colour-magnitude diagram (CMD). The diagram is based on a 100 s -band exposure and a 200 s -band exposure taken with the duPont telescope on the night of 1997 February 20 ut. The field was centered on the cluster core and covered an area of arcmin. The CMD is not intended to be complete – stars having atypically large photometric errors at a given magnitude were omitted. All of the variables are located in the blue straggler region, and occupy a narrow strip of width 0.11 mag in .
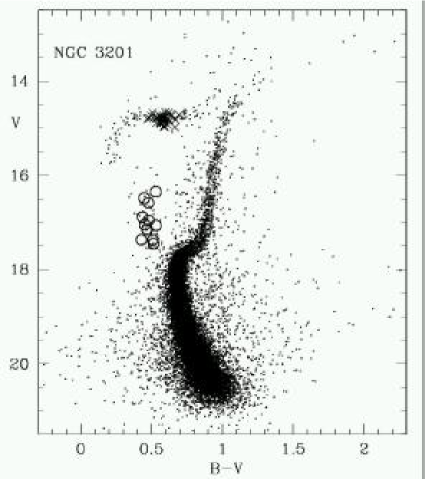
Table 3 lists the photometric properties of the variables.
| var | Frequency(1/d) | mode | |||
|---|---|---|---|---|---|
| V1 | 17.15 | 0.47 | 22.057 | 0.05 | |
| 22.380 | 0.025 | ||||
| V2 | 17.37 | 0.51 | 26.842 | 0.04 | F |
| 34.350 | 0.05 | 1OT | |||
| V3 | 17.46 | 0.51 | 26.634(27.634) | 0.025 | |
| 27.968(28.967) | 0.025 | ||||
| V4 | 17.37 | 0.43 | 26.567 | 0.07 | |
| 27.020 | 0.04 | ||||
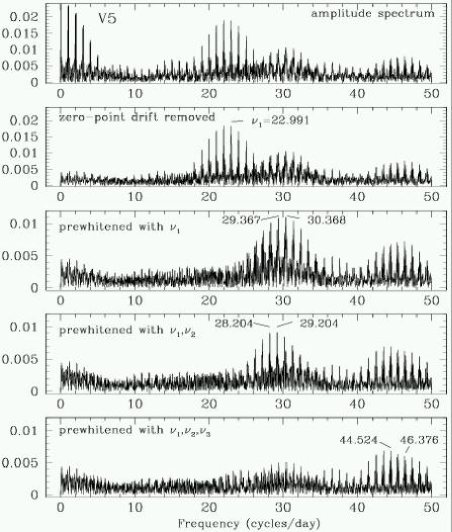
| V5 | 16.89 | 0.44 | 22.991(21.991) | 0.04 | |
| 29.367(30.368) | 0.025 | ||||
| 28.204(29.204) | 0.02 | ||||
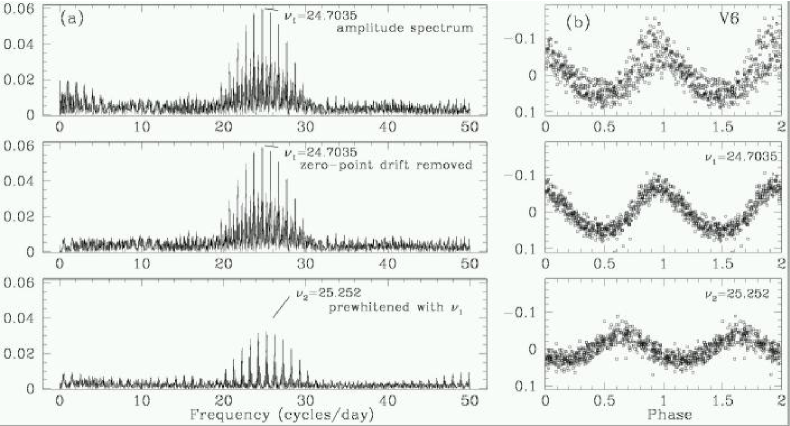
| V6 | 16.96 | 0.48 | 24.7035 | 0.13 | 1OT |
| 25.252 | 0.07 | ||||
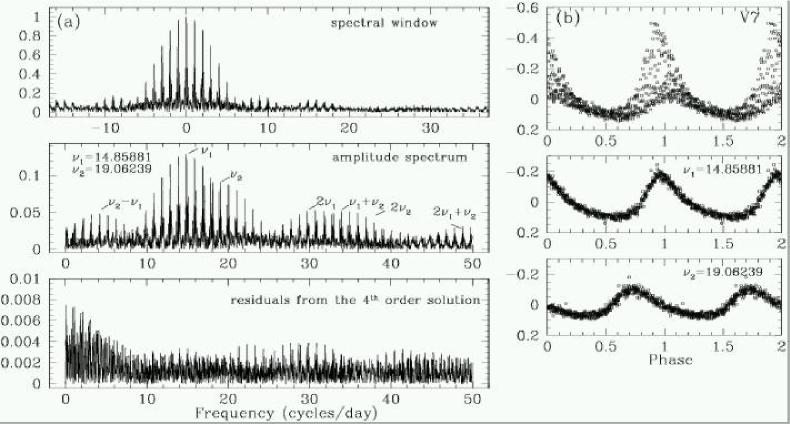
| V7 | 16.35 | 0.53 | 14.85881 | 0.37 | F |
| 19.06239 | 0.22 | 1OT | |||
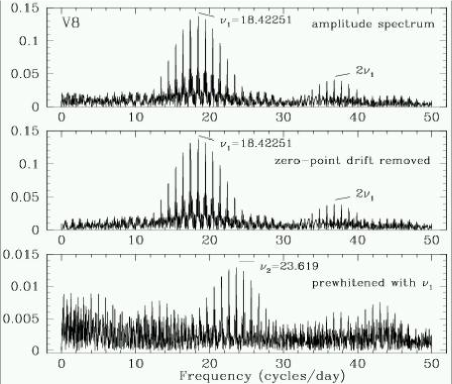
| V8 | 17.05 | 0.45 | 18.42251 | 0.39 | F |
| 23.619 | 0.03 | 1OT | |||
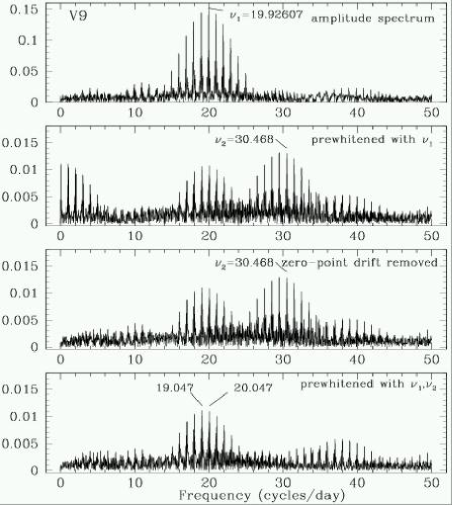
| V9 | 16.59 | 0.48 | 19.92607 | 0.36 | 1OT |
| 30.468 | 0.025 | ||||
| 19.047(20.047) | 0.023 | ||||
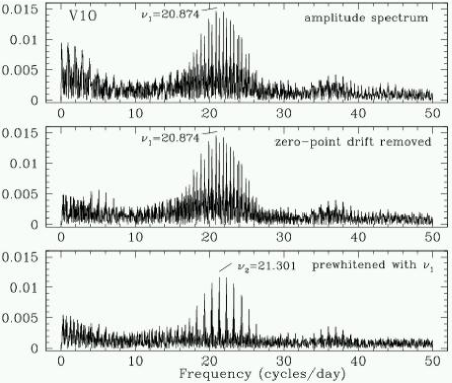
| V10 | 17.07 | 0.53 | 20.874 | 0.03 | |
| 21.301 | 0.025 | ||||
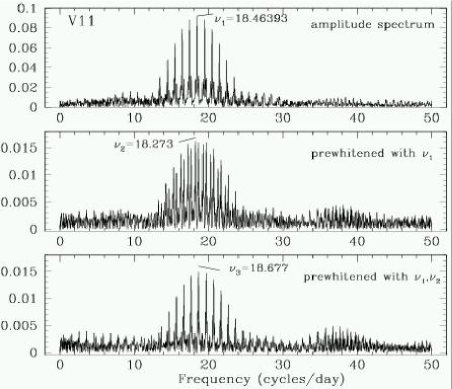
| V11 | 16.48 | 0.45 | 18.46393 | 0.2 | 1OT |
| 18.273 | 0.03 | ||||
| 18.677 | 0.03 |
Column (2) gives mean -band magnitude. Column (3) is the colour, while column (4) shows the frequencies of pulsations, in cycles per day. Column (5) gives the full amplitude in the band. The mean magnitudes were derived from data obtained in February 1997 on the duPont telescope.
The data have been collected during 6 observing runs which separate into two data sets. The first data set consist of January, February and March 1993 runs and we will refer to it as to season 1993; the second set is formed by 3 runs in December 1993/January 1994 – hereafter season 1994. Since the gap between both data sets is long (9 months), we calculated Fourier periodograms for each season separately. The long gaps between successive runs and the fact that these runs were very short resulted in a very complex spectral window for the 1993 season. In the case of low amplitude variables, the noise introduced by photometric errors made it impossible to decide which of the aliases is real. The spectral window for the 1994 season is much clearer although the resolution is poorer. We decided to restrict our analysis to the 1994 data. We used the 1993 data set to improve the determination of frequencies of high amplitude modes.
Fourier periodograms of the 11 SX Phe–type pulsators for the 1994 season are shown in Figures 3-13. In most cases there is a considerable signal at very low frequencies. Most likely the presence of these frequencies is caused by zero-point drift, which in turn seems to be a result of variations of the PSF across the chip. The method of local comparisons can compensate for errors in the profile photometry to some extent, but some variability on a time-scale of nights remains. An additional source of error is the combination of photometry that was collected with 3 different telescope/chip configurations. We assume that the low frequencies present in the periodograms are not intrinsic to the variables, and decided to fit a sine wave to the data and subtract this long term variability; frequencies less than 0.2 cycle have been removed from the data.
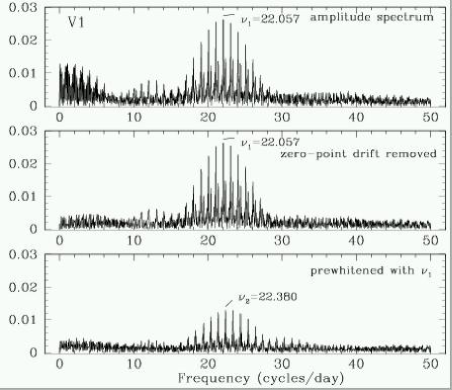
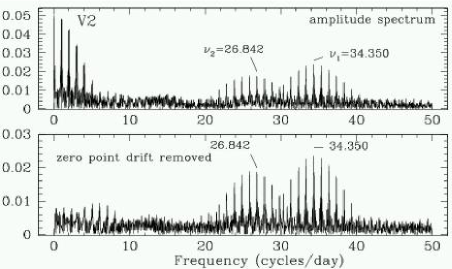
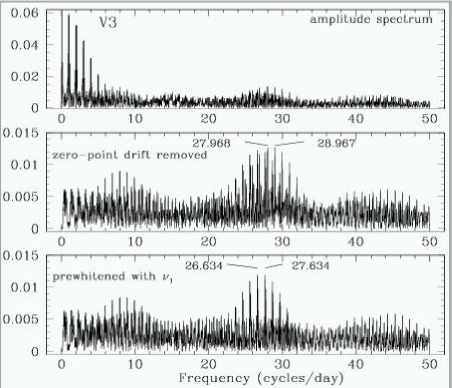
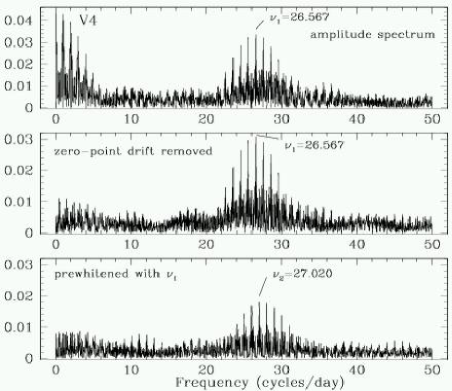
Fourier transforms have been recalculated, and the frequency of the highest peak has been used as an input to the programme NFIT (Schwarzenberg-Czerny 1999). NFIT fits a Fourier series by nonlinear least squares allowing for a refinement of frequency; several base frequencies, their harmonics and linear combinations can be included. Once the first frequency was determined, the data were prewhitened and the Fourier transform of the residuals was calculated. The second main frequency was identified and NFIT was used to fit a Fourier series of both frequencies to the data. The number of harmonics and the combination terms depended on the amplitude of the excited modes. In the case of the low amplitude variables for each frequency usually only one term was significant. In the case of the high amplitude double-mode variable V7 combination terms up to fourth order could be detected. The second solution was again subtracted from the data and the residuals were searched for additional periodicities. For eight variables the Fourier transform of the residuals from the two frequency solution showed no more periodicities with the full amplitudes in the -band in excess of 0.02 mag. In the case of V5, V9 and V11 a third periodicity has been detected, and the whole procedure was repeated. In some cases the Fourier transform showed daily aliases of comparable height. This problem could generally be resolved with the help of the 1993 data when the observing nights were longer and the side-lobes due to day cycles smaller. We have also compared residuals resulting from fits assuming different combinations of frequencies, but in the case of low amplitude variables differences we got were negligible. In several cases we were not able to distinguish between a real frequency and an alias, and two possibilities are given in Table 3.
4 Mode identification
Multiperiodicity of SX Phe variables opens the possibility of applying the theory of pulsations to constrain masses and possible formation scenarios of blue stragglers (Gilliland & Brown 1992, Petersen & Christensen-Dalsgaard 1996). The first step in constructing models is the identification of modes. Until recently, SX Phe variables were usually attributed a single (fundamental or first-overtone) radial mode (Nemec & Mateo 1990; Nemec, Linnell Nemec & Lutz 1994, McNamara 1995). SX Phe itself was for a long time the only member of the class known to pulsate in fundamental and first-overtone modes simultaneously. This situation has changed in the last few years. Garrido & Rodriguez (1996) analysed the existing data on SX Phoenicis to show that in addition to two high-amplitude modes at least two other periodicities are present (one of them clearly non-radial) with amplitudes at the mmag level. Additional periodicities have also been discovered in another field SX Phe-type star, BL Camelopardalis (Hintz et al.1997, Zhou et al. 1999). Gilliland et al. (1998) reported on the discovery of multimode SX Phoenicis pulsators in 47 Tucanae. For one of the variables (V2) the interpretation of the detected periodicities as fundamental radial mode and first overtone is based on the derived period ratio (0.772). For the others, a safe identification of modes is not possible (Bruntt et al. 2001). Pych et al. (2001) discovered twelve double-mode variables among SX Phe stars in M55. For the majority of these the period ratio is close to 1, implying that at least one of the excited modes is nonradial. Freyhammer, Petersen & Andersen (2000) reported the discovery of 11 multimode pulsators in Cen, and they estimate that Cen hosts hundreds of SX Phe stars. Petersen et al. (2000) analyzed the published light curves of 48 SX Phe variables in globular clusters in search for double-mode oscillation. Several stars that show indications for double-mode pulsations in low order radial modes have been identified.
All these studies show that in SX Phoenicis stars both radial and nonradial modes are excited suggesting that they are population II twins of Scuti variables. Multisite photometric campaigns and spectroscopic studies suggest that in Scuti stars hundreds of nonradial pulsation modes are simultaneously excited (Breger 2000). Only the low-degree modes can be detected photometrically. The multisite observing campaigns resulted in the discovery of about 20 independent modes in the best studied stars (FG Vir - Breger et al. 1998, 4 CVn - Breger et al. 1999). The number of the observed frequencies in SX Phe-type stars is much smaller, and this is most likely due to the lower accuracy of the data and the shorter timespan of observing runs – many of the peaks in Scuti stars fall in the mmag range.
The photometric methods that can be employed to discriminate between radial and low-order nonradial modes rely on “amplitude ratios versus phase shifts” diagrams. In order to apply this analysis technique multicolor photometry is required [ – Watson (1988), Strömgren – Garrido, Garcia-Lobo & Rodriguez (1990]. In the 1993/1994 seasons we observed NGC 3201 in mainly the band, the few obtained frames in do not allow mode discrimination. However, there is an indirect method that one can use. Rodriguez et al. (1996) examined the amplitude ratios and phase shifts between observed light and color variations to show that the high amplitude (with full visual amplitude greater than roughly 0.3 mag) Scuti and SX Phoenicis stars pulsate in radial modes. They also analysed 3 monoperiodic medium amplitude stars and concluded that they are radial pulsators as well. Hence we will assume that the high amplitude modes in V7,V8 and V9 correspond to radial pulsation. It seems likely that the medium amplitude modes in V6 and V11 are radial as well. However this latter assumption may not be correct. As pointed out by the referee some Scuti stars have nonradial modes with individual amplitudes in excess of 0.1 mag (e.g. 1 Mon, Balona et al. 2001).
Another method that can be useful in mode identification is the analysis of observed period ratios. Petersen & Christensen-Dalsgaard (1996) have discussed the (first overtone to the fundamental mode) and (second to first overtone) period ratios in terms of metal content and mass-luminosity relation. The calculated period ratios show a significant dependence on both metal abundance and the relation. For Z=0.001 they obtain in the range 0.775-0.790, depending on the relation used. The uncertainty of period ratios calculated from models is large but fortunately there is the possibility of comparing them with the observed period ratio of SX Phoenicis itself. The metallicity of SX Phoenicis ([Fe/H]=-1.37 – Hintz, Joner & Hintz 1998) is very similar to that of NGC 3201 ([Fe/H]=-1.42, Gonzalez & Wallerstein 1998). The period ratio observed in SX Phoenicis is 0.7782, very close to the value derived for the high amplitude variable V7 (0.779); we conclude that the radial modes excited in V7 are the fundamental mode and first overtone. The period ratios derived for V2 and V8 (0.781 and 0.780 respectively) are also very similar. We have already assumed that the longer of the periods detected in V8 corresponds to the radial mode (on the basis of its high amplitude), and it seems likely that this is the fundamental mode and that the other mode is the first overtone. In the case of V2 both modes are of low amplitude, and the period ratio is the only argument in favour of the first overtone/fundamental mode interpretation. However this conclusion may not be correct. Poretti (2000) gives the example of the Scuti star 44 Tau to show that nonradial modes can also show a similar period ratio. Several examples of period ratios in the range 0.76-0.78 can be found among the seven terms observed in this star.
In the case of low amplitude variable V5, the situation is even more complicated. Three frequencies have been detected in the Fourier spectrum, and some additional periodicities seem to be visible in the residuals. We are not able to identify frequencies unambiguously because of daily aliases. When dividing some of the possible frequencies we get period ratios that fall in the range 0.77-0.79 typical for (22.991/29.367 = 0.783), but values typical for (22.991/28.204 = 0.815) are also possible. From the position on the period-luminosity diagram (Fig. 14) the interpretation of 22.991 as the first overtone seems more likely, but we cannot exclude the possibility that it is a nonradial mode. Further observations are needed to analyze the frequency spectrum of this star.
In the case of the other stars (V1,V3,V4,V10) we observed two closely spaced periodicities - at least one of these must correspond to a nonradial mode. The same applies to low amplitude modes present in the vicinity of the high amplitude ones in V6, V9 and V11.
5 Period-luminosity relation and distance modulus to NGC 3201
In Fig. 14 we show the period-luminosity relation for the SX Phoenicis stars in NGC 3201. Circles represent positions of the presumed radial modes (assigned on the basis of the full visual amplitude mag). The horizontal lines connect the pairs of modes in variables V2, V7 and V8, for which the observed period ratio suggests pulsations in fundamental mode and first overtone. Also plotted are lines corresponding to McNamara’s (1997) period-luminosity relations for the fundamental mode () and first overtone, shifted by the distance modulus to the cluster. We adopted a period-ratio of when calculating the first overtone relation.

The apparent distance modulus to the cluster has been calculated as a mean of distant moduli determined from McNamara’s (1997) P-L relation for 6 variables (V2, V6, V7, V8, V9, V11). The individual distance moduli were 13.98, 14.11, 13.91, 14.27, 14.09, 14.10, respectively. The variables V6, V9 and V11 have been assumed to be pulsating in the first overtone and corresponding fundamental periods were calculated assuming a period ratio . We obtain a mean apparent distance modulus to NGC 3201 . For comparison a mean distance modulus calculated taking into account only 3 variables pulsating in the first overtone and fundamental mode is ). The quoted error does not include systematic errors in McNamara’s period-luminosity relation. To estimate the systematic error we calculated the distance modulus to NGC 3201 using two other P-L relations. Pych et al. (2001) presented P-L relations for SX Phe stars in the globular cluster M55. These fundamental mode and first overtone relations yield and , respectively. The Petersen & Høg 1998 relation is based on Hipparcos parallaxes and gives a mean modulus of . We estimate that the systematic error in the determination of distance moduli based on P-L relations is 0.1 mag, so the final result for the distance modulus to NGC 3201 is .
| 222NGC 3201 is affected by differential reddening, in column (3) we give a mean value for the cluster | method | reference | ||
|---|---|---|---|---|
| 14.24 | 13.58 | 0.21333average of different sources | Harris 1996 | |
| 13.95 | 13.27 | 0.22444adopted | local subdwarfs fitting | Covino & Ortolani 1997 |
| 14.15 | 13.47 | 0.22 | subdwarf fiducial fitting | Covino & Ortolani 1997 |
| 14.0 | 13.32 | 0.22 | RR Lyrae | Covino & Ortolani 1997 |
| 14.2 | 13.52 | 0.22 | RR Lyrae | Covino & Ortolani 1997 |
| 13.84 | 13.26 | 0.17 | isochrone fitting | von Braun & Mateo 2001 |
| 14.25 | 13.32 | 0.30 | RR Lyrae | Piersimoni et al. 2002 |
| 14.21 | 13.35 | 0.28 | RR Lyrae | Layden 2002 |
| 14.08 | SX Phe | this paper |
Our value of the distance modulus to NGC 3201 is only slightly lower than the distance modulus listed in the Harris (1996) Catalog of Parameters for Globular Clusters in the Milky Way (the electronic edition as updated in June 1999) (). The distance scale adopted there is defined by . Covino & Ortolani (1997) measured the distance modulus to NGC 3201 by main sequence fitting to the subdwarf sequence and by the relation for RR Lyrae stars. Main sequence fitting to 8 local subdwarfs yielded , and the use of the subdwarf fiducial resulted in . However the absolute magnitudes of the field subdwarfs they used had been derived from ground based parallaxes which are known now to have the systematic errors and which are larger than those determined by Hipparcos. The RR Lyraes yielded two values and , depending on the relation used. von Braun & Mateo (2001) obtained a true distance modulus and an average reddening from isochrone fitting, resulting in an observed distance modulus . Piersimoni, Bono, & Ripepi (2002) determined the distance to NGC 3201 based on cluster RR Lyrae stars. They measure ( and ) or for . Layden (2002) also used observations of RR Lyrae stars to obtain a true distance modulus and mean , or . Our distance modulus to NGC 3201, , falls in the range defined by the other determinations. Recent distance modulus determinations are summarized in Table 4.
6 Summary
We have surveyed the southern globular cluster NGC 3201 for short-period variable stars. In this first of a series of papers we present CCD photometry of eleven multimode SX Phoenicis–type blue stragglers discovered in this cluster. Fourier periodograms of the -band light curves are presented. The analysis of Fourier transforms shows that both radial and non-radial modes are excited. A tentative identification of radial modes in six variables is proposed. For three stars (V2, V7, V8) the derived period ratios are close to that observed in SX Phoenicis itself, suggesting pulsations in the fundamental and the first-overtone radial modes. For three more stars (V6, V9 and V11) a radial mode has been assigned on the basis of high ( 0.3 mag) or medium ( 0.1 mag) amplitudes of variability; from the position on period-luminosity diagram we infer that in these variables the first overtone is excited. In eight of the variables pairs of closely spaced modes are detected that cannot be explained with radial modes, at least one of them must be nonradial. The apparent distance modulus to the cluster has been calculated from distant moduli determined from McNamara’s (1997) P-L relation applied to six presumed radial pulsators. We measure , consistent with other determinations.
Acknowledgments
BM and WK were supported by the grant 5.P03D.004.21 from the Committee of Scientific Research (Poland). IBT and WK were supported by NSF grant AST-9819786. We would like to thank Dr. Paul Schechter for making dophot available to us, and Dr. Alex Schwarzenberg-Czerny for the opportunity to use his programme NFIT. We also thank the director of The Observatories of the Carnegie Institution of Washington for a generous allocation of observing time. BM acknowledges with gratitude the kind hospitality of the Las Campanas Observatory during her stays in Chile, and WK the generous hospitality of the Copernicus Astronomical Centre where this paper was written. An anonymous referee’s comments are also appreciated. This research has made use of NASA’s Astrophysics Data System Abstract Service.
References
- [1] Alcaino G., 1976, A&AS, 26, 251
- [2] Alcaino G., Liller W., 1981, AJ, 86, 1480
- [3] Alcaino G., Liller W., Alvarado F., 1989, A&A, 216, 68
- [4] Bailey S.I., 1922, Harvard Circ., 234
- [5] Balona L. et al., 2001, MNRAS, 321, 239
- [6] Breger M. et al., 1998, A&A, 331, 271
- [7] Breger M. et al., 1999, A&A, 349, 225
- [8] Breger M., 2000, in Breger M., Montgomery M.H., eds, ASP Conf. Ser., Vol 210, Delta Scuti and Related Stars. Astron. Soc. Pac., San Francisco, p.3
- [9] Brewer J.P.,Fahlman G.G., Richer H.B., Searle L., Thompson I., 1993, AJ, 105, 2158
- [10] Bruntt H., Frandsen S., Gilliland R.L., Christensen-Dalsgaard J., Petersen J.O., Guhathakurta P., Edmonds P.D, Bono G.,2001,A&A, 371, 614
- [11] Cacciari C., 1984, AJ, 89, 231
- [12] Carretta E., Gratton R.G., 1997, A&AS, 121,95
- [13] Clement C.M., Muzzin A., Dufton Q.,Ponnampalam T., Wang J., Burford J., Richardson A., Rosebery T., Rowe J.,Sawyer Hogg H., 2001, AJ, 122, 2587
- [14] Cote P., Welch D.L., Fischer P., Da Costa G.S., Tamblyn P., Seitzer P., Irwin M.J., 1994, ApJS, 90, 83
- [15] Covino S., Ortolani S., 1997, A&A, 318, 40
- [16] Dowse M., 1940, Harvard Bulletin, 913, 17
- [17] ESA 1997, The Hipparcos and Tycho Catalogues, ESA SP-1200
- [18] Freyhammer L. M., Petersen J. O., Andersen M. I, 2000, in Szabados L., Kurtz D., eds, ASP Conf. Ser., Vol 203, The Impact of Large-Scale Surveys on Pulsating Star Research. Astron. Soc. Pac., San Francisco, p. 252
- [19] Garrido R., Rodriguez E., 1996, MNRAS, 281, 696
- [20] Garrido R., Garcia-Lobo E., Rodriguez E., 1990, A&A, 234, 262
- [21] Gilliland R.L., Brown T.M., 1992, AJ, 103, 1945
- [22] Gilliland R. L., Bono G., Edmonds P.D., Caputo F., Cassisi S., Petro L.D., Saha, A., Shara M.M., 1998, ApJ, 507, 818
- [23] Gonzalez G., Wallerstein G., 1998, AJ, 116, 765
- [24] Harris W.E, 1996, AJ, 112, 1487
- [25] Hintz M.L., Joner M.D., Hintz E.G., 1998, AJ, 116, 2993
- [26] Hintz E.G., Joner M.D., McNamara D.H, Nelson K.A., Moody J.W., Kim C., 1997, PASP, 109, 15
- [27] Kaluzny J., Krzemiński W., Mazur B., 1996, A&AS, 118, 303
- [28] Kaluzny J., Mazur B., Krzemiński W., 1993, MNRAS, 262, 49
- [29] Landolt A., 1992, AJ, 104, 340
- [30] Layden A., 2002, in Aerts C., Bedding T.R., Christensen-Dalsgaard, eds, ASP Conf. Ser., Vol 259, Radial and Nonradial Pulsations as Probes of Stellar Physics. Astron. Soc. Pac., San Francisco, p.122
- [31] Lee S.W., 1977, A&AS, 28, 409
- [32] Mazur B., 1996, Ph.D. thesis, Copernicus Astronomical Center
- [33] Mazur B., Kaluzny, J., Krzemiński, W., 1999b, MNRAS, 306, 727
- [34] Mazur B., Krzemiński W., Kaluzny J., 1995, MNRAS, 273, 59
- [35] Mazur B., Krzemiński W., Kaluzny J., 1999a, Acta Astron., 49, 551
- [36] McNamara D.H., 1995, AJ, 109, 1751
- [37] McNamara D.H., 1997, PASP, 109, 1221
- [38] Monet D. et al., 1996, USNO-A V1.0, A Catalogue of Astrometric Standards, USNO, Washington, electronic access: http://archive.eso.org/skycat/usno.html
- [39] Nemec J.M., Mateo M., 1990, in Cacciari C., Clementini G., eds, ASP Conf. Ser., Vol 11, Confrontation between stellar pulsation and evolution. Astron. Soc. Pac., San Francisco, p.64
- [40] Nemec J.M., Nemec A.F.L., Lutz T.E., 1994, AJ, 108, 222
- [41] Paczyński B., 1997, in Livio M., Donahue M., Panagia N., eds, The Extragalactic Distance Scale, Cambridge Univ. Press, Cambridge, 273
- [42] Penny A.H., 1984, in Meader A., Renzini A., eds, Observational Test of the Stellar Evolution Theory, IAU Symp. 105, Reidel, Dordrecht, p.157
- [43] Petersen J.O., Christensen-Dalsgaard,J., 1996, A&A, 312, 463
- [44] Petersen J.O., Christensen-Dalsgaard,J., 1999, A&A, 352, 547
- [45] Petersen J.O., Høg E., 1998, A&A, 331, 989
- [46] Petersen J.O., Quaade M., Freyhammer L.M., Andersen M.I., 2000, in Breger M., Montgomery M.H., eds, ASP Conf. Ser., Vol 210, Delta Scuti and Related Stars. Astron. Soc. Pac., San Francisco, p.391
- [47] Piersimoni A.M., Bono G., Ripepi V., 2002, AJ, 124, 1528
- [48] Poretti E., 2000, in Breger M., Montgomery M.H., eds, Delta Scuti and Related Stars, ASP Conf. Ser. 210, 45
- [49] Pych W., Kaluzny J., Krzemiński W., Schwarzenberg-Czerny A., Thompson I.B., 2001, A&A, 367, 148
- [50] Rodriguez E., Rolland A., Lopez de Coca P., Martin S., 1996, A&A, 307, 539
- [51] Rosenberg A., Piotto G., Saviane I., Aparicio A., 2000, A&AS, 144, 5
- [52] Ruciński S.M., Duerbeck H.W., 1997, PASP, 109, 1340
- [53] Samus N.N., Kravtsov V.V., Pavlov M.V., Strel’nikov V.V., Shokin Yu. A., Alcaino G., Liller W., Alvarado F., 1996, Astronomy Letters, 22, 239
- [54] Santolamazza P., Marconi M., Bono G., Caputo F., Cassisi S., Gilliland R.L., 2001, ApJ, 554, 1124
- [55] Sawyer Hogg, 1973, Publ. David Dunlap Obs., 3, 6
- [56] Schechter P.L., Mateo M.M., Saha A., 1993, PASP, 105, 1342
- [57] Schwarzenberg-Czerny A., 1999, ApJ, 516, 315
- [58] Stellingwerf R.F, 1978, ApJ, 224, 953
- [59] Stetson P.B., 1987, PASP, 99, 191
- [60] Stetson P.B., 1989, DAOPHOT II User’s Manual
- [61] von Braun K., Mateo M., 2001, AJ, 121,1522
- [62] von Braun K., Mateo M., 2002, AJ, 123, 279
- [63] Watson R.D.,1988,Ap& SS,140,255
- [64] Wilkens H., 1965, Mitt. Verand. Sterne., 3, 75
- [65] Woods I.E., 1919, Harvard Circ., 216
- [66] Wright F.W., 1941, Harvard Bulletin, 915,2
- [67] Zhou Ai-Ying, Rodriguez E., Jiang Shi-Yiang, Rolland A., Costa V., 1999, MNRAS, 308, 631
- [68] Zinn R., West M.J., 1984, ApJS, 55, 45