New measurement of the 6Li/7Li isotopic ratio in the extra-solar planet host star HD82943 and line blending in the Li 6708 Å region.
The presence of possible blends in the spectral region of the Li resonance line at 6708 Å in solar-type metal-rich stars is investigated using high resolution and high signal-to-noise spectroscopic observations. Our analysis does not confirm the identification of a weak absorption feature at 6708.025 Å with the low excitation Ti i line proposed by Reddy et al. (2002). Our spectrum synthesis suggests that the unidentified absorption is most probably produced by a high excitation Si i line originally proposed by Müller et al. (1975). Reanalysis of the 6Li/7Li isotopic ratio in HD 82943 was performed by taking the Si i line into account and using new VLT/UVES spectra of HD 82943 with a signal-to-noise ratio close to 1000. We confirm the presence of 6Li in the star’s atmosphere while the updated value for the isotopic ratio is Li) = .
Key Words.:
stars: abundances – stars: chemically peculiar – Line: identification – Line: profiles1 Introduction
An interesting opportunity for testing the planet(s) ingestion scenario is offered by a 6Li test (Israelian et al. isr01 (2001)). This approach is based on looking for an element that should not appear in the atmosphere of a normal star, but would be present in a star that has swallowed a planet. We have proposed recently that a light isotope, 6Li, is an excellent tracer of any planetary matter accretion. The detection of 6Li in HD 82943 by our group (Israelian et al. isr01 (2001)) was considered as convincing observational evidence that stars may accrete planetary material, or even entire planets, during their main sequence (MS) lifetime. Other explanations (such as stellar flares or surface sports) of this phenomenon were ruled out (Israelian et al. isr01 (2001)). It has been suggested (Sandquist et al. san02 (2002)) that 6Li can be used to distinguish between different giant planet formation theories.
Nuclear reactions destroy the lithium isotopes (6Li and 7Li) in stellar interiors at temperatures (6Li) and K (7Li). Convection cleans the upper atmosphere of Li nuclei by transporting them to deeper, hotter layers where they are rapidly destroyed. Young low mass stars are entirely convective and most of the primordial Li nuclei are burned in their interiors in a mere few million years. However, many solar-type stars preserve a large fraction of their initial atmospheric 7Li nuclei. According to standard models (Forestini for94 (1994); Montalbán & Rebolo mon02 (2002)), at a given metallicity there is a mass range, where 6Li but not 7Li is being destroyed. These models predict that no 6Li can survive pre-MS mixing in metal-rich solar-type stars. Observations seem to support this scenario since no clear detections of 6Li have been reported in solar-type solar-metallicity stars (Andersen, Gustaffson & Lambert and84 (1984); Rebolo et al. reb86 (1986)). We note, however, that the mass and the depth of the convection zone also depend on the metal content of the star, and for this reason several old metal-poor stars have preserved a fraction of their initial 6Li nuclei (Cayrel et al. cay99 (1999), Hobbs, Thorburn & Rebull hobbs99 (1999)). This suggests that any detected 6Li in a metal-rich solar-type star would most probably signal an external source for this fragile isotope.
Observations of 6Li are extremely difficult for several reasons. First of all, it is a weak component of a blend of the much stronger doublet of 7Li with an isotopic separation 0.16 Å. In the case of metal-poor halo stars with [Fe/H], blending of the Li line with other weak absorptions is not expected, and also the placement of continuum does not pose serious problems. 6Li has been unsuccessfully sought in many metal-poor stars but unambiguously detected in only few (Hobbs et al. hobbs99 (1999); Cayrel et al. cay99 (1999); Nissen et al. Nis99 (1999)). The methods used in the analysis of 6Li have been widely discussed in the literature (e.g. Nissen et al. Nis99 (1999); Cayrel et al. cay99 (1999); Hobbs et al. hobbs99 (1999)). In metal-rich stars the identification of any possible weak blends in the region of the Li absorption becomes crucial (King et al. king97 (1997)). Recently Reddy et al. (red02 (2002)) updated the line list of Lambert, Smith & Heath (lam93 (1989)) based on the analysis of the solar spectrum of Kurucz et al. (kur84 (1984)) and Hinkle et al. (Hin00 (2000)). They claimed that a previously noticed weak absorption in the solar spectrum at 6708.025 Å (Müller, Peytremann & De La Reza mull75 (1975)) belongs to Ti i. With this assumption their analysis of the Li feature in HD 82943 did not confirm the presence of 6Li.
With the goal of establishing the nature of the absorption at 6708.025 Å and better understanding the line list near Li, we have obtained high resolution, high S/N spectra for several metal-rich stars with no detectable Li line. Our targets cover a wide range of effective temperature, allowing a more reliable identification of the lines in the spectral region of the Li feature. We have also obtained new spectra of HD 82943. Here we present new analysis of the 6Li/7Li ratio in HD 82943 and critically discuss the line list of the Li region. Our observations do not confirm the Ti i line of Reddy et al. (red02 (2002)) and support our previous claim for detection of 6Li.
2 Observations
We used the 8.2 m VLT Kueyen (ESO, La Silla), the UVES spectrograph and an EEV detector to obtain spectra of HD 82943 during the night of 2001 March 5. The 0.3″ slit yielded a resolving power of 105 000 as measured from the FWHM of Th–Ar lamp lines.
The 4.2 m William Herschel Telescope on La Palma (Canary Islands, Spain) and the UES spectrograph were used to observe several solar-type stars with large Li depletions in their atmospheres. Our first targets were HD 171888 (F8 V), HD 4747 (G8 V), HD 217580 (K4 V), HD 217107 (G3 V) and HD 210277 (G4 V). These stars were observed on 2000 July 8. The CCD SITE1 (2148 2148 pixel), grating E31, slit width 1″ (providing a resolving power of 55 000) and the central wavelength of 5140 Å were used during this run. Our spectra had an S/N ratio in the range 300–350, which was sufficient to guarantee the detection of any spectral lines with a minimum equivalent width of 1.5 mÅ. These data were used by us (Israelian et al. 2001) in order to check the presence of blends near 6708 Å with the EW larger than 1.5 mÅ. More targets (Table 1) have been observed in order to reduce this limit to below 1 mÅ. The same configuration was used in 2001 October to observe HD 16141, HD 22049, HD 75732A and HD 217107. In the next observing run (2002 June 20), we used a -pixel EEV CCD with a pixel size of 15 m, the E31 grating, a slit width of 1″ and a central wavelength of 7215 Å. Ten exposures of HD 82943 were taken on 2001 February 5 with a mosaic of two EEVs, the E79 grating and a slit width of 0.7″ in order to obtain a high quality of spectrum of this star.
The SARG high resolution echelle spectrograph at the 3.5 m Telescopio Nazionale Galileo (La Palma) was used during two runs in 2001 August and 2002 May. The spectra were obtained with the yellow grism and span the wavelength range 4600–7820 Å at a resolving power of 57 000. The CCD was a mosaic of two -pixel EEVs with a pixel size of 15 m.
All our VLT/UVES, WHT/UES and TNG/SARG spectra were reduced using standard IRAF111IRAF is distributed by National Optical Astronomy Observatories, operated by the Association of Universities for Research in Astronomy, Inc., under contract with the National Science Foundation, USA. routines. Normalized flats created for each observing night were used to correct the pixel-to-pixel variations and a Th–Ar lamp was used to find a dispersion solution.
Some observations were made with the FEROS spectrograph at the ESO 1.52 m telescope in La Silla. The mosaic of two -pixel EEV CCDs were used to observe HD 1461 and HD13 445 on 2000 November 10 and HD 192263 on 2001 October 31. The spectra were flatfielded, calibrated with a Th–Ar lamp and reduced using MIDAS routines.
| Target | Configuration | Exp. time | / | S/N | Date | [Fe/H] | Ref. | ||||
|---|---|---|---|---|---|---|---|---|---|---|---|
| [s] | [K] | [cm s-2] | [km s-1] | ||||||||
| HD 1461 | 1.52m/FEROS | 6.46 | 1200 | 48,000 | 400 | 2000 Nov 10 | 5785 | 4.47 | 1.23 | 0.18 | 1 |
| HD 13445 | 1.52m/FEROS | 6.10 | 900 | 48,000 | 350 | 2000 Nov 10 | 5190 | 4.71 | 0.78 | 0.20 | 2 |
| HD 16141 | WHT/UES | 6.78 | 8100 | 55,000 | 600 | 2001 Oct 03 | 5805 | 4.28 | 1.37 | 0.15 | 1 |
| HD 22049 | WHT/UES | 3.73 | 700 | 55,000 | 800 | 2001 Oct 03 | 5135 | 4.70 | 1.14 | 0.07 | 2 |
| HD 75732A | WHT/UES | 5.95 | 1200 | 55,000 | 400 | 2001 Oct 01 | 5307 | 4.58 | 1.06 | 0.35 | 3 |
| HD 82943 | VLT/UVES | 6.54 | 700 | 105,000 | 900 | 2001 Mar 05 | 6025 | 4.53 | 1.10 | 0.30 | 3 |
| HD 82943 | WHT/UES | 6.54 | 8400 | 70,000 | 1100 | 2001 Feb 05 | - | - | - | - | - |
| HD 130322 | TNG/SARG | 8.0 | 3600 | 57,000 | 300 | 2002 May 25 | 5430 | 4.62 | 0.95 | 0.06 | 2 |
| HD 134987 | TNG/SARG | 6.45 | 1800 | 57,000 | 300 | 2002 May 25 | 5780 | 4.45 | 1.06 | 0.32 | 3 |
| HD 134987 | WHT/UES | 6.45 | 2000 | 55,000 | 300 | 2002 Jun 20 | - | - | - | - | - |
| HD 137759 | TNG/SARG | 3.31 | 150 | 57,000 | 550 | 2002 May 26 | 4553 | 2.74 | 1.50 | 0.03 | 4 |
| HD 145675 | TNG/SARG | 6.67 | 19 800 | 57,000 | 900 | 2002 May 27 | 5255 | 4.40 | 0.68 | 0.51 | 3 |
| HD 177830 | WHT/UES | 7.17 | 800 | 55,000 | 300 | 2000 Jul 09 | 4840 | 3.60 | 1.18 | 0.32 | 3 |
| HD 192263 | 1.52m/FEROS | 8.1 | 1800 | 48,000 | 300 | 2001 Oct 31 | 4995 | 4.76 | 0.90 | 0.04 | 3 |
| HD 198084 | WHT/UES | 4.51 | 1500 | 55,000 | 800 | 2002 Jun 20 | 6171 | 4.13 | 1.90 | 0.15 | 6 |
| HD 200790 | WHT/UES | 5.97 | 2400 | 55,000 | 600 | 2002 Jun 20 | 6240 | 4.26 | 1.70 | 0.02 | 5 |
| HD 210277 | TNG/SARG | 6.63 | 3000 | 57.000 | 400 | 2001 Aug 02 | 5560 | 4.46 | 1.03 | 0.21 | 3 |
| HD 210277 | WHT/UES | 6.63 | 1400 | 55,000 | 400 | 2002 Jun 20 | - | - | - | - | - |
| HD 217107 | WHT/UES | 6.18 | 4800 | 55,000 | 800 | 2001 Oct 03 | 5655 | 4.42 | 1.11 | 0.38 | 2 |
3 Spectrum synthesis and stellar parameters
In this article we used models of atmospheres provided by Kurucz (1992) and the spectrum synthesis code MOOG (Sneden 1973). We have compared abundances of various elements computed with our atmospheric models and with those used by Reddy et al. (1999) (i.e. Kurucz 1995). We found that differences induced in the abundances by the two types of models are less than 0.01 dex and can therefore be neglected. Solar abundances of chemical elements were taken from Anders & Grevesse (And89 (1989)). We have also made an extensive use of the VALD database (Kupka et al. 1999). The parameters of some of the planet host stars listed in Table 1 were slightly updated with respect to the values given in Santos et al. (2001, 2002). Three stars in our sample (HD 1461, HD 198084 and HD 200790) are not known to harbour planets and were observed because of the absence of Li. We have attempted to estimate the parameters of a cool subgiant, HD 137759, from the set of Fe lines used in our previous analysis (Santos et al. San01 (2001)). However, given the low temperature of this object, our final values had large error bars and we have decided to use the parameters based on colours and accurate parallax measurement from Hipparcos (Mallik 1999). Two Li-poor dwarfs, HD 198084 and HD 200790, were taken from Boesgaard et al. (boes01 (2001)). The parameters of HD 200790 were estimated in the same way as for the other stars in our sample. HD 198084 is a metal-rich F8IV-V (Boesgaard et al. boes01 (2001), Malagnini et al. mal00 (2000)) spectroscopic binary (Griffin grif90 (1990)). The iron lines in our spectrum were strongly blended owing to the presence of the second star and we did not make a new estimate of the stellar parameters.
4 The line list in the Li region
Accurate measurements of the wavelengths and oscillator strengths of the Li lines are available in the literature (Sansonetti et al. 1995). Unidentified blends in the Li region of the Sun and other cool stars have been discussed by several authors (Müller, Peytremann & De La Reza mull75 (1975); Lambert, Smith & Heath lam93 (1989); Andersen et al. and84 (1984); King et al. king97 (1997)). Müller et al. (mull75 (1975)) were the first to notice the weak feature at 6708.025 Å in the solar spectrum and attributed it to the Si i line with , = 6 eV. The line list of Lambert et al. (lam93 (1989)) has been extensively discussed and modified by King et al. (king97 (1997)). Following Müller et al. (1975), these authors used a fictitious high excitation Si i line with =6 eV in order to account for the weak absorption in the spectrum synthesis.
The line was also considered by Nissen et al. (1999) in their analysis of metal-poor disc stars. According to Nissen et al. (1999), the equivalent width (EW) of the 6708.025 Å absorption is 0.6 mÅ in the solar spectrum. Reddy et al.’s (red02 (2002)) identification of this absorption with the Ti line (, = 1.88) implies a slightly different value EW = 0.75 mÅ. While this feature is too weak to affect the determination of the Li isotopic ratio in metal-poor halo stars (where it certainly disappears), it may cause problems in solar metallicity or more metal-rich stars. Apart from this unidentified feature, there are other weak lines of Cr i 6707.64 Å, Ce i 6707.74 Å and CN 6707.816 Å with uncertain values. It is interesting that the best synthetic spectra fits to the Li region of different stars can be achieved only by altering the values of these weak lines by different amounts. This led King et al. (king97 (1997)) to propose that various uncertainties in the analysis of the solar spectrum allow Li isotopic ratios as high as 0.1.
Most of the lines in the list of Reddy et al. (red02 (2002)) come from the original compilation of Lambert et al. (lam93 (1989)). However, the Ti i 6707.752 Å line was not listed in any of the references cited by Reddy et al. (red02 (2002)). On the other hand, the V i 6707.563 Å line in the list of Reddy et al. (red02 (2002)) appears under 6707.518 Å in the VALD-2 database (Kupka et al. 1999). The values of many lines have been modified by Reddy et al. (red02 (2002)) in order to fit the solar spectra of Kurucz et al. (1984), Hinkle et al. (2000) and 16 Cyg B. In most cases there is a clear disagreement with the list of King et al. (king97 (1997)), who employed the same spectrum synthesis code, model atmospheres and, as a matter of fact, the same targets (i.e. the Sun and 16 Cyg B). Despite this, King et al. (king97 (1997)) found for CN 6707.816 Å while Reddy et al. (red02 (2002)) arrived at . Futhermore, King et al. (king97 (1997)) have considerably increased the value of a Ce ii line at 6707.74 Å and obtained while Reddy et al. (red02 (2002)) decreased it to 0.8 dex after Lambert et al. (1993) and obtained a value . The V i 6708.07 Å line with from Lambert et al. (lam93 (1989)) appears under V i 6708.094 Å with in the list of Reddy et al. (red02 (2002)). The latter took it from the list available in the web site of R. Kurucz. The values of the Cr i 6707.64 Å line in King et al. (1997) and Reddy et al. (2002) differ by 0.14 dex. The source of these discrepances was not investigated by Reddy et al. (red02 (2002)).
Our own synthesis of the solar spectrum suggests values close to those proposed by King et al. (king97 (1997)). For example, when doing a synthesis of 6Li in HD 82943 (Israelian et al. 2001) we set for the CN 6707.816 Å line, which is similar to , as found by King et al. (1997). In addition to these weak lines, there is a Ti i line at 6707.964 Å with = 1.88 eV and , which appears in the VALD-2 database. This fact probably led Reddy et al. (red02 (2002)) to assume that the feature at 6708.025 Å also belongs to Ti and has a similar excitation energy but much larger oscillator strength. For some reason Reddy et al. (red02 (2002)) did not incorporate the Ti line at 6707.964 Å in their final list. The two Ti i lines at 6708.025 and 6708.125 Å of Reddy et al. (red02 (2002)) have never been tested in stars other than the Sun and 16 Cyg B.
It is clear that the Li line list in the solar spectrum is not well calibrated. Different authors obtain different adjusted values even when they use the same tools and spectra. Our goal is not to make a better fit to the solar Li region since this does not guarantee a unique identification of the spectral lines. Instead, we have decided to use the same list as Reddy et al. (red02 (2002)) and see if we can explain observations of stars other than the Sun and 16 Cyg B.

| Target | Ti ii | Ti ii | [Ti/H] | EWpred(Ti i) | EWobs | [Si/H] | EWpred(Si i) |
|---|---|---|---|---|---|---|---|
| 5418.77 Å | 5336.78 Å | 6708.025 Å | 6708.025 Å | 6708.025 Å | |||
| HD 1461 | 61.0 | 84.1 | 0.18 | 1.1 | 1.60.8 | 0.20 | 1.2 |
| HD 13445 | 38.2 | 61.2 | 0.18 | 1.7 | (1.51.0) | 0.14 | 0.4 |
| HD 16141 | 61.3 | 86.6 | 0.09 | 0.8 | 0.90.5 | 0.10 | 1.0 |
| HD 22049 | 39.7 | 62.8 | 0.17 | 2.0 | (2.00.5) | 0.10 | 0.5 |
| HD 75732A | 58.2 | 80.2 | 0.28 | 3.7 | (31.0) | 0.38 | 1.5 |
| HD 82943 | 61.5 | 82.4 | 0.27 | 0.9 | - | 0.27 | 1.3 |
| HD 130322 | 45.7 | 69.8 | 0.06 | 1.4 | 1.5 | 0.04 | 0.7 |
| HD 134987 | 62.6 | 85.2 | 0.3 | 1.4 | 1.5 | 0.27 | 1.3 |
| HD 137759 | 86.8 | 109.6 | 0.03 | 14.0 | ( 1.5) | 0.18 | 1.3 |
| HD 145675 | 59.4 | 79.6 | 0.42 | 4.5 | (5.51) | 0.42 | 1.6 |
| HD 177830 | 75.1 | 97.4 | 0.28 | 11.0 | ( 2.0) | 0.45 | 1.9 |
| HD 192263 | 43.2 | 64.6 | 0.01 | 4.0 | (1.5) | 0.02 | 0.5 |
| HD 200790 | 63.5 | 89.7 | 0.02 | 0.3 | 0.6 | 0.04 | 0.7 |
| HD 210277 | 58.3 | 81.3 | 0.2 | 1.8 | 1.51.0 | 0.23 | 1.3 |
| HD 217107 | 59.5 | 83.6 | 0.29 | 1.8 | 1.50.5 | 0.37 | 1.7 |
5 The Li region in the Sun and in Arcturus
The unidentified line at 6708.025 Å is clearly seen in the solar spectrum (Fig. 1). In the same figure we show a small spectral window from McDonald’s atlas of a K III giant Arcturus observed with a resolving power 150 000 and S/N 1000 (Hinkle et al. Hin00 (2000)). Most of the absorptions in this small region appear in the spectra of both stars, which have very different temperature, gravity and metallicity. It is interesting that the feature at 6708.025 Å does not become stronger in Arcturus. It may still exist in the spectrum but is severely blended with a strong absorption centred at 6708.094 Å.
The line at 6708.094 Å is certainly not a redshifted Ti i 6708.025 Å of Reddy et al. (red02 (2002)). It also cannot be one of the TiO lines observed in much cooler stars (Luck luck77 (1977)) and taking into account in our synthesis of three cool giants. The wavelength of this line corresponds to the V i at 6708.094 Å in the VALD-2 database and also appears in the list of Reddy et al. (red02 (2002)) but with an oscillator strength that does not fit observations of Arcturus and other cool giants. Both wings of this line are disturbed by blends. The figure also demonstrates that blending is not the only problem in these studies. The exact location of the stellar continuum becomes a critical issue when we deal with absorption features as small as 1 mÅ.


We know that echelle spectra are not calibrated in the absolute flux scale, and that, therefore, the placement of local continuum levels is either visually estimated after fitting the extracted spectra with polynomials, or results from a detailed spectral synthesis. We have marked several points (C1-C6) in Fig. 1. which indicate very narrow windows theoretically free from spectral lines. These windows are used in metal-poor stars to make a fine tuning of the continuum and estimate the S/N. Points C1, C2, C5 and C6 mark the solar continuum fitted by Kurucz et al. (1984). We do not know how the continuum was placed in Arcturus but it appears from the figure that only C5 and C6 can be considered as continuum points. Neither is it clear whether C2 and C4 are continuum points in the solar spectrum. The point C3 lies on the continuum in those stars that do not have CN and Li absorptions at 6707.78 Å. The strength of the unknown line at 6708.025 Å and the V i absorption at 6708.28 Å define whether or not C4 is placed on the local continuum. The region between C2 and the Si i line at 6707.01 Å is depressed in the solar spectrum as well as in the spectra of many other stars probably owing to some weak, still unknown, blends that start to appear in cool and very metal-rich stars (e.g. HD 145675 in Fig. 2). Depending on the exact location of the points C1–C6 one may derive different EW values for the unidentified feature at 6708.025 Å. However, as we will show below, even this uncertainty does not smear the huge differences between observations and spectrum synthesis when the Ti line of Reddy et al. (red02 (2002)) is considered.
6 The spectral feature at 6708.025 Å
6.1 The Ti i line of Reddy et al. (2002)
Let us investigate how the Ti i 6708.025 Å line of Reddy et al. (red02 (2002)) fits our observations. We have computed Ti abundance in the sample of metal-rich stars (Table 1) using two lines of the ionized Ti from Santos et al. (2000). The EWs of these lines and derived abundances are listed in Table 2. The difference in abundance from the two lines was always less than 0.03 dex. Our tests with the neutral Ti i lines from Santos et al. (2000) showed that the abundances derived from Ti i and Ti ii agree within 0.1 dex in F8–G2 stars while there is a systematic difference at lower temperatures. The abundances obtained from the Ti ii lines are about 0.1–0.15 dex smaller than those derived using Ti i. Because of a small non-LTE effect on Ti i, the use of Ti ii lines is preferred (N. Shchukina 2002, personal communication). In addition, the abundances derived from Ti ii lines are insensitive to the errors in (Santos et al. 2000). In any case, even if we suppose that our Ti abundances are uncertain by up to 0.3 dex (which is very unlikely, given the errors considered in this work), this will not change our final conclusion regarding the reliability of the line proposed by Reddy et al. (red02 (2002)).
Using the abundances from the Ti ii lines, we have estimated the EW of the feature at 6708.025 Å, assuming that it belongs to the line proposed by Reddy et al. (red02 (2002)). Predicted and observed EWs of the Ti line are listed in Table 2. We see an obvious disagreement at low : the predicted line is much stronger than the observed one. In Fig. 2 we show spectrum synthesis for three metal-rich stars with different parameters. The abundances of V, C, Si and other elements were scaled with Fe and then modified by small amounts (always less than 0.1 dex) in order to fit the observations. HD 217107, with K, is more similar to the Sun than the two other stars and apparently for this reason the agreement between predicted and observed profiles of 6708.025 Å is good. There is small room for making adjustments in continuum level in order to accommodate [Ti/H] = 0.3 and fit the observations. This plot alone cannot be used to argue against the identification proposed by Reddy et al. (red02 (2002)). As a matter of fact, the observed and predicted EWs of the Ti line agree within errors in HD 217107 (Table 2). The discrepancy is larger in cooler objects HD 145675 and HD 75732A. We also note that the centre of the Ti line is slightly shifted to the blue in the spectrum of HD 145675. This shift and the disagreement between predicted and observed EW become much larger when we study K-type stars (Fig. 3). One of our targets is the well-known red giant Arcturus. The atmospheric parameters and the abundances of elements in this star were taken from the literature (Peterson et al. 1993). This figure demonstrates that the predicted Ti line becomes strong and its wavelength clearly does not correspond to the absorption observed at 6708.094 Å. Although our computations rule out the [Ti/H] ratios 0.2 and 0.4 (thin continuous lines in Fig. 3) considered by us as the lower limits in the synthesis of HD 177830 and HD 137759, we provided them in order to show the wavelength shift between the fictitious Ti line and the absorption at 6708.094 Å. These plots clearly demonstrate that the feature at 6708.025 Å disappears at low temperatures while a different line at 6708.094 Å (not clearly observed in the solar spectrum) becomes stronger. The wavelength of this line corresponds to V i in the VALD-2 database. Two lines at 6708.025 and 6708.094 Å appear as a single absorption feature in stars with = 5000–5400 K. It should be possible to separate them in very high resolution and high S/N spectra of stars with intrinsically narrow absorption lines.
When estimating the EW of the Ti line in HD 82943 we found another disagreement with Reddy et al. (red02 (2002)), who state that the combined strength of the two Ti i lines (6708.025 and 6708.125 Å) in the spectrum of HD 82943 is 2.2 mÅ, while our analysis using exactly the same tools and parameters shows 1.1 mÅ, in which the 6708.125 Å line contributes only 0.2 mÅ. The same disagreement appears when we consider the solar spectrum. Using the list of Reddy et al. (red02 (2002)), we found that the EWs of the Ti i lines at 6708.025 and 6708.125 Å are 0.75 and 0.17 mÅ, respectively. Thus, the combined EW = 0.92 mÅ is at odds with the 1.5 mÅ claimed by Reddy et al. (red02 (2002)).


6.2 Identifying the line
We have attempted a new identification of the 6708.025 Å feature knowing that the strength of the line does not increase towards cooler temperatures. It is clear that any molecular or a low excitation line from a neutral metal will behave like the Ti line of Reddy et al. (red02 (2002)). Since this is not observed, we are left with two possibilities. Either the transition belongs to an ion, or it is produced by a neutral element with a high excitation energy of the lower level.
The most abundant ions at these temperatures belong to Fe, Si, Mg, Ca and Ti. Reliable experimental line lists exist for all of these ions and are available in VALD-2. Most of the Si ii linesin the Li region have very high excitation energies of between 10–16 eV. The same is true for Mg ii ( = 11–13 eV) and Ca ii ( = 7–9.7 eV). Ti ii has several transitions with = 1.9–3.1 eV. A Ti ii line with = 1.9 eV and will reproduce the solar feature with EW = 0.75 mÅ. This line will also fit the spectra of the coolest objects in our sample, such as HD 137759 and HD 177830, where it will be weaker than 2 mÅ. In HD 82943 it will have EW = 1.1 mÅ, which is not really different from the strength of the neutral Ti line (0.9 mÅ). However, small discrepancies may appear in hotter stars. For example, given the Ti abundance in HD 200790, we anticipate about 1 mÅ absorption which we think is not observed in the high S/N spectrum (Fig. 4). The marginal feature observed at 6708.028 Å is about 0.6 mÅ and it is hard to judge by eye if it is real. On the upper panel of the same graph we show the spectrum of HD 198084. Unfortunately, this star is in a binary system and we cannot make any strong statements regarding the strength of the unidentified absorption. However, we would still expect to see the blend of two unidentified lines at 6708.025 Å. In fact, there is a broad absorption around 6708.0 Å, most probably caused by the shifted unidentified lines but its EW does not exceed 1 mÅ.
We have studied a spectrum of the hot Li-poor star HR 7697 (=6588 K, = 4,24, [Fe/H] = 0.01) with S/N 550 kindly provided by Ann Boesgaard (Boesgaard et al. 2001). The ionized line of Ti in this object would produce about 1 mÅ absorption, which we could not find in the data. These tests make the idea of an ionized Ti line less attractive, although, given the errors in the data and our analysis, we still cannot completely rule out this possibility. We also note that it will be much harder to identify the line if it belongs to an ion of an element whose abundance does not scale with Fe.
Rare Earth elements were also considered. The best candidates are perhaps two Ce ii lines listed in the DREAM database (http://www.umh.ac.be/ astro/dream.shtml) with wavelengths 6708.077 and 6708.099 Å. The lines are weak ( and ) and have excitation energies = 2.25 and 0.7 eV, respectively. Let us suppose that the 6708.077 Å line is responsible for the feature at 6708.025 Å. The 6708.077 Å absorption is absolutely negligible in the solar spectrum, and in order to produce 0.7 mÅ it must have . This very large correction is not allowed by accurate radiative lifetime measurements (Zhang et al. 2001). If we still suppose that the adjustment is possible, these two lines will produce about 4 mÅ absorption in Arcturus. However, the synthetic spectra will not reproduce the observed profile at 6708.094 Å unless we modify the wavelengths. In brief, we can hardly force these two lines of Ce ii to explain observations.
| Wavelength (Å) | EW(mÅ) | [Si/H] | ||
|---|---|---|---|---|
| 5665.56 | 4.92 | 1.980 | 53.5 | 0.27 |
| 5690.43 | 4.93 | 1.790 | 62.8 | 0.22 |
| 5701.10 | 4.93 | 2.020 | 52.2 | 0.30 |
| 5772.14 | 5.08 | 1.620 | 69.8 | 0.28 |
| 5793.09 | 4.93 | 1.910 | 57.3 | 0.26 |
| 5948.55 | 5.08 | 1.110 | 109.7 | 0.26 |
| 6125.02 | 5.61 | 1.520 | 46.1 | 0.26 |
| 6142.49 | 5.62 | 1.480 | 50.9 | 0.29 |
| 6145.02 | 5.61 | 1.400 | 54.9 | 0.25 |
| 6155.15 | 5.62 | 0.750 | 113.0 | 0.27 |
| 6721.86 | 5.86 | 1.090 | 65.4 | 0.26 |
Our synthetic spectra also demonstrate that the values of V i lines at 6708.094 and 6708.280 Å in the list of Reddy et al. (red02 (2002)) do not explain observations of HD 137759, HD 177830 and Arcturus (Fig. 3) assuming that the abundance of V scales with Fe (Sadakane et al. 2002). Our tests show that even adopting [V/Fe] = 0.5 in these stars, we still cannot fit the feature at 6708.280 Å. Such low abundances of V are excluded from the analysis of other spectral lines. On the other hand, the fit to the same line in HD 82943 was achieved by boosting the abundance to [V/H] = 0.8. This high value is ruled out from a synthesis of different V i lines. We faced similar problem for the line at 6708.094 Å but in the opposite direction. The newly added Ti i line at 6708.125 Å in the list of Reddy et al. (red02 (2002)) cannot salvage the situation as it appears too weak in our targets. We also note that the V i line at 6708.280 Å does not appear in the VALD-2 database (Kupka et al. 1999).
6.3 The Si i line of Müller et al. (1975)
Given the large number of high excitation Si lines in the Li region (see VALD-2 database), we have decided to test if the Si line at 6708.025 Å proposed by Müller et al. (mull75 (1975)) can explain our observations. In fact, the high excitation Si line that appears at 6707.01 Å (Fig. 1) is very similar to the one proposed by Müller et al. (mull75 (1975)). It behaves exactly in the same way in stars with different temperatures as the absorption at 6708.025 Å. Given the EW (= 0.75 mÅ) of the 6708.025 Å feature in the solar spectrum, we have estimated for the Si i line with = 6 eV proposed by Müller et al. (mull75 (1975)). Our value is slightly different from that of Müller et al. (mull75 (1975)) owing to the differences in the model atmospheres and the adopted abundance of Si (Anders & Grevesse And89 (1989)), which is 0.05 larger than the value used by Müller et al. (mull75 (1975)). We have computed the Si abundance in our stars using the lines from Bodaghee et al. (2003) listed in Table 3. The new list is an extended and improved version of the one considered by Santos et al. (San00 (2000)). The abundance errors were always less than 0.07 dex and do not affect our analysis. Predicted EWs of the Si line are listed in the last column. As we can see, there is good agreement between observations and synthesis.
In conclusion, we think it is more likely that the spectral feature at 6708.025 Å belongs to a high excitation transition of some neutral atom. The small spectral window near 6708 Å contains many high excitation Si lines; therefore, the identification proposed by Müller et al. (mull75 (1975)) seem to be the best choice. However, we cannot rule out the possibility that the 6708.025 Å line belongs to an ion or to a rare element. More high quality observations are necessary to tackle this problem.
7 The 6Li/7Li ratio in HD 82943
HD 82943 was newly observed at VLT/UVES with a resolving power 105 000 and a signal-to-noise ratio close to 1000. Reanalysis of the 6Li/7Li ratio has been carried out using the same tools as in Israelian et al. (2001) and the line list of Reddy et al. (red02 (2002)). The only change we have made in this list is a replacement of the Ti i line at 6708.025 Å by the high excitation Si i line with and = 6 eV. This change does not help in giving a higher 6Li/7Li ratio in HD 82943 since the EW of the Si i line in HD 82943 is even larger than that of the Ti of Reddy et al. red02 (2002) (see Table 2). Furthermore, an accurate abundance of Si in HD 82943 needs to be calculated. For this purpose we have used eleven Si lines from Table 3 and computed their EWs using very high S/N spectra obtained with VLT/UVES and WHT/UES. In Table 3 we list the lines, measurements and resulting abundances. We found [Si/H] = 0.27 0.02 in excellent agreement with the value given by Sadakane et al. (sad02 (2002)) after accounting for differences in stellar parameters.
The identification of the chemical element is also important, although Reddy et al. (red02 (2002)) have ignored this point by stating that the identification of the pair as Ti i is not critical to the analysis. The EWs of the Ti line of Reddy et al. (red02 (2002)) are 0.45 and 0.9 mÅ in HD 82943 for [Ti/H] = 0 and [Ti/H] = 0.3, respectively. This factor of 2 difference in the EWs is equal to 0.05 correction in 6Li/7Li ratio if the total EW of the Li line is 10 mÅ. This is a significant difference, and given the fact that in many stars [Ti/H] can be larger than 0.3, the abundance correction may affect the 6Li/7Li ratios by at least 0.03 dex, depending on the strength of the 7Li line.
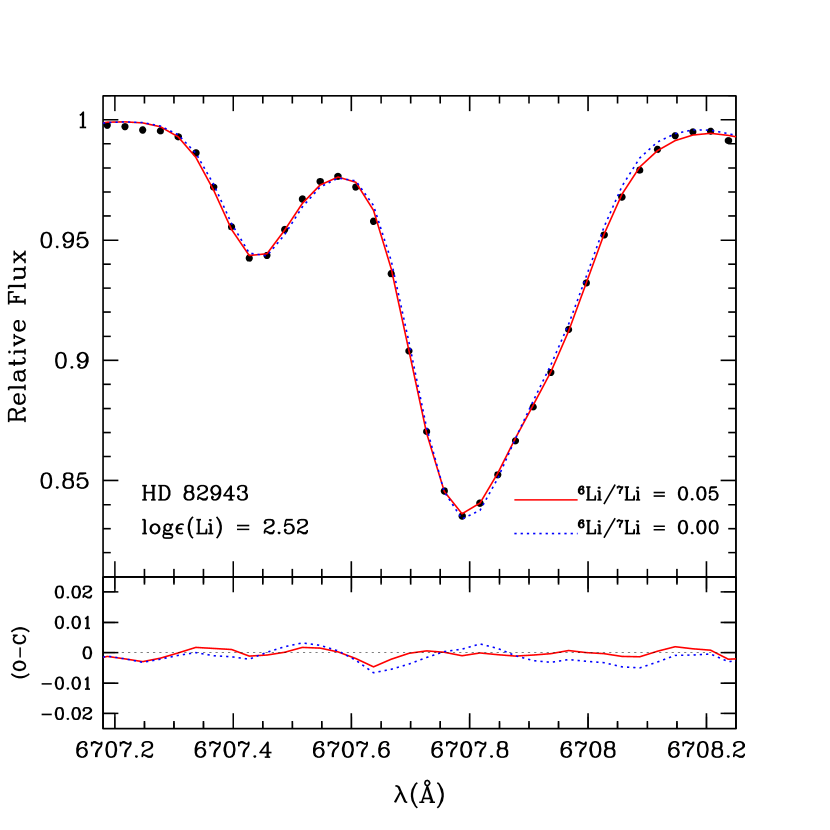
To demonstrate the blending of the Si and CN lines in the Li feature of HD 82943, we have computed synthetic spectra without considering any of the Li isotopes. Figure 5 shows that CN and Si make a significant contribution to the total EW of the Li line. Given the high C and N content of HD 82943 (Santos et al. San00 (2000), Sadakane et al. sad02 (2002)) one may consider the abundances of these elements as free parameters in the analysis. The strength of the Si line may affect the synthesis as well. It is also important to realize that this line cannot exactly mimic the 6Li component at 6708.0728 Å because their wavelengths differ by 0.05 Å.
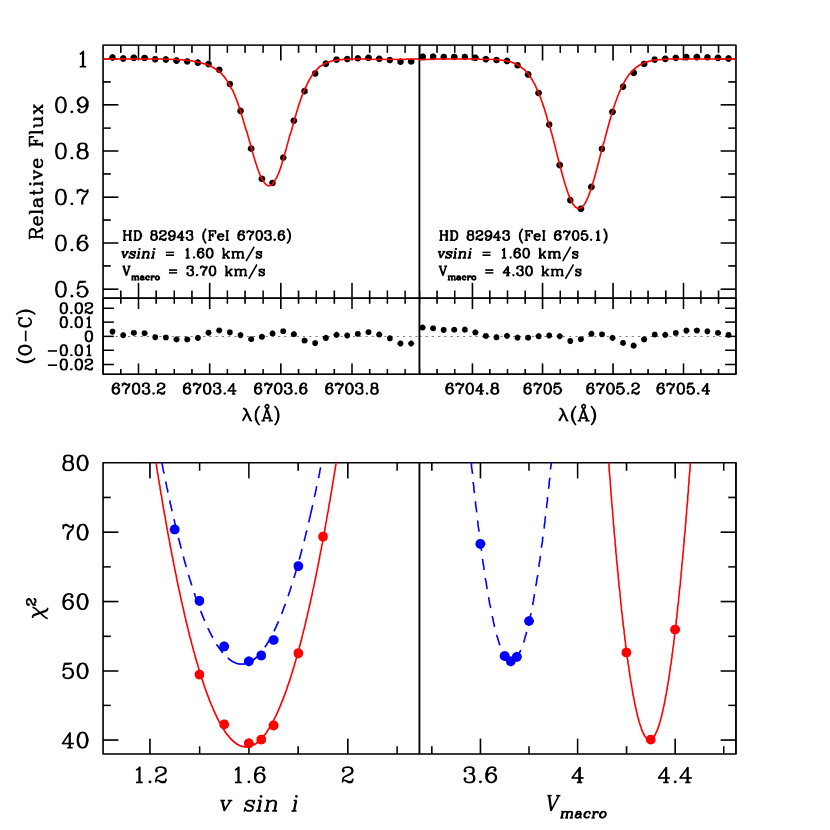
In obtaining the broadening parameters we used the same Fe i lines as in our first paper (Israelian et al. isr01 (2001)). From the analysis of two Fe lines (Fig. 6) we obtained a mean = 1.6 0.05 km s-1 and = 4 0.3 km s-1, in good agreement with our previous results and also with those of Reddy et al. (red02 (2002)). The synthetic spectra were also convolved with a Gaussian function representing the instrumental profile. Given the low rotational velocity in HD 82943, it is possible to obtain fits using simple Gaussian functions. As we have noticed before (Israelian et al. isr01 (2001), see also Reddy et al. red02 (2002)), the final values of 6Li/7Li are not affected by using a pure Gaussian broadening function. Average broadening parameters obtained from the Fe lines were used to derive the 6Li/7Li ratio.
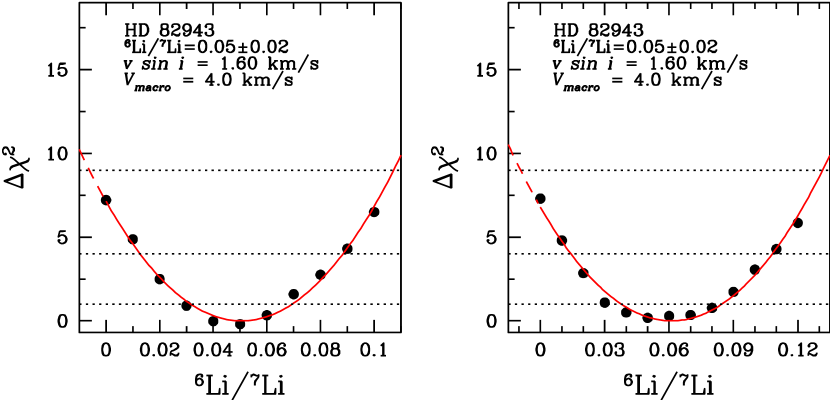
The free parameters in a standard analysis of the 6Li/7Li ratio in HD 82943 were the total abundance of Li, the wavelength shift, the 6Li fraction and the position of the continuum. The final 6Li/7Li ratio is not strongly affected by the blue CN absorption, and after few a iterations we fixed the CN abundance equal to [C/H] = [N/H] = 0.35. Small adjustments of the continuum level not exceeding 0.2 (given the S/N of the spectrum) were allowed to optimize the fits. The abundance of the Si line was also considered as a free parameter in the range [Si/H] = 0.27 0.1 but after a few iterations it was fixed to [Si/H] = 0.27. Additional computations were carried out allowing for large variations of and exceeding the 3 limit derived from the Fe lines. We found that these effects do not change our final results. The minimum was derived by optimizing all free parameters for each value. The new analysis using Reddy et al.’s (red02 (2002)) line list and the Si line yields (6Li) = 0.05 0.02 (Fig. 8, left panel). The best fit for (6Li) = 0 has an rms of 2.869 10-3, which is significantly larger than the rms (9.91 10-4) of the best fit with (6Li) = 0.05. Wavelength offsets in the best fits for (6Li) = 0 and (6Li) = 0.05 were 0.65 km s-1 and 0.44 km s-1, respectively. These values agree perfectly with those reported by Cayrel et al. (1999) in their 6Li/7Li analysis of the halo star HD 84937. The synthetic and the observed profiles for two cases are shown in Fig. 7. Given the strength of the Li line (about 50 mÅ), these shifts are consistent with observations of Fe lines in the solar spectrum (Allende Prieto & García López all98 (1998)). Since the scatter of the velocity shifts of Fe lines in the solar spectrum is large (ranging from 0.8 to 0.2 km s-1), one cannot make any predictions for the blueshifts of the Li lines based on a statistical trend observed for the solar Fe lines. So the best option still remains to keep the wavelength shift of the Li line as a free parameter.
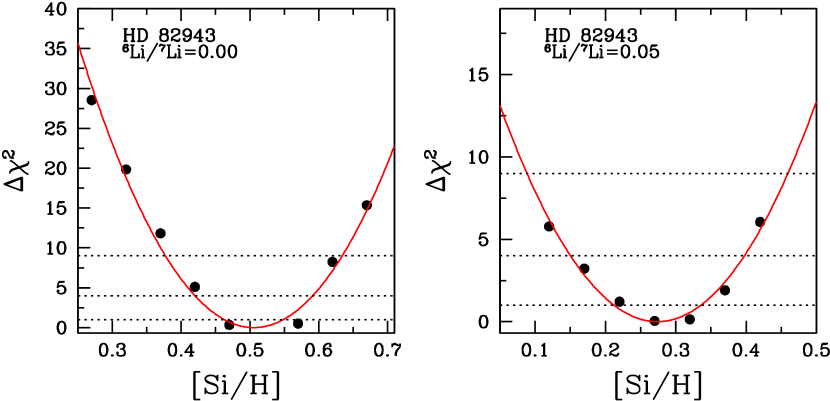
The minimum is not affected by large variations in the continuum either. Relaxing the upper limit of continuum change from 0.2 to 0.5 does not change our conclusion (Fig. 8, right panel). The final value of (6Li) is also not sensitive to the Si abundance. If we repeat the analysis fixing the continuum but changing the abundance of Si, we will find that the best fit to the observed profile is achieved for [Si/H] = 0.27 (Fig. 9, right panel). The same analysis for (6Li) = 0 yields [Si/H] = 0.51 (Fig. 9, left panel). Such a high abundance of Si is ruled out by our data. However, even if we assume that it is possible, the quality of the fit when (6Li) = 0.05 and [Si/H] = 0.27 is about 4 times better (i.e. is smaller) compared with the case when (6Li) = 0.0 and [Si/H] = 0.51. On the other hand, the Si i line may suffer from convective blueshifts as well. To account for this effect, we have repeated the analysis considering the wavelength of the Si line as another free parameter. We found that the effect is very small. For example, when (6Li) = 0.05, the 8 mÅ wavelength shift will introduce a negligible change in of about 5. This would also imply a small increase in the Si abundance equal to [Si/H] = 0.31. These changes do not affect our final results.
Reddy et al. (red02 (2002)) noted in their paper that the Ti lines contribute 2.2 mÅ (while our own estimate is EW = 1.1 mÅ) into the 50 mÅ Li line, which, according to these authors, corresponds to 6Li/7Li = 0.06. Given that without this blend the ratio was 6Li/7Li = 0.12 (Israelian et al. isr01 (2001)), one should wonder what is causing the remaining 0.06 contribution. If the contribution of the blend is only 0.06, then we are still left with another 6Li/7Li = 0.06. The blended line is not strong enough to completely eliminate the contribution from 6Li. Although Reddy et al. (red02 (2002)) have stated that our spectra agree very well, they did not explore this puzzle.
In order to judge the validity of our spectral synthesis and the placement of the stellar continuum, we have synthesized spectra of Cen A and HD 82943 in the 7 Å region near the Li doublet (Fig. 10). Observations of Cen A with a resolving power of 105.000 are taken from Rebolo et al. (1986) and have S/N 500 in the Li region. As stellar parameters for Cen A we have adopted = 5800 K, = 4.31, = 1.1 km s-1, [Fe/H] = 0.24 (Chmielewski et al. 1992) and abundances were taken from the literature (Abia et al. 1988; Santos et al. 2000; Chmielewski et al. 1992; King et al. 1997).

Given that we are not able to make a unique identification of the chemical element responsible for the blend, the 6Li/7Li found from the analysis cannot not be considered to be a final value. The abundance of Si usually scales with Fe in planet host stars (see for example Santos et at. San00 (2000); Gonzalez et al. Gon01 (2001); Sadakane et al. sad02 (2002); Takeda et al. tak01 (2001)). However, if the spectral line belongs to an element which is under- or overabundant with respect to Fe, then the 6Li/7Li ratio will be different. In most cases the elemental abundances are not very different from that of Fe (typically within 0.1 dex) and therefore the overall effect on the 6Li/7Li ratio will not be large.
8 Conclusions
High quality observations of metal-rich stars with undetectable Li have essential consequences, first for the identification of weak lines in the Li 6708 Å region, and second for the analysis of the 6Li/7Li isotopic ratio. Our results clearly rule out the Ti i line at 6708.025 Å suggested by Reddy et al. (red02 (2002)). Alternatively, we propose that this feature can be attributed to the Si i line of Müller et al. (1975). The identification and the presence of another Ti i line at 6708.125 Å in Reddy et al. (2002) line list is also not justified and cannot be verified with our dataset as this line is extremely weak in all our targets. We also find that two lines of V i at 6708.094 and 6708.280 Å from the same list have incorrect parameters. However, these V i lines and the Ti i line at 6708.125 Å cannot strongly affect the 6Li/7Li ratio in stars with 5500 K.
Our analysis of the new VLT/UVES spectra (S/N=1000), taking into consideration the Si i line at 6708.025, gives an isotopic ratio 6Li/7Li = 0.050.02 in HD 82943. This implies a contribution to the total absorption in the Li region of 1.3 mÅ and 2.7 mÅ due to Si i and 6Li, respectively. If no Si i blend is considered in the analysis we obtain 6Li/7Li=0.08, which is 33 smaller than the value obtained in our first analysis (Israelian et al. 2001) based on a spectrum with S/N=500. Since 6Li can be construed as a fossil record of rocky matter accretion during planetary system formation, further high quality observations of this fragile isotope may offer us a unique and invaluable insight into the past dynamical history of extra-solar planetary systems.
Acknowledgements.
We would like to thank Drs Roger Cayrel, Yoichi Takeda, Poul Eric Nissen, Johannes Andersen, Eric Sandquist, Lew Hobbs, Eswar Reddy and David Lambert for several helpful discussions. Ann Boesgaard has kindly provided us with her spectra of Li-poor stars. We also thank Jonay Gonzalez Hernandez for reducing several WHT/UES spectra used in this article and Carlos Allende Prieto for providing us with the McDonald Atlas of Arcturus. We are grateful to the referee Dr Ruth Peterson for several helpful comments and suggestions.References
- (1) Abia, C., Rebolo, R., Beckman, J. E. & Crivellari, L. 1988, A&A 206, 100
- (2) Allende Prieto, C. & García López, R. 1998, A&AS 129, 41
- (3) Anders E., Grevesse N., 1989, Geochim. et Cosmochim. Acta 53, 197
- (4) Andersen, J., Gustafsson, B. & Lambert, D. L. 1984 A&A 136, 65
- (5) Bodaghee, A., Santos, N. C., Israelian, G. & Mayor, M. 2003, A&A, in press
- (6) Boesgaard, A., Deliyannis, C., King, J. & Stephens, A. 2001 ApJ 553, 754
- (7) Brault, J. & Müller, E. 1975, Solar Physics 41, 43
- (8) Cayrel, R. 1988, in ”The impact of Very High S/N Spectroscopy on Stellar Physics”, Cayrel de Strobel, G. & Spite, M. (eds.), Dordrecht, Kluwer, 345
- (9) Cayrel, R., Spite, M., Spite, F., Vangioni-Flam, E., Cassé, M. and Audouze, J. 1999, A&A 343, 952
- (10) Chmielewski, Y., Friel, E., Cayrel de Strobel, G. & Bentolila, C. 1992, A&A, 263, 219
- (11) Forestini, M. 1994, A&A 285 473
- (12) Gonzalez G., Laws, C., Tyagi, S. & Reddy, B. E. 2001, AJ 285, 403
- (13) Griffin, R.. 1990, Observatory 119, 272
- (14) Hinkle, K., Wallace, L., Valenti, J. & Harmer, D., 2000, Visible and Near Infrared Atlas of the Arcturus Spectrum 3727-9300 Å, ed. Hinkle, K., Wallace, L., Valenti, J. and Harmer, D., ASP, San Francisco
- (15) Hobbs, L. M., Thorburn, J. A. & Rebull, L. 1999, ApJ 523, 797
- (16) Israelian, G., Santos N., Mayor M. & Rebolo, R. 2001, Nature 411, 163
- (17) King, J., Deliyannis, C., Hiltgen, D., Stephens, A., Cunha, K. & Boesgaard, A. 1997, AJ 113, 1871
- (18) Kupka F., Piskunov N., Ryabchikova T., Stempels H., Weiss W.W. 1999, A&AS 138, 119
- (19) Kurucz, R. L. 1992, private communication
- (20) Kurucz, R. L., Furenlid, I., Brault, J., & Testerman, L. 1984, Solar Flux Atlas from 296 to 1300 nm, NOAO Atlas No. 1
- (21) Lambert, D., Smith, V. V. & Heath, J. 1993, PASP 105, 568
- (22) Luck, E. 1977, ApJ 218, 752
- (23) Malagnini, M., Morossi, C., Buzzoni, A. & Chavez, M. 2000, PASP 112, 1455
- (24) Mallik, S., 1999, A&A 352, 495
- (25) Montalbán, J. & Rebolo, R. 2002, A&A 386, 1039
- (26) Müller, E. A., Peytremann, E. & De La Reza, R. 1975 Solar Physics 41, 53
- (27) Nissen, P. E., Lambert, D., Primas, F. & Smith, V. 1999, A&A 348, 211
- (28) Peterson, R., Dalle Ore, C. & Kurucz, R. 1993, ApJ 404, 1993
- (29) Rebolo, R., Crivellari, L., Castelli, F., Foing, B. & Beckman, J. E. 1986, A&A 166, 195
- (30) Reddy, B., Lambert, D., Laws, C., Gonzalez, G. & Covey, K. 2002, MNRAS 335, 1005
- (31) Sadakane, K., Ohkubo, M., Takeda, Y., Sato, B., Kambe, E. & Aoki, W. 2002, PASJ, 54, 911
- (32) Sandquist E.L., Dokter J. J., Lin D.N.C., Mardling, R. 2002, ApJ 572, 1012
- (33) Sansonetti, C. J., Richou, B., Engleman, R., Jr. & Radziemski, L. 1995, Phys. Rev. A, 52, 2682
- (34) Santos N.C., Israelian, G., Mayor M., 2000, A&A 363, 228
- (35) Santos N.C., Israelian, G., Mayor M., 2001, A&A 373, 1019
- (36) Santos N.C., García Lopez, R., Israelian, G. et al. A&A 2002, 386, 1028
- (37) Santos N.C., Israelian, G., Mayor M., Rebolo, R. & Udry, S. 2003, A&A, 398, 363
- (38) Sneden C., 1973, Ph.D. thesis, University of Texas
- (39) Takeda, Y., Sato, B., Kambe, E. et al. 2001, PASJ 53, 1211
- (40) Zhang, Z., Svanberg, S., Jiang, Z., Palmeri, P., Quinet, P. & Bi mont, E. 2001, Phys. Scr. 63, 122