Distribution of the Galactic Bulge emission at according to the RXTE Galactic Center scans
We present an analysis of the Galactic bulge emission observed by the RXTE/PCA during a set of scans over the Galactic Center field, performed in 1999-2001. The total exposure time of these observations is close to 700 ksec. We construct the distribution of Galactic ridge emission intensity and spectral parameters up to Galactic latitudes . We show that the intensity distribution of the ridge emission at could be well described by an exponential model with e-folding width . Best-fit spectral parameters do not show statistically significant changes over Galactic latitude
Key Words.:
accretion, accretion disks– black hole physics – instabilities – stars:binaries:general – X-rays: general – X-rays: stars1 Introduction
Galactic ridge emission was detected by the rocket experiment in 1972 ( Bleach et al. (1972)). It was noted that there exists an excess in X-ray emission (1.5 keV) around the Galactic plane with an extent about 2-4∘. Since then, various satellites were used to study this emission, HEAO1 (Worrall et al. (1982)), EXOSAT (Warwick et al. (1985)), Tenma (Koyama et al. 1986a ), GINGA (Yamasaki et al. (1997)), ASCA (Kaneda et al. (1997)), RXTE (Valinia & Marshall (1998)) and Chandra (Ebisawa et al. (2001)).
The observation of the ASCA and Chandra observatories seem to rule out the hypothesis of dominant dim point source contributions to the observed ridge emission (see Ebisawa et al. (2001)). Therefore it is believed that it has a diffuse origin.
The discovery by the Tenma satellite of strong 6.7 keV line emission in the spectrum of the Galactic plane made it possible to suggest that the bulk of this Galactic ridge emission in the energy range 1–10 keV is due to an optically thin plasma of temperature of a few keV. Accurate measurements of the ridge spectrum made by ASCA also revealed lines from some other elements, Mg, Si, S, Ar, which also supports the thermal origin of the emission. However, this hypothesis also encounters serious problems. One of the most general problems is connected with the fact that the deduced parameters of the optically thin plasma implies that it is impossible to bound such plasma within Galactic plane (see e.g. Townes (1989)) and also it is very hard to provide enough energy for such plasma. There are also serious problems with the approximation of the energy spectra of the ridge emission within the framework of its thermal origin (Tanaka (2000)). These complications together with the detection of the presumably non-thermal tail in the spectrum of the Galactic ridge emission (see e.g. Yamasaki et al. (1997), Skibo et al. (1997), Valinia & Marshall (1998)) gives rise to the additional interpretation, in which the X-ray line emission was considered to originate through charge-exchange interactions of low-energy cosmic ray heavy ions (e.g. Tanaka et al. (1999), Tanaka (2000)), while the hard power-law tail appears as a result of nonthermal bremsstrahlung emission of cosmic ray electrons and protons (e.g. Dogiel et al. (2002)).
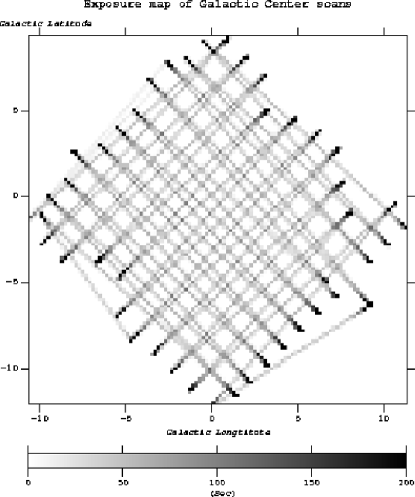
For the understanding of the origin of the Galactic ridge emission it is important to know the distribution of its flux and parameters over the Galaxy. Such a study has been previously carried out using different satellites (e.g. HEAO1, Worrall et al. (1982); Iwan et al. (1982), GINGA; Yamasaki et al. (1997), RXTE Valinia & Marshall (1998)), but now we could for the first time use relatively uniform coverage of the central 10∘ degrees. This became possible because of the large campaign of RXTE Galactic Center scans, organized by the RXTE team. In this paper we analyze public data of RXTE Galactic center scans from March 1999 till July 2001.
2 Analysis
For our analysis we used approximately 150 sequences of 3200 Galactic Center observations (each set of Galactic center scan sequences usually consists of 22 individual observations) performed from March 1999 till July 2002. The total exposure of all these observations is approximately 700 ksec. We divided these data into two parts, depending on high voltage epoch of PCA, which determines the energy response of the instrument: Apr.1999– May 13. 2000 (Epoch4) and May 14, 2000-July 2001 (Epoch 5).
For the data analysis we used a set of standard procedures of the LHEASOFT 5.2 package. In order to increase our sensitivity for photons with energy 10 keV we used all three layers of the PCA. As we are interested in the measurement of low fluxes we used the “L7_240” model for the PCA background estimation. This model includes an instrumental background as well as the Cosmic X-ray background (CXB) term. The influence of interstellar absorption in the direction of Galactic Center could be important at low . However, in the subsequent analysis we will restrict ourself to where the interstellar absorption is negligible in our bandpass ( keV). Under these condition, extinction of CXB in the interstellar medium is estimated to be at most 10 1990), thus can be ignored.
According to the latest calibration information the systematic uncertainty of the flux obtained with the help of the background model used is considered to be within 1–1.5% (see RXTE GOF web page. http://heasarc.gsfc.nasa.gov/docs/xte/xhp_proc_analysis.html). Therefore in our analysis we included 1.5% (of the background count rate in the considered energy range) uncertainty in the measurements.
| l | b | Source |
|---|---|---|
| -9.812 | -0.861 | XTEJ1723-376 |
| -8.527 | -0.548 | EXO1722-363 |
| -7.943 | 2.746 | 4U1711-339 |
| -7.831 | -0.272 | AXJ172642-3540 |
| -6.596 | -3.386 | XTEJ1743-363 |
| -6.469 | -5.005 | 4U1746-371 |
| -6.398 | -0.827 | 1RXSJ173251.1-344728 |
| -5.698 | -0.150 | 4U1728-34 |
| -5.604 | 1.257 | 1RXSJ172635.1-325842 |
| -5.159 | -0.158 | MXB1730-33 |
| -4.978 | 3.346 | 1RXSJ172006.1-311702 |
| -4.611 | -8.151 | SAXJ1808.4-3658 |
| -3.681 | 2.298 | TERZAN2 |
| -3.633 | 6.931 | XTEJ1710-281 |
| -3.378 | 0.219 | AXJ173628-3141 |
| -3.184 | -2.976 | SL1746-331 |
| -2.875 | -1.607 | H1741-322 |
| -2.530 | 7.911 | XTEJ1709-267 |
| -2.442 | 0.989 | XB1732-304 |
| -1.892 | 0.520 | XTEJ1739-302 |
| -1.154 | 1.393 | GRS1734-292 |
| -0.880 | -0.101 | 1E1740.7-2942 |
| -0.860 | -2.908 | XTEJ1755-312 |
| -0.744 | -0.911 | SLX1744-300/299 |
| -0.441 | -0.389 | 2S1742-294 |
| -0.155 | -3.126 | XTEJ1757-306 |
| -0.135 | 8.741 | 1RXPJ171236-2414.7 |
| 0.535 | 9.278 | 2RXPJ171220.5-232345 |
| 0.667 | -0.036 | SGR B2 |
| 0.676 | -0.222 | XTEJ1748-288 |
| 0.785 | 2.398 | SLX1735-269 |
| 1.074 | 3.655 | KS1731-260 |
| 1.119 | -1.028 | X1749-285 |
| 1.530 | -11.371 | R1832-330 |
| 1.937 | 4.795 | GX1+4 |
| 2.294 | 0.794 | GX3+1 |
| 2.788 | -7.914 | 4U1820-30 |
| 2.862 | -0.680 | 1RXSJ175454.2-264941 |
| 3.840 | 1.463 | HA1745-248 |
| 4.508 | -1.362 | GRS1758-258 |
| 4.765 | 0.608 | 2E1751.1-2431 |
| 4.790 | 3.316 | XTEJ1744-230 |
| 5.077 | -1.019 | GX5-1 |
| 6.141 | -1.904 | 2S1803-245 |
| 6.381 | -0.120 | E1757.5-2330 |
| 6.756 | -4.798 | SAXJ1819.3-2525 |
| 7.554 | 0.853 | XTEJ1759-220 |
| 7.729 | 3.802 | NGC6440 |
| 8.151 | -0.712 | SAXJ1806.5-2215 |
| 9.077 | 1.154 | GX9+1 |
| 9.275 | -6.081 | GS1826-238 |
| 9.996 | -0.141 | AXJ180816-2021 |
| 11.068 | -0.627 | 1RXPJ181217-1939.4 |
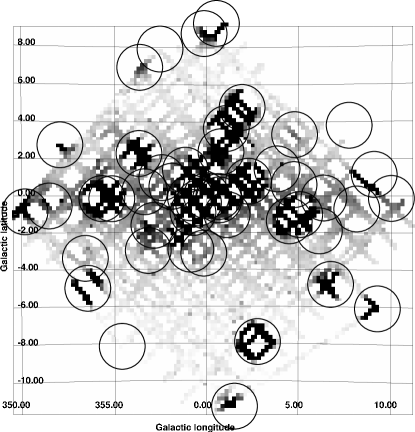
The map of the Galactic center region, reconstructed from scans performed during epoch 4 (March 1999 - May 2000) is presented in Fig. 1. The map represents the flux measured by PCA in the direction to which the center of the PCA field of view was pointed. Any point source on the map contributes to a sky region around it in accordance with the response of the RXTE/PCA collimator. Combining information from available X-ray catalogs of bright sources (Wood et al. (1984), Liu et al. (2000), Liu et al. (2001), Voges et al. (1999), Sugizaki et al. (2001)) with the analysis of the obtained map, we have selected a set of sources that can significantly contribute to the observed flux in the region of the scans. A list of the selected sources is presented in Table 1. Note that in our analysis the identification of sources in crowded regions, like in the immediate vicinity of the Galactic Center, is quite complicated and therefore might not be exact.
In order to separate the contribution of bright point sources from the Galactic ridge emission we excluded areas with a radius of 1.35∘ around them – such a radius ensures that even the brightest sources (such as GX5-1) do not contribute to the surrounding points more than a few cnts/s/PCU to the surrounding points.
Upper limits on the unaccounted sources within the field of the scans could be estimated as 1–2 cnts/s/PCU (0.5–1 mCrab) at Galactic latitudes . Assuming a Crab-like spectrum of sources this upper limit corresponds to a flux erg/s/cm2.
The effective field of view of the RXTE/PCA spectrometer is about deg2. According to the luminosity function of the Galactic X-ray sources, measured e.g. by ASCA (Ueda et al. (1999), Sugizaki et al. (2001)), RXTE/ASM (Grimm et al. (2002)), CHANDRA (Ebisawa et al. (2001)) at Galactic Latitudes the density of sources with a flux higher than erg/s/cm2 (i.e. compatible with our rejection limit) is of the order of 0.1 deg-1 and this value drops with increasing (e.g. Grimm et al. (2002)). The contribution of weaker point sources to the ridge emission does not exceed approximately (e.g. Ebisawa et al. (2001)). Therefore, due to our limited sensitivity to weak point sources the obtained brightness profiles and spectra could slightly suffer from their influence and an additional ’noise’ of 10% could appear.
3 Results
3.1 Brightness distribution of the ridge emission
After the rejection of regions affected by point sources we have hardly any data within . Besides, a large number of weak point sources (see e.g. Sugizaki et al. (2001)) in this region could strongly contaminate the ridge emission observed by the RXTE/PCA. Therefore we will not try to study the ridge emission at these latitudes in detail.
During Epoch4 and Epoch5 the PCA detectors had significantly different response functions, therefore we will analyze data obtained during these periods separately.
Measured profiles at latitudes higher than 2∘ show a quite weak dependence on longitude, see Fig. 3.

We constructed profiles of the brightness of the Galactic ridge emission, averaged over all longitudes () in our scan field. The intensity profiles in three energy bands are presented in Fig. 4.
The latitude distribution of the Galactic ridge emission at can be well described by an exponential model of the form . The PCA collimator collects X-rays from approximately 1 sq.deg, and therefore the measured profile of the ridge emission is in reality a convolution of the sky distribution with the response of the PCA collimator. Therefore in our approximation of the observed profiles we folded the model profile with the response of the PCA collimator.
The measured profiles of the X-ray intensity of the ridge emission and the best fit exponential models (folded with the collimator response) are presented in Fig. 4. Note that there are indications that an additional narrow component is present at low latitudes, 1–2∘. A similar narrow component was also found by Valinia & Marshall (1998). But in our case strong contamination by point sources in the Galactic plane does not allow us to study this component in detail. Our obtained profiles at are consistent with the results of Valinia & Marshall (1998), but their model of the spatial variation of the intensity of the ridge emission (a Gaussian with FWHM long Galactic latitude ) can no longer describe the profile of the diffuse emission at higher latitudes. One should use the exponential model instead.
The parameters of the approximations of the observed profiles at in the two energy bands 3–20 keV and 10–20 keV are presented in Table 2. The presence of the Galactic ridge emission in 20–30 keV energy band of PCA is not statistically significant in the analyzed data.
| Par. | Epoch4 | Epoch5 | ||
|---|---|---|---|---|
| 3–20 keV | 10–20 keV | 3–20 keV | 10–20 keV | |
| Norma | ||||
-
a - normalization in counts/s/PCU. 1 count/s/PCU corresponds approximately to , and erg/s/cm2 in 3–20 keV, 10–20 keV and 20–30 keV energy bands correspondingly


3.2 Approximation of the spectrum of the ridge emission
The spectrum of the Galactic ridge emission is known to be quite rich, full of different lines of different elements (see e.g. Kaneda et al. (1997)). Unfortunately most of these lines lie in energy bands lower than 3-3.5 keV, i.e. below our bandpass. In our energy range we can see only the blend of Fe lines at energies around 6-7 keV.
As was shown before (e.g. Yamasaki et al. (1997), Valinia & Marshall (1998)), the 3–20 keV spectrum of the Galactic ridge emission could be relatively well described by a single power law with a gaussian line at energy 6.7 keV. the quite large exposure time of the collected data (approximately 200 ksec for each epoch after subtraction of contaminated regions) allows us to make a spectral approximation of the observed ridge emission at different latitudes. Below we will use a power law with a gaussian line model for the approximation of the the ridge emission collected over the whole scan field with , as well as for emission collected over individual 1∘-width strips along the Galactic plane.
Best fit parameters of the approximation of the Galactic ridge spectrum averaged over the whole scan field with are presented in Table 3. Dependences of best fit parameters on Galactic latitude are presented in Fig. 6

| Epoch 4 | Epoch5 | |
| Photon index, | ||
| Line energy, keV | ||
| Line width, keV | ||
| Line EWa, eV | ||
| 33/45 | 51/45 |
a - equivalent width of the line

4 Summary
We analyzed the data of RXTE scans over Galactic center regions performed in 1999-2001. After subtraction of regions contaminated by bright pointed sources we constructed the intensity profile of the Galactic ridge emission and its spectral parameters across the galactic plane within . We show that the intensity profile at could be well described by an exponential model () with e-folding size . A spectral approximation of data collected over 1-deg strips along the galactic plane does not show statistically significant changes of best fit parameters both of the continuum and of the Fe line. The averaged spectrum of the ridge emission observed by the PCA could be approximated by a power law with a slope and a gaussian line at energy keV with equivalent width eV. These results are compatible with previously published results of GINGA (Yamasaki et al. (1997)) and RXTE (Valinia & Marshall (1998)).
The origin of the Galactic ridge emission is still not known. Recent results of ASCA and especially Chandra allowed us to exclude the possibility that the observed ridge emission is due to the integrated flux of faint point sources (Ebisawa et al. (2001)) and we can conclude that it should have a truly diffuse origin. Different scenarios of the Galactic ridge emission production (e.g. magnetic reconnection, Tanuma et al. (1999); supernova explosions, Koyama et al. 1986b ; cosmic rays Tanaka et al. (1999), Dogiel et al. (2002) and so on) could in principle be distinguished by comparing different brightness profiles predicted by models.
Following Markevitch et al. (1993) and Yamauchi& Koyama (1993) it is interesting to compare the observed profile of the ridge emission with the distribution of the CO line flux (e.g. Dame et al. (1987)) as a tracer of molecular gas in the Galaxy and also with the density of SNR (Green (2001)) as a tracer of supernova explosions. The constructed distributions within the field of scans of RXTE/PCA are presented in Fig.7. It is clearly seen that CO line intensity drops much more abruptly than the intensity of the ridge emission, while the distribution of SNR more closely resembles the profile of the ridge X-ray emission. Unfortunately, poor statistics of SNR at high latitudes does not allow us to make any solid conclusions.
Acknowledgements.
Author is grateful to Rashid Sunyaev, Marat Gilfanov and Eugene Churazov for valuable discussions. This research has made use of data obtained through the High Energy Astrophysics Science Archive Research Center Online Service, provided by the NASA/Goddard Space Flight Center.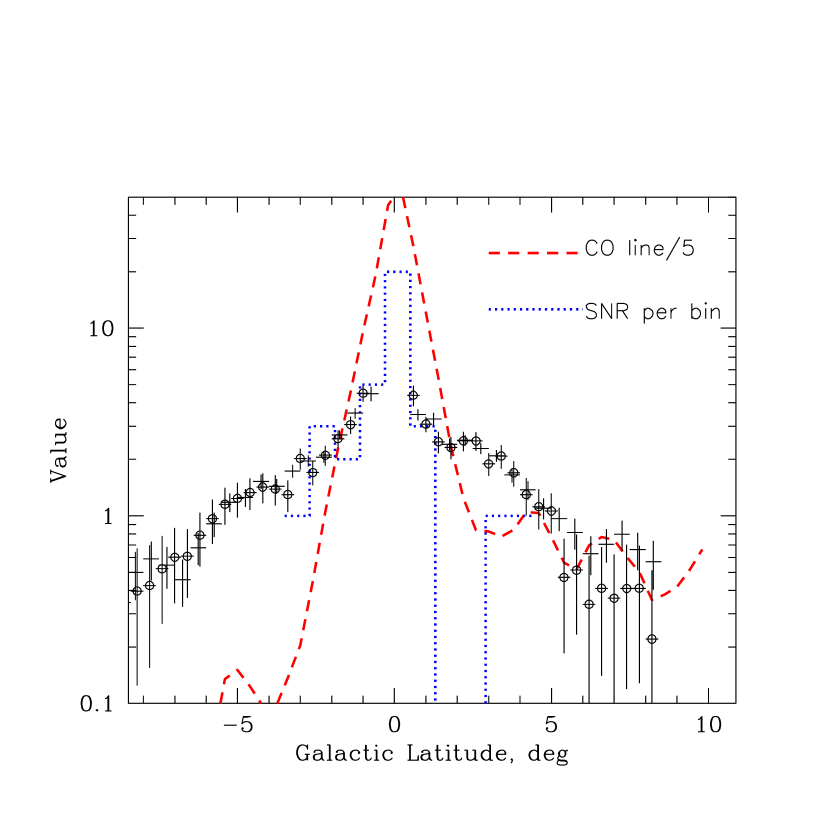
References
- Bradt et al. (1993) Bradt H., Rotshild R., Swank J. 1993, Astron. Astrophys. Suppl. Ser. 97, 355
- Bleach et al. (1972) Bleach R., Boldt E., Holt S. et al. 1972, ApJ, 174, 101L
- Dame et al. (1987) Dame T. M., Ungerechts H., Cohen R. S. et al. 1987, ApJ, 322, 706
- Dickey & Lockman (1990) Dickey J., Lockman F. 1990, ARA&A, 28, 215
- Dogiel et al. (2002) Dogiel V., Schoenfelder V., Strong A. 2002, A&A, 382, 730
- Ebisawa et al. (2001) Ebisawa K., Maeda Y., Kaneda H. et al. 2001, Science, 293, 1633
- Green (2001) Green D. 2001, http://www.mrao.cam.ac.uk/surveys/snrs/snrs.data.html
- Grimm et al. (2002) Grimm H.-J., Gilfanov M., Sunyaev R. 2002, A&A, 391, 923
- Iwan et al. (1982) Iwan D., Marshall F., Boldt E. et al. 1982, ApJ, 260, 111
- Kaneda et al. (1997) Kaneda H., Makishima K., Yamauchi S. et al. 1997, 491, 638
- (11) Koyama K., Makishima K., Tanaka Y. et al. 1986a, PASJ, 38, 121
- (12) Koyama K., Ikeuchi S., Tomisaka K. 1986b, PASJ, 38, 503
- Liu et al. (2000) Liu Q. Z., van Paradijs J., van den Heuvel E. P. J. 2000, A&AS, 147, 25
- Liu et al. (2001) Lui Q. Z., van Paradijs J., van den Heuvel E. P. J. 2001, A&A, 368, 1021
- Markevitch et al. (1993) Markevitch M., Sunyaev R., Pavlinsky M. 1993, Nature, 364, 40
- Skibo et al. (1997) Skibo J., Johnson W., Kurfess J. et al. 1997, ApJ, 483, 95L
- Sugizaki et al. (2001) Sugizaki M., Mitsuda K., Kaneda H. et al. 2001, ApJS, 134, 77
- Tanaka et al. (1999) Tanaka Y., Miyaji T, Hasinger G. 1999, Astron. Nahr. 320, 181
- Tanaka (2000) Tanaka Y. 2000, PASJ, 52, 25L
- Tanuma et al. (1999) Tanuma S., Yokoyama T., Kudoh T. et al. 1999, PASJ, 51, 161
- Townes (1989) Townes C. 1989, in IAU Simp. 136
- Ueda et al. (1999) Ueda Y., Takahashi T., Inoue H. et al. 1999, ApJ, 518, 656
- Valinia & Marshall (1998) Valinia A., Marshall F. 1998, ApJ, 505, 134
- Voges et al. (1999) Voges W., Aschenbach B., Boller Th. et al. 1999, A&A, 349, 389
- Warwick et al. (1985) Warwick R., Turner M., Watson M. et al. 1985, Nature, 317, 218
- Wood et al. (1984) Wood K. S., Meekins J. F., Yentis D. J. et al. 1984, ApJS, 56, 507
- Worrall et al. (1982) Worrall D., Marshall F., Boldt E. et al. 1982, ApJ, 255, 111
- Yamasaki et al. (1997) Yamasaki N., Ohashi T., Takahara F. et al. 1997, ApJ, 481, 821
- Yamauchi & Koyama (1993) Yamauchi S, Koyama K. 1993, ApJ, 404, 620