The Ages and Abundances of a Sample of Globular Clusters in M49 (NGC 4472)11affiliation: Based on observations obtained at the W.M. Keck Observatory, which is operated jointly by the California Institute of Technology, the University of California, and the National Aeronautics and Space Administration.
Abstract
We present a study of the metallicity and age of the globular clusters system of M49 (NGC 4472), the most luminous galaxy in the Virgo cluster. We measure Lick indices for 47 GCs in M49 from LRIS/Keck spectra and establish their metallicity parameters qualitatively in comparison to the Galactic GCs and to published data for 150 M87 GCs. We then compare our measurements with the predictions of models for the integrated light of old single burst stellar systems by Worthey (1994) and by Thomas, Maraston & Bender (2002). We find that the metallicity of the M49 GC system spans the range from [Fe/H] to +0.4 dex. We show that the metallicity and age parameters for these two GC systems are basically identical, except that the M49 GCs reach slightly higher metallicities than do those of M87. We find that the GCs of both of these giant elliptical galaxies are -enhanced by a factor of about two above the Solar value, as is also true of the Galactic GCs. Thus the most metal rich GCs in M49 reach [Z/H] +0.8 dex, comparable to that of M49 itself. While adoption of the -enhanced models of Thomas, Maraston & Bender (2002) has eliminated most of the previous discrepancies with observations, the most metal rich M49 GCs have NaD lines which are still considerably stronger than those predicted by any model, and there are still issues involving the metallicity scale of these models. We find that in the mean, the M49 GCs are at least 10 Gyr old. However, the grids of models we used differ in how they treat the horizontal branch, and this perceptibly affects the predicted H index. Hence our current incomplete understanding of the role of the horizontal branch limits our ability to derive a more detailed distribution for the ages of the GCs in M49 and in M87.
1 Introduction
M49 (NGC 4472) is the most luminous galaxy in the Virgo cluster, with , and is more luminous than any closer galaxy. It is, however, not located at or near the dynamical center of the cluster. Instead, M87 resides at the center of this deep potential well, surrounded by a huge amount of X-ray emitting gas, while M49 is at the center of the modest Virgo B subcluster more than 4.5∘ away. The globular cluster (henceforth GC) system of M49 is rich, with S/N = 3.6 ( GCs in total)(Rhode & Zepf, 2001), but that of M87 is even richer (S/N = 14, with 13,450 GCs in total) (McLaughlin, Harris & Hanes, 1994). The enormous GC system of M87 made it a tempting target, and JGC and collaborators carried out an exhaustive study of the kinematics of the GC system of M87 (Cohen & Ryzhov, 1997; Cohen, 2000) and of the ages and abundances of a large sample of M87 GCs (Cohen, Blakeslee & Ryzhov, 1998). We then felt we needed to investigate the GC system of M49 to understand which attributes of the GC system of M87 might be unique to its special location, and which generic to luminous giant ellipticals. Our analysis of the kinematics of the GC system of M49 and inferences concerning the distribution of mass and dark matter in M49 and the isotropy of the GC orbits is given in Côté et al. (2003), while the most recent radial velocity tabulation and kinematic analysis for the M87 GC system can be found in Hanes et al. (2001) and Côté et al. (2001). Here we utilize the best of our spectra to explore the distribution in age and in metallicity as well as the abundance ratios of the GC system of M49.
The first attempts to determine the metallicity of the Virgo GC system were based on wide field photometry. This began with the work of Strom et al. (1981) for M87 and that of Cohen (1988) for M49, but we jump to the ground based wide field Washington photometry of Geisler, Lee & Kim (1996) and to the HST based analysis of Whitmore et al. (1995). In these recent studies, the key new result was the detection of strong bimodality in the color distribution of the GCs. Although no separation of age and metallicity was possible, the observed color distribution of the GCs was assumed to reflect the intrinsic metallicity distribution. Such a bimodal metallicity distribution might arise through GC formation in major mergers, through the hierarchical assembly of the galaxy through numerous dissipationless mergers, or through multiple, internally-driven bursts of star and cluster formation (for a review of the various formation models, see Carney and Harris 2001).
Mould et al. (1990) obtained the first spectra of GCs in M49 and from their sample of 26 GCs suggested the mean metallicity of the M49 GC system was 1/6 Solar. Sharples et al. (1998) presented spectra and a kinematic analysis for an additional 47 GCs in M49. Spectra of another 87 GCs in M49 were obtained by Zepf et al. (2000), who presented a kinematic analysis. Beasley et al. (2000) carried out an analysis of the available spectra for 131 GCs in M49. However, their spectra have low signal-to-noise ratios, and they could not derive any relevant parameters for individual M49 GCs. Instead, they summed the spectra into four bins in the color of the Washington photometry of Geisler, Lee & Kim (1996), assuming this correlated with metallicity, to derive mean abundances and ages.
The advantage of LRIS (Oke et al., 1995), which is a multi-slit instrument utilizing the large collecting area of the 10-m Keck Telescope, in this situation is crucial. We are able to derive credible parameters for individual GCs in Virgo cluster galaxies. Since the work of Cohen, Blakeslee & Ryzhov (1998), the sophistication of the available models of the integrated light of old stellar systems has increased, and we explore here the issue of possible -enhancement (non-Solar ratios of Mg/Fe or Na/Mg) in both M87 and in M49 as well as the metallicity (i.e. [Fe/H]111The standard nomenclature is adopted; [X/H] = log10[N(X)/N(H)] log10[N(X)/N(H)]⊙, and similarly for [X/Fe].) and age of the GCs in these two galaxies.
2 Selection of Candidates and Observations
The photometric study of the GC system of M49 (NGC 4472) with the intermediate band Washington filter system by Geisler, Lee & Kim (1996) was used to define the sample of candidate GCs, which are identified using their numbering system. Coordinates for the candidates were determined as described in Côté et al. (2003). A color cut of mag, similar to that used by Geisler, Lee & Kim (1996), was imposed to avoid contamination by foreground Galactic stars or background galaxies. In practice, essentially no genuine GC candidates are found outside this range (Lee & Geisler, 1993; Ostrov, Forte & Geisler, 1998). For the present work, we preferentially selected those spectroscopically confirmed GCs in M49 (either from our own radial velocity catalog as it existed in early 2000 or from the literature) which were bright, with , where is very close to (Geisler & Forte, 1990). The positions of these bright GCs were then used to design two LRIS slitmasks. Additional bright candidate GCs from the database of Geisler, Lee & Kim (1996) were added to maximize the number of slits per mask.
The two slitmasks were observed with LRIS (Oke et al., 1995) at the Keck Telescope on the night of May 1, 2000. The weather conditions were good, with seeing 0.7 to 0.8 arcsec. A 600 g/mm grating blazed at 5000 Å (spectrum centered near 5400 Å, and covering roughly the range from H to H for a slitlet near the centerline of the slitmask) gave a spectral resolution of 1.2 Å/pixel, or 5.8 Å for the 1.0 arcsec wide slitlets. Three 3000 sec exposures were obtained for the first slitmask and two for the second. The spectra from this run, which are the only ones utilized in the present paper, are the best of the 196 new spectra for M49 GCs discussed in Côté et al. (2003).
The spectra were reduced using Figaro (Shortridge, 1993) scripts developed for analysis of LRIS multi-slit spectra as described in our work on the GC system of M87 (Cohen & Ryzhov, 1997). One improvement from our earlier work was in the wavelength calibration of the spectra. As before, we used the a third order polynomial fit to the night sky emission lines in the spectrum from each slitlet to calibrate the wavelength scale. A problem encountered in our previous work on M87 was the lack of any detectable night sky lines blueward of the 5199 Å [N I] line. (Keck spectra do not show Hg or other emission features from city lights in one hour exposures with LRIS.) Since we wished to examine the region around H, we were forced to extrapolate the wavelength fit uncomfortably far; such a procedure sometimes leads to runaways in the fit in the unconstrained region at the beginning or end of the spectrum. Thus in the present work a search was made for additional night sky emission lines in these spectra blueward of 5199 Å. A very weak line was found at 4968.8 Å, whose reality was checked on several spectra of other objects. With this additional line, arising from a transition in O I, the wavelength scale is now more robust at H.
The radial velocities of the M49 GC candidates were determined as described in Cohen & Ryzhov (1997). Typical errors in the wavelength fit are less than 0.1 Å; these are a minor contributor to the assigned errors, which are based on the signal-to-noise ratio (SNR) of the spectra. Comparison of the measured from various features suggests that these assigned errors are quite conservative. The radial velocities from these observations are included as part of our larger database on GCs in M49 presented in Côté et al. (2003) and are tabulated there.
The resulting 1D spectra, summed along the slit and over the available exposures, cannot be fluxed effectively due to the variable slit losses inherent in use of a multislit mask with fairly narrow slits.
2.1 Foreground and background objects
Geisler 1982 appeared extended on the slitmask alignment setup images and its spectrum is that of a galaxy. The redshifts of four additional galaxies which turned up serendipitously in the slitlets, as well as that of Geisler 1982, are given in Table 1. The mags given in the table are from our photometry carried out on the slitmask alignment images taken with LRIS. Only one Galactic star, Geisler 2860, was found among the objects observed. After elimination of foreground and background objects, we have a sample of 47 GCs in M49 with LRIS spectra.
3 Measured Indices
We have measured the standard Lick indices (Faber et al., 1985; Burstein et al., 1986) as well as the H index defined in our earlier work (Cohen, Blakeslee & Ryzhov, 1998) on the M87 GC system. The codes with which this was accomplished are the same Figaro (Shortridge, 1993) routines used in Cohen, Blakeslee & Ryzhov (1998). These take the standard bandpasses, shift them in accordance with the radial velocity of each object, then calculate the indices.
The results of this automatic procedure were examined, and discrepant and/or problem cases were checked individually. The NaD indices in these faint objects are particularly difficult as the corresponding emission lines from the night sky must be removed. Some of the spectra were rereduced manually in an effort to improve the night sky subtraction. H is beyond the red end of the spectra for a few of the M49 GC candidates; for several others, this index had to be measured by hand when the red continuum bandpass for this feature was only partially included.
The resulting set of indices are listed in Table 2. Because the spectra are not fluxed and are not matched to the spectral response used to define the Lick system as no Lick standard stars were observed, those indices which span wide ranges in wavelength may have systematic offsets from the nominal Lick system. The narrower feature indices which we will use, such as H, Mgb, Fe5270 and NaD, are not significantly affected by this concern.
The last column of this table gives the SNR per spectral pixel in the final spectrum, measured over the interval 5950 to 6250 Å. Within this wavelength interval the observed spectra are approximately constant in DN/pixel and there are few strong spectral features. The signal level in the continuum at H is 60 to 75% of that at 6100 Å. The errors for the indices were computed from these measurements of the SNR in the continuum. This too is a departure from our earlier work, where the SNR was calculated from the signal level in the spectrum and in the background. The sky and the spatially variable light from the halo of M49 contribute to the background. Furthermore slit losses depend on the accuracy of the coordinates and the alignment of the slitmask. Hence the SNR may not be a smoothly increasing function of the brightness of the GC candidate.
4 Qualitative Analysis
We begin with a qualitative examination of our data, considering the correlations among the indices measured for the M49 GC sample, comparing with those found in our earlier study of the M87 GCs (Cohen, Blakeslee & Ryzhov, 1998) and also with those of the Galactic GC system.
4.1 Correlations of Indices
We display the correlation of NaD with Mgb in Figure 1. The errors in each index, computed as described above, are indicated in the right panel of this figure. The expected correlation of increasing NaD with increasing Mgb, presumably arising primarily from increasing metallicity, is seen. The coefficients of the weighted second order polynomial fit to this relationship, shown in the right panel of this figure, are given in Table 3. This fit is shown over the range which includes 95% of the GC candidates, excluding 1 GC at each end222A larger sample, such as that of Cohen, Blakeslee & Ryzhov (1998) in M87, would make this measure more robust and less affected by isolated outliers or bad measurements.. The limits of this range for each index are given in Table 5. The dispersion about this fit, assuming no errors in Mgb, is 1.16 Å, consistent with the uncertainties in the NaD indices of the M49 GCs and the problems of subtraction of the night sky emission that affect this index.
We display the correlation of the mean of the Fe5270 and the Fe5335 indices (denoted Fe) with the Mgb index in Figure 2. The expected increase of Fe with increasing Mgb index, presumably arising primarily from increasing metallicity, is seen in this figure. The coefficients of the weighted second order polynomial fit to this relationship are given in Table 3 and the 95% range is again given in Table 5. The dispersion about this fit, assuming no errors in Mgb, is only 0.6 Å, consistent with the uncertainties in the Fe5270 and Fe5335 indices of the M49 GCs.
The correlation of H with Mgb is shown in Figure 3. H is the bluest index measured, and has the lowest signal level in the continuum of any of the measured indices. Since H in high metallicity old GCs is expected to be weak, we anticipate and we see substantial scatter in this figure. However, these two indices are clearly anti-correlated, as is expected from models of old single burst stellar populations. The coefficients of the weighted second order polynomial fit to this relationship are given in Table 3 and the range is again given in Table 5. The dispersion about this fit, assuming no errors in Mgb, is only 0.6 Å, consistent with the uncertainties in the H indices of the M49 GCs.
The correlation of H with Mgb is shown in Figure 4 for the 34 GCs in our sample with detected H lines. The expected correlation between the two indices is seen. The coefficients of the weighted second order polynomial fit to this relationship are given in Table 3 and the 95% range is again given in Table 5. The dispersion about this fit, assuming no errors in Mgb, is only 0.6 Å, consistent with the uncertainties in the H indices of the M49 GCs.
The correlation of the H indices of the M49 GCs with their H indices is shown in Figure 5. The expected increase of H with increasing H is seen. The coefficients of the weighted second order polynomial fit to this relationship are given in Table 3 and the range is again given in Table 5. The dispersion about this fit, assuming no errors in H, is 0.45 Å, consistent with the uncertainties in the H indices of the M49 GCs.
4.2 Comparison with M87
The general correlations among the Lick indices that we see in the GC system of M49 were also found by Cohen, Blakeslee & Ryzhov (1998) to hold in the M87 GC system. Figure 6 shows the best fit second order curves to the index-index plots NaD, Fe, H and H as a function of Mgb from Figures 1 to 4 for M49. The fits to the indices of the 150 GCs in M87 from Cohen, Blakeslee & Ryzhov (1998) are also shown. These fits are displayed over the range which includes 95% of the GCs in our sample in each system. These ranges for the M87 sample with suitable LRIS spectra are given in Table 5.
The radial distribution of the spectroscopic sample in M49 and in M87 is compared in Table 4. The final column gives the median galactocentric radius in units of the galaxy scale length. The minimum and of the first quartile are comparable for the two spectroscopic GC samples. However, the M87 GC spectroscopic sample extends to larger . Since the radial gradient in GC properties is small in the outer region of M87 (e.g. Cohen, Blakeslee & Ryzhov, 1998), this difference in sample spatial distribution should not cause a significant bias in the relative abundance distributions of the GC systems in these two galaxies
We see in Figure 6 that the fits to the index-index correlations for the two Virgo gEs are essentially identical. However, the upper range limits are larger for each of the major metallicity indices Mgb, NaD and Fe for M49 than for M87. Following upon our previous work in M87, we thus assert that to first order, both systems are composed of predominantly old clusters spanning a wide range of metallicity, with the range of metallicity extending to a somewhat higher value in M49 than in M87.
4.3 Comparison with Galactic Globular Clusters
We next compare the behavior of the index-index plots for the M49 GCs with those of the Galactic globular clusters. The indices for the Galactic globular clusters are taken from Cohen, Blakeslee & Ryzhov (1998), Puzia et al. (2002), Covino, Galletti & Pasinetti (1995) or Burstein et al. (1986) (in decreasing order of preference for clusters with multiple observations). This gives a sample of 35 Galactic GCs observed, spanning the full range of metallicity of the Galactic GC system. In particular, with the work of Cohen, Blakeslee & Ryzhov (1998) and subsequently of Puzia et al. (2002), the most metal rich Galactic GCs and those in the bulge are well sampled, while Covino, Galletti & Pasinetti (1995) concentrated on the metal poor end.
Figure 7 shows the relationships for the index pairs Mgb-NaD, Mgb-Fe, Mgb-H and H-H for the M49 and for the galactic GC samples. In each case, the behavior is similar, but the M49 GCs reach higher values of the metallicity sensitive indices than do the most metal rich Galactic GCs. The comparison of the anti-correlation between H and Mgb suggests that the age of the M49 GCs is comparable to that of the Galactic GCs, which we take to be (almost all) uniformly old, with an age of 12 Gyr (see, e.g. Rosenberg et al., 1999)333We ignore the GCs associated with the accretion of the Sgr dwarf galaxy (Ibata et al., 1997), which may be 3 Gyr younger (Fusi Pecci et al., 1996)..
Furthermore, although there is extremely good agreement in the mean relationship between Mgb and Fe indices between the M49 and the Galactic GCs, there is a systematic vertical offset upward (with some scatter) in the panel of Figure 7 displaying Mgb vs. NaD. We suggest that this arises due to NaD absorption from the ISM in the disk of our Galaxy; this absorption is presumably absent in M49, which has essentially no gas and no disk. This effect will appear large both for GCs with high reddening and also for the more metal poor clusters, where even a small contribution from the ISM can perturb the weak NaD lines in the integrated light of the cluster. A similar offset is seen for the M87 GCs (see figure 9 of Cohen, Blakeslee & Ryzhov, 1998).
4.4 “New” versus “Old” Lick Indices
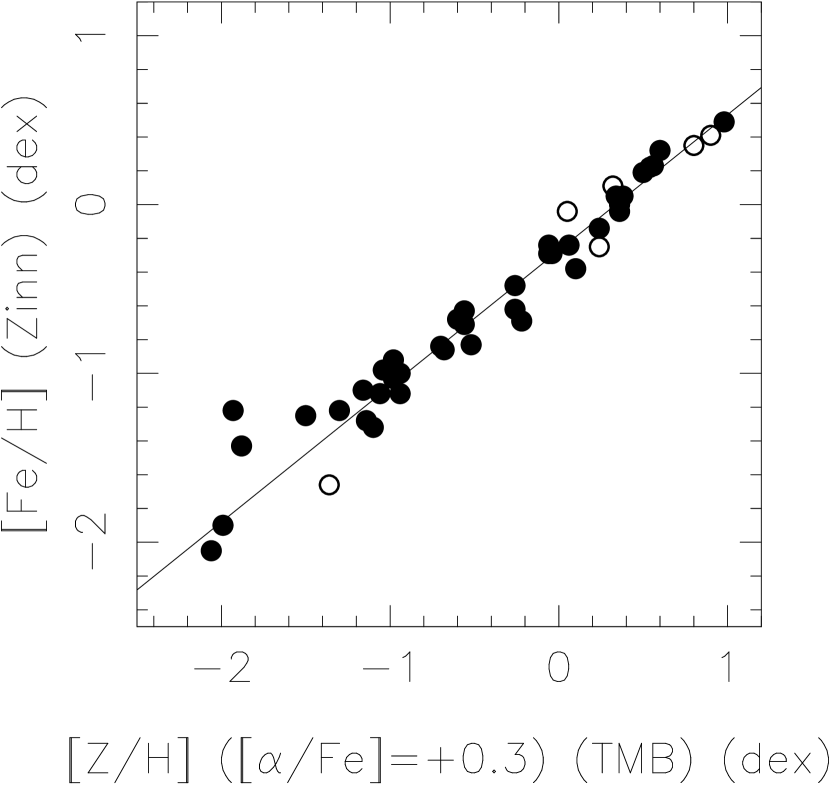
To maintain consistency with our earlier work on the M87 GC system (Cohen, Blakeslee & Ryzhov, 1998), we have used the standard Lick indices (Faber et al., 1985; Burstein et al., 1986) together with an H index defined in Cohen, Blakeslee & Ryzhov (1998). We can then use with confidence the transformation previously determined by Cohen, Blakeslee & Ryzhov (1998) between [Fe/H]W, the metallicity inferred directly from the Worthey (1994) grid of models, and [Fe/H]Z, that metallicity on the well calibrated and commonly used Zinn & West (1984) scale. The exact definition of the wavelength bandpasses for the Lick indices has evolved somewhat with time. Worthey et al. (1994) presented updated definitions of these indices which are slightly wider to better accommodate the high velocity dispersions found in massive galaxies. For a few of these indices, Trager et al. (1998) further modify slightly the definitions of the wavelength bandpasses.
Since the most recent model grids tabulate “new” Lick indices, we need to consider the effect of switching between the “old” and the “new” Lick indices on determinations of metallicity and age. Given that GCs have small internal velocity dispersions ( km/sec) and that the change in bandpass wavelengths is generally less than 2 Å, we expect any resulting differences in measured index strengths to be small. Puzia et al. (2002) have calculated indices on both systems from their spectra of Galactic GCs, and found maximum differences of 0.2 Å for H and for Mgb, 0.15 Å for Fe5270, and 0.1 Å for Fe5335 and NaD. We have done the same for the spectra of 12 Galactic GCs from Cohen, Blakeslee & Ryzhov (1998), and find similar differences. There is no change in any of the indices used here larger than 0.2 Å, with the exception of Fe5335 in the most metal rich Galactic GCs. This is a relatively weak Fe line, in a region where the continuum is chopped up by many features only slightly weaker (e.g. the Cr I blend at 5297 Å, the blend of Fe I lines between 5363 and 5371 Å, etc.) and hence a small change in the bandpass locations may affect the value of this index, and only this index, by more than 0.2 Å out of a total of about 3 Å.
We thus conclude that switching between the various definitions of the Lick indices does not introduce substantive changes in the measured indices of a feature for GCs. For our sample of Galactic GCs, changing from the “old” to the “new” Lick indices and then deriving their metallicities and ages as described in Cohen, Blakeslee & Ryzhov (1998) produces a mean decrease in deduced age of 1 Gyr (the median difference is 0 Gyr). [Fe/H] is decreased in the mean for such a switch by 0.05 dex; the median change in [Fe/H] is also dex.
The one published claim that large differences in the measured Lick indices are produced by switching between the “new” and “old” index bandpass definitions by Maraston et al. (2003) (see their Table 1) has been withdrawn; see the note added in proof in their paper.
5 Quantitative Interpretation With Models
A model of the integrated light of a stellar population can be constructed assuming a star formation history, a suitable set of stellar evolutionary models and hence isochrones and a set of integrated spectra as a function of stellar atmosphere parameters, see e.g. Vazdekis (1999). These spectra can then be manipulated to yield parameters that can be compared with observations of such systems. For the old stellar systems considered here, we assume a single burst model with all stars being coeval.
Models for the Lick indices as a function of metallicity and age such as those of Worthey (1994), used in our previous work on M87 did not, in fact, integrate synthetic spectra to determine indices, but rather used fitting functions based on the Lick group’s observations of a grid of calibrating stars which define the feature strength as a function of effective temperature, surface gravity and metallicity of a star (see, e.g. Worthey et al., 1994).
These models assumed Solar abundance ratios, or more precisely, they assumed that the mean of the calibrating stellar grid observed is equivalent to the Solar abundance ratios. High dispersion abundance analyses of Galactic GCs, however, have revealed that enhancement of the -elements, specifically Mg and Ca, is almost universal. In particular, this is seen in NGC 6528 by Carretta et al. (2001), and in NGC 6553 by Cohen et al. (1999). These are two of the most metal rich Galactic GCs known. High precision analyses of somewhat more metal poor Galactic GCs also show this. For example, in M71 Ramírez & Cohen (2002) find the mean [Ca/Fe] and the mean [Mg/Fe] to be dex, and in M5 Ramírez & Cohen (2003) find the mean [Mg/Fe] to be dex while the mean [Ca/Fe] is dex. Similar -enhancements are found in very metal poor halo field stars, as shown by Cohen et al. (2002) and Carretta et al. (2002), with references to earlier work by many groups therein.
Early type galaxies also show enhanced Mg/Fe ratios, with typical values being about twice Solar (Worthey, Faber & Gonzalez, 1992; Trager et al., 2000; Davies et al., 2001; Proctor & Sansom, 2002; Eisenstein et al., 2003). The origin of such enhancements in terms of galactic chemical evolution is well understood; see, for example, the review of McWilliam (1997). They are expected to occur when star formation proceeds rapidly, exhausting the gas prior to the time when SN Ia begin to spew out Fe and related elements, whereas the more rapid evolution of massive stars permits contributions to the ISM from Type II SN.
Trippico & Bell (1995) explored the sensitivity of the Lick indices to changes in the element abundance ratios, while in the absence of detailed stellar evolutionary grids of models with non-Solar elemental ratios, Chieffi, Straniero & Salaris (1991) suggested rescaling of the Solar composition isochrones using the total [Z/H] to obtain -enhanced isochrones. Recently stellar evolution codes and the resulting isochrones have been computed with non-Solar abundance ratios (see, e.g. Vandenberg et al., 2000), hence calculations which predict the Lick indices as a function of Z, /Fe and age are becoming available. We adopt those of Thomas, Maraston & Bender (2002)444Thomas, Maraston & Bender (2002) tabulate “new” Lick indices.. The metallicity scale of these models, a subject to which we will return later, is defined in Maraston et al. (2003), where their tests using Galactic GCs are described. Thomas, Maraston & Bender (2002) present Lick indices calculated from their models tabulated at 6 metallicities, [Z/H] = , , , 0.0, +0.35 and +0.67 dex, and at 10 ages ranging from 1 to 15 Gyr.
Figure 8 shows the mean of the indices covering the strong Fe lines at 5270 and at 5335 Å, denoted Fe, as a function of Mgb for the 47 GCs in M49. The 1 uncertainties for Geisler 4168 only are shown; figure 2 shows uncertainties for each of the M49 GCs. The crosses represent the positions of the models of Thomas, Maraston & Bender (2002) with an age of 12 Gyr from [Z/H] = to +0.67 dex. Line segments connect the predictions of the models at these metallicities with [/Fe] = 0.0 (Solar), +0.3 and +0.5 dex. Note that [Z/H] [Fe/H] + 0.94[/Fe] (Thomas, Maraston & Bender, 2002). The loci of the M49 GCs are inconsistent with the Solar /Fe ratio; a mean enhancement of about a factor of two in /Fe is required for a reasonable fit to the observations. This enhancement, which is similar to the enhancements found by high dispersion abundance analyses for the Galactic GCs and to that required for luminous early type galaxies, is found over the full range of metallicities within the M49 GC system, although this is less certain among the most metal poor GCs, where the separation of indices for the models between -enhanced and Solar abundance ratios is, as shown in Figure 8, smaller.
The range of metallicity of the majority of the M49 GCs as judged from their position on Figure 8 and the comparison to the Thomas, Maraston & Bender (2002) models appears to be [Z/H] from to +0.5 dex, which for /Fe = +0.3 dex, corresponds to [Fe/H] = to +0.2 dex.
Figure 9 shows the NaD index as a function of Mgb for the 47 GCs in M49. Again the 1 errors are shown only for Geisler 4168; figure 1 shows uncertainties for each of the M49 GCs. The crosses represent the positions of the models of Thomas, Maraston & Bender (2002) with an age of 12 Gyr with six metallicity values. Line segments connect the predictions of the models for these metallicities with [/Fe] = 0.0 (solar), +0.3 and +0.5 dex.
In our earlier work on the M87 GC system, the most obvious shortcoming of the Worthey (1994) models was that, at the metal rich end, the Fe indices of the M87 GCs were always smaller for a given Mgb index than those predicted by the models. As is shown in Figure 10, this problem is now cured by the use of the new -enhanced models of Thomas, Maraston & Bender (2002) for both M87 and for M49. The major remaining issue, illustrated in Figure 9 for M49 and in Figure 11 for M87, is the very strong NaD indices seen in a few of the most metal rich M49 and M87 GCs, an issue also noted as problematical in Cohen, Blakeslee & Ryzhov (1998). We suggest that this is a genuine problem with the models, which are, as noted above, poorly calibrated for such high metallicities.
NaD and Mgb are the strongest indices analyzed here. But the NaD index is dominated by the contribution from the sodium doublet, while the Mgb index includes the three strong Mg triplet lines as well as several weaker Fe features. Thus the NaD lines should reach the damping part of the curve of growth at a lower abundance than any of the other features used here. If the lines are becoming damped for the majority of the stars contributing to the integrated light, then line strength , and the line index will increase rapidly with increasing abundance of the appropriate element. An even more rapid dependence of index on abundance is expected due to a second effect; higher abundance clusters have cooler red giant branches, hence stronger lines.
The slopes of the predicted indices from Thomas, Maraston & Bender (2002) as a function of [Z/H] suggest that the NaD index of the integrated light has in effect reached the damping part of the curve of growth at [Z/H] near +0.4 dex, but the Mgb index has not yet done so in their models even at the highest metallicity included. We ascribe the very strong NaD lines seen in the strongest lined GCs in M49 and in M87 to metallicities near [Mg/H] +0.7 dex (i.e. [Fe/H] , [Z/H] dex), but not much larger.
5.1 Extrapolating the Models
In the case of both the Worthey (1994) and Thomas, Maraston & Bender (2002) models, the highest metallicity case tabulated has indices which are weaker than those of the strongest lined M87 or M49 GCs. This means a small extrapolation of the models towards higher metallicity is required. For the Worthey (1994) models, this was carried out assuming that all the indices were on the damping part of the curve of growth. The derived abundances of 8 M49 GCs were affected. In the case of M87, we extrapolated the abundances of the five GCs for which this is necessary; Cohen, Blakeslee & Ryzhov (1998) did not do so.
Only three of the M49 GCs are more metal rich than the most metal rich -enhanced model tabulated by Thomas, Maraston & Bender (2002). We extrapolated slightly beyond the lowest and highest metallicites of the Thomas, Maraston & Bender (2002) model grid to and +1.0 dex, which range includes all the M49 GCs.
5.2 Calculation of Metallicity for the M49 GCs
We have established above that the M49 GC indices, including the key H and H indices, show similar correlations to those seen among the Galactic GCs and those of M87 (Cohen, Blakeslee & Ryzhov, 1998). We therefore assume an age of 12 Gyr for all of the M49 GCs and proceed to calculate their metallicities in two different ways. We use the Mgb, NaD and Fe indices, giving double weight to the former due to its larger range555The NaD index has a similar range, but has problems with removal of night sky emission. with comparable accuracy, with the [/Fe] = +0.3 dex models of Thomas, Maraston & Bender (2002). These produce [Z/H], not [Fe/H]. The resulting [Z/H] and its 1 error are given for each M49 GC in the second and third columns of Table 6. For the three M49 GCs with the strongest NaD lines, we indicate in Table 6 the resulting (lower) abundance [Z/H] deduced by ignoring the NaD index. These GCs are all above the maximum metallicity considered in the Worthey (1994) models.
We derive a second metallicity denoted [Fe/H]Z using the same procedures and codes as in our earlier work on M87 (Cohen, Blakeslee & Ryzhov, 1998). This relies upon the Worthey (1994) models and produces [Fe/H] on a scale tied to the GC abundances adopted by Zinn & West (1984), denoted [Fe/H]Z. These values are listed in the fourth column of Table 6.
5.3 Comparison of Metallicity Scales
In this paper, we utilize three metallicity scales, the one used in M87 by Cohen, Blakeslee & Ryzhov (1998), the one adopted by Geisler, Lee & Kim (1996) to analyze their photometry, and that of Thomas, Maraston & Bender (2002). Although we used the Worthey (1994) models in our M87 analysis, we rescaled our results to the Zinn & West (1984) metallicity scale through calibrating with Galactic GCs. The scaling relation derived by Cohen, Blakeslee & Ryzhov (1998) was
| (2) |
We continue to use this transformation for the M49 GCs, except those beyond the upper limit of the Worthey (1994) model grid, where it is assumed that [Fe/H]Z = [Fe/H]Z(max of grid) + , where is computed as described in §5.1.
Geisler, Lee & Kim (1996) also used the Zinn & West (1984) [Fe/H] scale with a calibration through Washington photometry of Galactic GCs. Geisler & Forte (1990) found [Fe/H] = 2.35(, calibrated over the range to dex, which transformation is adopted by Geisler, Lee & Kim (1996) throughout their analyses, even though the colors of the reddest GCs in M49 exceed the upper limit of the metallicity calibration. We are able to present a new calibration of with metallicity, incorporating photometric data for the Galactic GCs from Harris & Canterna (1977) with reddenings from Harris (1996), the GCs of M87 (data from Hanes et al., 2001) and those of M49 (data from Geisler, Lee & Kim, 1996), adopting the reddenings for M87 and for M49 from Schlegel, Finkbeiner & Davis (1998). The metallicities are taken from Zinn & West (1984) for the Galactic GCs, the spectroscopic analyses of Cohen, Blakeslee & Ryzhov (1998) for the M87 GCs, and of the present paper for the M49 GCs. Figure 13 shows the result, i.e. [Fe/H]Z as a function of the dereddened color for this database of 241 GCs. We find that the linear relationship of Geisler & Forte (1990) is overall a good fit to the data, except among the most metal poor GCs, where the actual relationship is steeper than their adopted fit, as might be expected since any photometric system will lose sensitivity among the most metal poor systems. The second order fit we obtain after rejecting the 12 most discrepant GCs is Fe/H]Z = . The dispersion of the 228 GCs about this fit is only 0.20 dex. This second order fit is only slightly better than the original linear fit of Geisler & Forte (1990); both fail to reproduce well the very steep drop in [Fe/H] at the lowest values of below 1.1 mag. Adopting [Fe/H]Z = 2.27 for mag and [Fe/H]Z = 6.21 for mag yields a slightly better fit, particularly at the lowest metallicities.
The galactic GC metallicity scale of Zinn & West (1984) is in turn tied to the early high and moderate resolution spectroscopic work on individual stars in Galactic GCs of Cohen (1983) and references therein. The high metallicity end of the Galactic GCs, where accurate calibration data were very limited until quite recently, remains an area of concern. It has taken almost 20 years from JGC’s initial efforts to properly calibrate the high metallicity end of the Galactic GCs, but recently this was carried out through high dispersion analyses of stars in the very metal rich galactic GCs NGC N553 and NGC 6528 by Cohen et al. (1999) and by Carretta et al. (2001).
We consider the relationship between the Zinn & West (1984) [Fe/H] determinations for the Galactic GCs and those found from their Lick indices with the models of Thomas, Maraston & Bender (2002). The NaD lines are ignored when the cluster reddening is high due to possible contributions from the interstellar medium. This is shown for the 35 calibrating Galactic GCs in Figure 14. The resulting best linear fit is
| (3) |
The 1 rms about this fit is 0.20 dex. The major outliers are NGC 6528, which is 0.25 dex above the mean line, NGC 7006 and NGC 362. The first may actually represent the probable presence of curvature (i.e. a second order term), while for the last two, we suggest that the observed indices may be inaccurate. The constant offset arises from the -enhancement included in [Z/H]. One would expect the slope in equation 3 to be unity, but it is not. In fact, it is very close to the slopes of equations 1 and 2.
We next consider the relationship, shown in Figure 15, between the photometric metallicities for the M49 GCs derived by Geisler, Lee & Kim (1996) and the spectroscopic metallicities we obtain using the -enhanced Thomas, Maraston & Bender (2002) models. It looks fairly good except at the low metallicity end. There any photometric metallicity indicator is rapidly losing sensitivity, and even precise photometry cannot easily produce accurate GC metallicities. The linear fit shown in the figure is
| (4) |
The dispersion around this fit is 0.31 dex. Again we see a constant offset due to the use of -enhanced models by Thomas, Maraston & Bender (2002) with a slope comparable to those of equations 1, 2 and 3.
In order to understand the origin of the non-unity slope in equations 1 to 4, we must look carefully at the three metallicity scales involved. The abundances of the most metal rich Galactic GCs are still controversial. Cohen et al. (1999) and Carretta et al. (2001) analyze the spectra of RHB stars to derive [Fe/H] = 0.06 dex and [Fe/H] = +0.07 dex (with an error of dex) for NGC 6553 and for NGC 6528 respectively. However, other recent spectroscopic analyses still obtain much lower values. We do not consider the work of Coelho et al. (2001) due to the low dispersion of their spectra. The work of Barbuy et al. (1999), who found [Fe/H] = dex for NGC 6553, is suspect due to the complexity of the spectra of the very cool giants near the tip of the RGB. Origlia, Rich & Castro (2002) obtained, from spectra in the near-IR, [Fe/H] = dex, which agrees to within 1 with our adopted result.
All of the high dispersion studies mentioned above find that these very metal rich galactic GCs show -enhancements of about a factor of 2. It is, however, much harder to get the absolute abundances, i.e. [Fe/H], correct than to obtain reasonably accurate abundance ratios. We adopt here the [Fe/H] values from Cohen et al. (1999) and Carretta et al. (2001) to define the metal rich end of the galactic GC calibration.
The values adopted by Zinn & West (1984) for NGC 6553 and NGC 6528 are [Fe/H]Z = and +0.12 dex respectively; for NGC 6528, this is close to our adopted value, but their abundance for NGC 6553 is 0.23 dex lower than ours. The values for these two GCs from the Thomas, Maraston & Bender (2002) models are (ignoring the NaD index) [Z/H] 0.01 and dex respectively. These values are significantly lower than those we adopt when the -enhancement is factored in. The spectroscopic evidence cited above suggests that the Zinn & West (1984) scale is closer to the best data available today than is the metallicity scale of Thomas, Maraston & Bender (2002). Carretta et al. (2001) discuss in detail the calibration of the Zinn & West (1984) metallicity scale using the set of the best high dispersion spectroscopic analyses of individual stars in Galactic GCs available to date.
Another important part of this problem of the origin of non-unity slopes found in equations 1-4 lies at very low metallicities. On the basis of the Mgb indices alone, the eight most metal poor calibrating Galactic GCs, with [Fe/H] dex, all fall somewhat below the lower end of the metallicity of the Worthey (1994) model grid at [Fe/H] dex and well below the end of that of Thomas, Maraston & Bender (2002) metallicity models at a nominal [Z/H] of dex. (In their metallicity calibration, they only consider Galactic GCs with [Fe/H].)
Together, these differences in scale at the metal-poor and the metal-rich end of the Galactic GC distribution give rise to the slope of the linear relationship between the Zinn and Thomas, Maraston & Bender (2002) or Worthey (1994) metallicity scales being 0.8 in equations 1 to 4.
An additional and very serious concern is that Galactic GCs simply do not span the full range of metallicity achieved by the M49 and M87 GCs, and so the models for the highest metallicity range of interest for the Virgo GCs are poorly calibrated and poorly tested. Fitting functions for the Lick indices based on observations of field stars are not well defined at such high metallicities either. Worthey (1994) provides data to [Fe/H]W = +0.5 dex, while Thomas, Maraston & Bender (2002) calculate indices to [Z/H] = +0.67 dex.
6 Metallicity Distribution of the M49 GCs
We first need to establish whether the spectroscopic sample is representative of the M49 GC system. We assume that the complete list of GC candidates of Geisler, Lee & Kim (1996), within the broad color cut we adopt, is free of selection effects that are color dependent. This may not be true, as foreground stars will mostly be M dwarfs at the red end of the color distribution of the GC candidates. Background galaxies and M dwarfs, however, appear to be rare interlopers within the central region of the Geisler, Lee & Kim (1996) sample. Figure 16 displays a histogram of the GC candidates extracted from photometric database of Geisler, Lee & Kim (1996) within the radial range of our M49 GC sample and brighter than our limiting magnitude, as well as similar histogram for the sample of M49 GCs observed spectroscopically, including those candidates which turned out not to be M49 GCs. (Note that the vertical scale is different for the two samples; that of the former is eight times larger.) The spectroscopic sample appears to be a reasonably fair representation of the M49 GC system. 666A KS test shows that the probability that the two distributions are identical is low (19%), but our goal is a rough estimate of a small number (a maximum of two) of parameters describing the metallicity distribution of the M49 GCs. Hence the correlations of the indices among the spectroscopic sample of M49 GCs can be used to delineate the trends of metallicity and age and related statistical properties within the M49 GC system. Note in particular that we have sampled close to the full range in color of the M49 GCs candidates.
The 95% low metallicity level given in Table 5 for the M49 GCs is obtained by sorting the abundances from Table 6 (Table 1 of Cohen, Blakeslee & Ryzhov, 1998, for M87), and is dex; the upper end of the metallicity range is obtained in a similar manner. The maximum metallicity achieved by the M49 GC system is [Fe/H]Z = +0.4 dex, with /Fe +0.3 dex.
The mean metallicity of the GC system of M49 is substantially below that of the galaxy itself, for which several Lick indices have been measured by Davies, Sadler & Peletier (1993) and by Fisher, Franx & Illingworth (1995) from long slit spectra. The highest metallicity reached by the M49 GCs is, however, comparable to that of the central region of the galaxy M49 itself, given as [Fe/H] = +0.24 dex, with [Mg/Fe] = +0.25 dex, by Terlevich & Forbes (2002). This is also true for the Galactic GC system. M49 is a very luminous galaxy, and a metallicity-luminosity relation exists among early type galaxies (e.g. Kuntschner et al., 2002), so it is not surprising to find that the mean metallicity of M49 and of the most metal rich of its GCs to be two to three times Solar in [Fe/H], but with a significant -enhancement.
Table 7 lists the total luminosity of the galaxy and the mean metallicity and the approximate location of the peaks in the metallicity distribution for the five best studied GC systems, M49, M87, NGC 1399 (the central galaxy in the Fornax cluster), M31 and the Galaxy as determined from ground based and HST photometry and from our spectroscopy. These values are all given on the Zinn & West (1984) scale. The locations of the two peaks determined from our spectroscopic sample in M49 is quite uncertain ( dex) due to the relatively small size of the sample. Yet another metallicity calibration is required here to convert the photometry from HST to [Fe/H]; we adopt the relationship given by Barmby et al. (2000). The agreement between the photometric and spectroscopic determinations of the peaks in the M87 GC system is good. 777The conversion of Kissler-Patig et al. (1998) when applied to the HST photometry yields significantly worse agreement with the spectroscopic metallicities. The Kissler-Patig et al. (1998) metallicity scale may not be properly calibrated at high metallicities; [Fe/H]/ appears to be too small. All three measures agree to within the stated uncertainties for the lower metallicity peak in M49.
7 M49 GC Ages
H is the index among those used here with the highest sensitivity to cluster age. H versus strong metal line equivalent width relations have been used to attempt to determine ages from integrated light spectra for many years (see Rabin, 1982, for an early example). However, the separation with age of the metallicity-H contours of the models for ages exceeding 5 Gyr is small, and decreases as the metallicity increases. The observational errors in the H index are fairly large, certainly larger than the separation of the contours between 8 and 15 Gyr, and are to first order independent of metallicity. This makes the determination of ages quite uncertain. It is impossible to determine ages for individual GCs in M49, and we must resort to median lines, polynomial fits to the index-index relations of the GCs as a whole, or summing of the spectra of individual GCs.
In addition, the treatment in the models of the horizontal branch, whose hotter stars can contribute strongly to H (Lee, Yoon & Lee, 2000), has improved with time. Although Worthey (1994) included the HB as a red clump for all clusters, Thomas, Maraston & Bender (2002) add a HB whose characteristics depend on the metallicity of the GC. This change produces a non-negligable change in the predicted H index in the integrated light of an old very metal poor cluster. It should also be noted that the Thomas, Maraston & Bender (2002) models without -enhancement predict lower Mgb indices than the Worthey (1994) models of the same metallicity, although they agree in their predictions for the Fe and NaD indices. This may be due to the contribution of these hotter stars at the bluest wavelengths relevant here.
We determined the ages of the M49 GCs using each of the two model grids. First, we used the H observations of the GCs to define a median line in H versus Mgb. This was combined with the Worthey (1994) models, just as was done for the M87 GCs in Cohen, Blakeslee & Ryzhov (1998). The GCs were sorted by metallicity and binned into groups of 10. The median age within each group is given in Table 8. The deduced ages are 10 Gyr or older for all clusters with [Fe/H] dex. Since Beasley et al. (2000) also used the Worthey (1994) models, they too deduced that all the M49 GCs are older than 14 Gyr.
Geisler 6051 has the strongest observed H index of all the M49 GCs; it is 2 stronger than expected for an age of 8 Gyr. Since for a Gaussian distribution we would expect 5% of the sample to lie off the mean line by 2 or more, it is unlikely that this single discrepant cluster is young.
Splitting the M49 GCs into metal rich and metal poor groups at [Fe/H]Z = dex, we find (table 8) mean ages of 13.9 and 12.8 Gyr for each of these respectively using the models of Worthey (1994). This is a very small age difference.
We also attempted a similar treatment using the models of Thomas, Maraston & Bender (2002) of H as a function of Mgb and as a function of [MgFe] ([MgFe] = ), which Puzia (2003) found to be a metallicity index with minimum sensitivity to possible variations in /Fe. We sorted the sample in order of the [Fe/H]Z, ignoring those with low SNR (SNR ), and summed the spectra into 5 bins, each of which contains 8 M49 GCs. The metallicity range of each bin is given in Table 9. The resulting spectra are shown in Figure 17. These summed spectra have 8,000 to 10,000 DN/pixel in the continuum at 5200 Å and each has a minimum SNR of 28.3. The figure also shows the spectrum of Geisler 2860, which is a Galactic star, and whose single spectrum has a SNR of 29.9. Almost all of the features seen in this figure are real. Furthermore, the increase in metallicity from bin to bin and the corresponding decrease in H line strength are obvious in the summed spectra. We measured the H index for the summed spectrum of each bin. This is shown as a function of [MgFe]888Here in calculating [MgFe] we set any negative Fe5335 or Fe5270 indices to 0.3 Å. in Figure 18. The thin lines represent the models of Thomas, Maraston & Bender (2002) for ages of 5, 8, 12, and 15 Gyr. The thick dashed line is the second order fit to the M87 GCs.
Table 9 gives the result. If the models of Thomas, Maraston & Bender (2002) are correct, the ages of the M49 GCs systematically decrease as the metallicity increases from a mean age of more than 15 Gyr for the most metal poor GCs to a mean age of 5 Gyr for the most metal rich, with a mean age for the GC system as a whole of 10 Gyr. Furthermore, the M87 GCs then have ages exceeding 15 Gyr for all metallicities (see Figure 18).
We look again at the Galactic globular clusters for clues as to which set of models for the key H index are better. The very strong H indices predicted for the most metal poor GCs for any age by the Thomas, Maraston & Bender (2002) models are not present in the M49 GC sample, where the mean H for the most metal-poor bin is 1.95 Å and the deduced age exceeds 15 Gyr. The Worthey (1994) models predict H to be 2.44 Å for very low metallicity and an age of 12 Gyr, which is a better fit to our observations in M49 and to those of Cohen, Blakeslee & Ryzhov (1998) in M87, this difference presumably arising from the different treatment of the HB between the two sets of models. Evidence from the Galactic globular clusters (see Figure 7) suggests an intermediate value for the mean H index among the most metal poor GCs, but still not as high as the Thomas, Maraston & Bender (2002) models suggest. The scatter of H measured among the low metallicity Galactic globular clusters, shown in Figure 7, is large. If the uncertainties given by Covino, Galletti & Pasinetti (1995) are realistic, then this range is too large to be due to measurement errors, and may represent variations in the relative contribution to the integrated light of the HB or variations in the distribution of stars along the HB.
If one wishes to overinterpret the data and if one believes that the Thomas, Maraston & Bender (2002) models better represent reality for the Balmer lines, which they unquestionably do for the metallic lines due to incorporation of -enhancement, one could claim that the most metal poor GCs in M49 are the oldest, and the mean age of the M49 GCs decreases from 15 Gyr to 5 Gyr as the metallicity increases. For present purposes, we adopt the age results from the Worthey (1994) models. However, the only safe statement in our view is that the M49 GCs are in the mean older than 10 Gyr. Further speculation about the details of the age distribution of the M49 GCs requires observational data of still higher quality as well as an exquisite understanding of the nature of the HB in extragalactic GC systems, neither of which is currently available.
8 Implications for Globular Cluster Formation
We have discovered here that enhancement of the elements (Mg, Ca, Na) is common in the GC systems of massive galaxies. Following upon the work of Cohen, Blakeslee & Ryzhov (1998), we have detected this in both M49 and in M87. Such an enhancement is a well known feature of Galactic globular clusters, and those few which are known or suspected to be young in the Galaxy are also known to have no or smaller -enhancements (Brown, Wallerstein & Zucker, 1997; Smith, Sneden & Kraft, 2002). Cohen (2003) also has found that a similar -enhancement is characteristic of the M31 GCs.
In the Galaxy, where detailed study with exquisite precision of at least nearby individual stellar populations is possible, Reddy et al. (2002) have demonstrated that the stars of the thin disk in the Solar neighborhood (i.e. with between 7 and 10 kpc) show very small scatter in element ratios, with element ratios essentially Solar. Separating the sample into thick disk stars and thin disk stars on the basis of their kinematics, they find the former to have in the mean higher enhancements for the -elements Mg, Si, Ca and Ti than do the thin disk stars. Furthermore, they find a relatively clean age-metallicity relationship characterized by a slow monotonic decrease of metallicity with age, with considerable scatter about this trend.
A model for the chemical evolution of a galaxy requires adding up the contributions of SNII, SNIa and AGB stars. If the contribution of type Ia SN, which produce a smaller ratio of /Fe elements in their ejecta, is delayed compared to that of SNII, which produce copious amounts of elements, but little Fe, -enhancements can result. Such circumstances prevailed in the young galaxy, before SNIa, with their longer required timescale, started exploding, while SNII come from massive stars with short lifetimes.
The roughly equal -enhancement seen in these four GC systems, and the fact that this is seen among both metal rich and metal poor GCs within these systems, provides a crude chronometer and suggests that the GCs in these systems are mostly old, with ages of 10 Gyr or longer. Additional recent spectroscopic studies with much smaller samples of GCs in quiescent massive bulge dominated galaxies including the Sombrero galaxy (M104=NGC 4594) by Larsen et al. (2002) and NGC 1399, the central galaxy in the Fornax cluster, by Forbes et al. (2002) find similar old ages.
Relative ages for subsamples within a GC system can be obtained with a number of assumptions about the GC mass function from photometric analyses by measuring the brightness of the turnover of the GC luminosity function and comparing to predictions from single-burst population models. This technique has been applied to M49 by Puzia et al. (1999), who found no difference in age larger than 3 Gyr between the metal poor and metal rich GC populations. Jordan et al. (2002) have applied such techniques to M87, where again no age difference of more than 0.5 Gyr was found between the metal rich and metal poor populations. Thus the uniformly old ages found through spectroscopic observations in M87 and in M49 when the Worthey (1994) models are used are supported by photometric analyses. The old ages of the GCs in these galaxies, and the small difference in their relative ages, are consistent with the predictions of empirical models for the hierarchical growth that involves no GC formation (e.g., Côté, Marzke & West, 1998). However, the very steep protogalactic mass spectra required to explain the detailed shape of the GC metallicity distributions in the context of this scenario remains problematical
Models for GC formation which involve the formation of GCs in late epoch mergers such as those of Ashman & Zepf (1992) and Bekki et al. (2002) must somehow push those mergers back earlier in time, earlier than . Evidence from the study of distant galaxies in situ at such redshifts also suggests that massive galaxies are more or less completely assembled by (Cohen, 2002) and are at least partially assembled without major ongoing star formation at (Labbe et al., 2003). Beasley et al. (2002) investigate the formation of GCs within the framework of the treatment of semi-analytical galaxy formation of Cole et al. (2000). They find age differences of 1–7 Gyr between the metal poor GCs, which are formed at high redshift in proto-galactic fragments, and the metal rich GCs, which are formed during subsequent mergers. The inferred age differences, however, ultimately depend on their assumption of a truncated formation history for the metal-poor cluster and a metallicity-dependent cluster formation efficiency. It appears that fully successful model of GC formation does not exist at the present time.
References
- Ashman & Zepf (1992) Ashman, K. & Zepf, S., 1992, ApJ, 384, 50
- Barmby et al. (2000) Barmby, P., Huchra, J. P., Brodie, J. P., Forbes, D. A., Schroder, L. L. & Grillmair, C. J., 2000, AJ, 119, 727
- Barbuy et al. (1999) Barbuy, B., Renzini, A., Ortolani, S., Bica, E. & Guarnieri, M. D., 1999, A&A, 341, 539
- Beasley et al. (2000) Beasley, M. A., Sharples, R. M., Bridges, T. J., Hanes, D. A., Zepf, S. E., Ashman, K. M. & Geisler, D., 2000, MNRAS, 318, 1249
- Beasley et al. (2002) Beasley, M. A., Baugh, C. M., Forbes, D. A., Sharples, R. M. & Frenk, C. S., 2002, MNRAS, 333, 383
- Bekki et al. (2002) Bekki, K., Forbes, D.A., Beasley, M.A., & Couch, W. J., 2002, MNRAS, 335, 1176
- Brown, Wallerstein & Zucker (1997) Brown, J. A., Wallerstein, G. & Zucker, D., 1997, AJ, 114, 180
- Burstein et al. (1986) Burstein, D., Faber, S. M., Gaskell, C. M. & Krumm, N., 1984, ApJ, 287, 586
- Carney & Harris (2001) Carney, B. W. & Harris, W. E., in Star Clusters: Saas-Fee Advanced Course 28, ed. L.Labhardt and B.Binggeli, 2001, (Springer, Swiss Society for Astrophysics and Astronomy)
- Carretta et al. (2001) Carretta, E., Cohen, J. G., Gratton, R. & Behr, B., 2001, AJ, 122, 1469
- Carretta et al. (2002) Carretta, E., Gratton, R., Cohen, J. G., Beers, T. C. & Christlieb, N. C., 2002, AJ, 124, 481
- Chieffi, Straniero & Salaris (1991) Cieffi, A., Strnaiero, O. & Salaris, M., 1991, in The Formation and Evolution of Star Clusters, ed. K. Janes, ASP Conf. Series 13, pg. 219
- Coelho et al. (2001) Coelho, P., Barbuy, B., Perrin, M. N., Idiart, T., Schiavon, R. P., Ortolani, S. & Bica, B., 2001, A&A, 376, 136
- Cohen (1983) Cohen, J. G., 1983, ApJ, 270, 654
- Cohen (1988) Cohen, J. G., 1988, AJ, 95, 982
- Cohen & Ryzhov (1997) Cohen, J. G. & Ryzhov, A., 1997, ApJ, 486, 230
- Cohen, Blakeslee & Ryzhov (1998) Cohen, J. G., Blakeslee, J. P. & Ryzhov, A., 1998, ApJ, 496, 808
- Cohen et al. (1999) Cohen, J. G., Gratton, R., Behr, B. & Carretta, E., 1999, ApJ, 523, 739
- Cohen (2000) Cohen, J. G., 2000, AJ, 119, 162
- Cohen (2002) Cohen, J. G., 2002, ApJ, 567, 672
- Cohen et al. (2002) Cohen, J. G., Christlieb, N. C., Beers, T. C., Gratton, R. & Carretta, E., 2002, AJ, 2002, 124, 470
- Cohen (2003) Cohen, J. G., 2003, in preparation
- Cole et al. (2000) Cole, S., Lacey, C. G., Baugh, C. M. & Frenk, C. S., 2000, MNRAS, 319, 168
- Côté, Marzke & West (1998) Côté, P., Marzke, R. & West, M., 1998, ApJ, 501, 554
- Côté et al. (2001) Côté, P., McLaughlin, D. B., Hanes, D. A., Bridges, T. J., Geisler, D., Hesser, J. E., Harris, G. L. H. & Lee, M. G., 2001, ApJ, 559, 828
- Côté et al. (2003) Côté, P., McLaughlin, D. B., Cohen, J. G. & Blakeslee, J. P., 2003, ApJ, submitted
- Covino, Galletti & Pasinetti (1995) Covino, S., Galletti, S. & Pasinetti, L. E., 1995, A&A, 303, 79
- Davies et al. (2001) Davies, R. L. et al., 2001, ApJ, 548, L33
- Davies, Sadler & Peletier (1993) Davies, R. L., Sadler, E. M. & Peletier, R. F., 1993, MNRAS, 262, 650
- de Vaucouluers & Pence (1978) de Vaucouluers, G. & Pence, W. D., 1978, AJ, 83, 1163
- de Vaucouluers et al. (1991) de Vaucouluers, G., de Vaucouluers, A., Corwin Jr., H. G., Buta, R. J., Paturel, G. & Fouque, P., 1991, Third Reference Catalogue of Bright Galaxies, Springer-Verlag, N.Y.
- Dirsch et al. (2003) Dirsch, B., Richtler, T., Geisler, D., Forte, J. C., Bassino, L. P. & Gieren, W. P., 2003, AJ (in press) (Astro-ph/0301223)
- Eisenstein et al. (2003) Eisenstein, D. et al., 2003, ApJ (in press), (Astro-ph/0212087)
- Faber et al. (1985) Faber, S. M., Friel, E. D., Burstein, D. & Gaskell, C. M., 1985, ApJS, 57, 711
- Fisher, Franx & Illingworth (1995) Fisher, D., Franx, M. & Illingworth, G., 1995, ApJ, 448, 119
- Forbes et al. (2002) Forbes, D. A., Beasley, M. A., Brodie, J. P. & Kissler-Patig, M., 2002, ApJ, 563, L143
- Freedman et al. (2001) Freedman, W. L. et al., 2001, ApJ, 553, 47
- Fusi Pecci et al. (1996) Fusi Pecci, F., Bellazzini, M., Cacciari, C. & Ferraro, F. R., 1995, AJ, 110, 1664
- Geisler & Forte (1990) Geisler, D. & Forte, J. C., 1990, ApJ, 350, L5
- Geisler, Lee & Kim (1996) Geisler, D., Lee, M. G. & Kim, E. Y., 1996, AJ, 111, 1529
- Hanes et al. (2001) Hanes, D. A., Côté, P., Bridges, T. J., McLaughlin, D. B., Geisler, D., Harris, G. L. H. & Hesser, J. E., 2001, ApJ, 559, 812
- Harris & Canterna (1977) Harris, H. C. & Canterna, R., 1977, AJ, 82, 798
- Harris (1991) Harris, W. E., 1991, ARA&A, 29, 543
- Harris (1996) Harris, W. E., 1996, AJ, 112, 1487
- Ibata et al. (1997) Ibata, R. A., Wyse, R. F. G., Gilmore, G., Irwin, M. J. & Suntzeff, N. B., 1997, AJ, 113, 634
- Jordan et al. (2002) Jordan, A. S., Côté, P., West, M. J. & Marzke, R. O., 2002, ApJ, 576, L113
- Kissler-Patig et al. (1998) Kissler-Patig, M., Brodie, J.P., Schroder, L.L., Forbes, D.A., Grillmair, C.J., & Huchra, J.P. 1998, AJ, 115, 105
- Kuntschner et al. (2002) Kuntschner, H., Smith, R. J., Colless, M., Davies, R. L., Kaldare, R. & Vazdekis, A., 2002, MNRAS, 337, 172
- Labbe et al. (2003) Labbe, I., Franx, M., Rudnick, G., Forster Schreiber, N. M., van der Werf, P., Rottgering, H., van Starkenburg, L., van de Wel, A., Rix, H.-W., Moorhead, A., Daddi, E. & van Dokkum, P. G., 2003, AJ (in press) (Astroph/0212236)
- Larsen et al. (2001) Larsen, S. S., Brodie, J.P., Huchra, J.P., Forbes, D.A., & Grillmair, C.J. 2001, AJ, 121, 2974
- Larsen et al. (2002) Larsen, S. S., Brodie, J. P., Beasley, M. A. Forbes, D. A., 2002, AJ, 124, 828
- Lee & Geisler (1993) Lee, M. G. & Geisler, D., 1993, AJ, 106, 493
- Lee, Yoon & Lee (2000) Lee, H. C., Yoon, S. J. & Lee, Y. W., 2000, AJ, 120, 998
- Maraston et al. (2003) Maraston, C., Greggio, L., Renzini, A., Ortolani, S., Saglia, R, P., Puzia, T. H. & Kissler-Patig, M., 2003 A&A, 400, 823
- McLaughlin, Harris & Hanes (1994) McLaughlin, D.E., Harris, W.E., & Hanes, D.A. 1994, ApJ, 422, 486
- McWilliam (1997) McWilliam, A., 1997, ARA&A, 35, 503
- Mould et al. (1990) Mould, J. R., Oke, J. B. & de Zeeuw, P. t. & Nemec, J. M., 1990, AJ, 99, 1823
- Oke et al. (1995) Oke, J. B., Cohen, J. G., Carr, M., Cromer, J., Dingizian, A., Harris, F. H., Labrecque, S., Lucinio, R., Schaal, W., Epps, H. & Miller, J., 1995, PASP, 107, 307
- Origlia, Rich & Castro (2002) Origlia, L, Rich, R. M. & Castro, S., 2002, AJ, 123, 1559
- Ostrov, Forte & Geisler (1998) Ostrov, P. G., Forte, J. C. & Geisler, D., 1998, AJ, 116, 2854
- Perrett et al. (1996) Perrett, K. M., Bridges, T. J., Hanes, D. A., Irwin, M. J., Brodie, J. P., Carter, D., Huchra, J. P. & Watson, F. G., 2002, AJ, 123, 2490
- Proctor & Sansom (2002) Proctor, R. N. & Sansom, A. E., 2002, MNRAS, 333, 517
- Puzia et al. (1999) Puzia, T. H., Kissler-Patig, M., Brodie, J. P. & Huchra, J. P., 1999, AJ, 118, 2734
- Puzia et al. (2002) Puzia, T. H., Saglia, R. P., Kissler-Patig, M., Maraston, C., Greggio, L., Renzini, A. & Ortolani, S., 2002, A&A, 395, 45
- Puzia (2003) Puzia, T. H., 2003, in Extragalactic Globular Cluster Systems, ed. M.Kissler-Patig, Springer Verlag (Astro-ph/0210418)
- Rabin (1982) Rabin, D., 1982, ApJ, 261, 85
- Ramírez & Cohen (2002) Ramírez, S. V. & Cohen, J. G., 2002, AJ, 123, 3277
- Ramírez & Cohen (2003) Ramírez, S. V. & Cohen, J. G., 2003, AJ, 125, 224
- Reddy et al. (2002) Reddy, B. E., Tomkin, J., Lambert, D. L. & Allende Prieto, C., 2002, MNRAS (in press) (Astro-ph 0211551)
- Rhode & Zepf (2001) Rhode, K.L., & Zepf, S.E. 2001, AJ, 121, 210
- Rosenberg et al. (1999) Rosenberg, A., Saviane, I., Piotto, G. & Aparicio, A., 1999, AJ, 118, 2306
- Sharples et al. (1998) Sharples, R. M., Zepf, S. E., Bridges, T. J., Hanes, D. A., Carter, D., Ashman, K. M. & Geisler, D., 1998, AJ, 115, 2337
- Schlegel, Finkbeiner & Davis (1998) Schlegel, D. J., Finkbeiner, D. P. & Davis, M.,, 1998, ApJ, 500, 525
- Shortridge (1993) Shortridge K. 1993, in Astronomical Data Analysis Software and Systems II, A.S.P. Conf. Ser., Vol 52, eds. R.J. Hannisch, R.J.V. Brissenden, & J. Barnes, pg. 219.
- Smith, Sneden & Kraft (2002) Smith, G. H., Sneden, C. & Kraft, R. P., 2002, AJ, 123, 1502
- Strom et al. (1981) Strom, S.E., Forte, J., Harris, W., Strom, K.M., Wells, D., & Smith, M. 1981, ApJ, 245, 416
- Terlevich & Forbes (2002) Terlevich, A. I. & Forbes, D. A., MNRAS, 330, 547
- Thomas, Maraston & Bender (2002) Thomas, D., Maraston, C. & Bender, R., 2002, MNRAS, in press (Astro-ph/0209250)
- Trager et al. (1998) Trager, S. C., Worthey, G., Faber, S. M., Burstein, D. & Gonzalez, J. J., 1998, ApJS, 116, 1
- Trager et al. (2000) Trager, S. C., Faber, S. M., Worthey, G. & Gonzales, J. J., 2000, AJ, 119, 1645
- Trippico & Bell (1995) Trippico, M. J. & Bell, R. A., 1995, AJ, 110, 3035
- Whitmore et al. (1995) Whitmore, B. C., Sparks, W. B., Lucas, R. A., Duccio Macchetto, D. & Biretta, J. A., 1995, ApJ, 454, L73
- Worthey, Faber & Gonzalez (1992) Worthey, G., Faber, S. M. & Gonzales, J. J., 1992, ApJ, 398, 69
- Worthey et al. (1994) Worthey, G., Faber, S. M., Gonzales, J. J. & Burstein, D.. 1994, ApJS, 94, 687
- Worthey (1994) Worthey, G., 1994. ApJS, 95, 107
- Vandenberg et al. (2000) Vandenberg, D. A., Swenson, F. J., Rogers, F. J., Iglesias, C. A. & Alexander, D. R., 2000, ApJ, 532, 430
- Vazdekis (1999) Vazdekis, A., 1999, ApJ, 513, 224
- Zepf et al. (2000) Zepf, S. E., Beasley, M. A., Bridges, T. J., Hanes, D. A., Sharples, R. M., Ashman, K. M. & Geisler, D., 2000, AJ, 120, 2928
- Zinn & West (1984) Zinn, R. J. & West, M. J., 1984, ApJS, 55, 45
| IDaaIDs in parentheses denote serendipitous galaxies found in the slitlet intended for the GC candidate listed. The database of Geisler, Lee & Kim (1996) is used. | RA | Dec | ||
|---|---|---|---|---|
| (1950) | (1950) | (mag) | ||
| (1650) | 12 27 23.68 | +8 13 42.3 | 23.5 | 0.629bbThis redshift is based on a single emission line assumed to be that of [OII] at 3727 Å. |
| 1982 | 12 27 09.13 | +8 13 42.1 | 20.6 | 0.086 |
| (1982) | 12 27 09.97 | +8 13 42.3 | 23.7 | 0.434 |
| (2569) | 12 27 11.68 | +8 14 31.6 | 23.3 | 0.091 |
| (1798) | 12 27 12.48 | +8 13 25.0 | 22.1 | 0.314ccThe redshift for this galaxy comes from H+K absorption. For all the other galaxies in this table, it is derived from emission lines. |
| IDaafrom Geisler, Lee & Kim (1996) | H | Mg2 | Mg1 | Mgb | Fe5270 | Fe5335 | NaD | Ti01 | Ti02 | H | SNRbbSignal to noise per spectral pixel over the region 5950 to 6250 Å. |
|---|---|---|---|---|---|---|---|---|---|---|---|
| (Å) | (mag) | (mag) | (Å) | (Å) | (Å) | (Å) | (mag) | (mag) | (Å) | ||
| 1475 | 2.13 | 0.14 | 0.045 | 2.11 | 3.14 | 0.59 | 0.46 | 0.031 | 0.060 | 2.04 | 16.3 |
| 1508 | 0.30 | 0.31 | 0.081 | 4.81 | 2.60 | 1.71 | 5.58 | 0.055 | 0.201 | 2.25 | 5.4 |
| 1650 | 1.31 | 0.31 | 0.101 | 5.50 | 2.65 | 2.91 | 3.98 | 0.038 | 0.058 | 0.74 | 15.1 |
| 1731 | 1.60 | 0.24 | 0.101 | 4.54 | 2.57 | 4.20 | 1.66 | 0.039 | 0.106 | 1.62 | 11.8 |
| 1798 | 1.33 | 0.36 | 0.117 | 5.81 | 2.78 | 3.45 | 5.73 | 0.044 | 0.095 | 0.81 | 14.7 |
| 1846 | 0.03 | 0.37 | 0.201 | 5.61 | 3.36 | 3.28 | 5.56 | 0.084 | 0.109 | 1.97 | 8.7 |
| 1889 | 2.42 | 0.03 | 0.010 | 0.67 | 1.00 | 0.30 | 0.90 | 0.014 | 0.084 | 2.60 | 14.1 |
| 1892 | 0.89 | 0.07 | 0.018 | 1.82 | 0.03 | 0.55 | 0.37 | 0.052 | 0.021 | 2.48 | 9.4 |
| 1905 | 2.85 | 0.08 | 0.015 | 2.04 | 2.58 | 1.20 | 3.60 | 0.007 | 0.004 | 3.25 | 13.4 |
| 2013 | 2.47 | 0.08 | 0.044 | 0.61 | 1.50 | 1.14 | 2.41 | 0.030 | 0.043 | 2.35 | 13.2 |
| 2031 | 2.87 | 0.10 | 0.027 | 1.80 | 2.07 | 1.25 | 1.72 | 0.012 | 0.010 | 2.19 | 17.2 |
| 2045 | 1.58 | 0.19 | 0.105 | 2.92 | 3.16 | 2.38 | 3.00 | 0.034 | 0.063 | 1.95 | 15.2 |
| 2060 | 1.74 | 0.08 | 0.017 | 1.02 | 1.33 | 1.78 | 0.92 | 0.006 | 0.159 | 2.63 | 27.6 |
| 2178 | 1.59 | 0.04 | 0.010 | 1.86 | 0.04 | 1.35 | 1.25 | 0.013 | 0.024 | 2.68 | 10.8 |
| 2188 | 0.90 | 0.13 | 0.027 | 2.60 | 1.75 | 0.37 | 1.30 | 0.025 | 0.040 | 2.03 | 13.1 |
| 2306 | 1.86 | 0.18 | 0.087 | 2.80 | 2.74 | 0.64 | 1.87 | 0.034 | 0.048 | 2.24 | 19.9 |
| 2406 | 0.66 | 0.35 | 0.157 | 5.39 | 3.96 | 3.01 | 5.42 | 0.052 | 0.092 | 13.6 | |
| 2421 | 2.33 | 0.13 | 0.011 | 1.47 | 3.55 | 0.76 | 1.26 | 0.018 | 0.027 | 2.17 | 14.3 |
| 2502 | 2.41 | 0.23 | 0.098 | 3.92 | 3.50 | 2.25 | 3.54 | 0.035 | 0.048 | 12.7 | |
| 2528 | 2.33 | 0.09 | 0.038 | 2.14 | 1.57 | 0.98 | 1.12 | 0.012 | 0.039 | 2.00 | 22.0 |
| 2543 | 2.13 | 0.08 | 0.020 | 1.47 | 2.21 | 1.51 | 1.34 | 0.010 | 0.029 | 25.6 | |
| 2569 | 1.75 | 0.29 | 0.131 | 5.10 | 3.30 | 2.64 | 4.72 | 0.039 | 0.063 | 23.3 | |
| 2813 | 2.16 | 0.30 | 0.168 | 5.20 | 2.57 | 2.12 | 4.62 | 0.016 | 0.078 | 10.4 | |
| 3150 | 1.78 | 0.26 | 0.112 | 4.15 | 2.74 | 2.04 | 3.14 | 0.020 | 0.119 | 1.49 | 13.0 |
| 3603 | 2.14 | 0.26 | 0.098 | 5.24 | 3.27 | 2.70 | 3.12 | 0.037 | 0.083 | 2.05 | 12.8 |
| 3788 | 2.61 | 0.18 | 0.086 | 5.13 | 4.64 | 0.50 | 2.33 | 0.018 | 0.069 | 3.18 | 8.5 |
| 3900 | 0.64 | 0.43 | 0.177 | 6.31 | 1.87 | 3.69 | 7.39 | 0.018 | 0.083 | 1.24 | 8.5 |
| 4017 | 1.37 | 0.08 | 0.037 | 1.92 | 1.00 | 1.56 | 2.12 | 0.002 | 0.011 | 1.20 | 17.1 |
| 4062 | 0.14 | 0.37 | 0.106 | 7.32 | 2.98 | 5.38 | 6.98 | 0.018 | 0.080 | 2.08 | 6.9 |
| 4144 | 2.23 | 0.04 | 0.009 | 1.91 | 1.44 | 0.78 | 0.48 | 0.011 | 0.015 | 2.31 | 19.7 |
| 4168 | 2.14 | 0.17 | 0.067 | 2.83 | 2.66 | 1.98 | 1.21 | 0.022 | 0.060 | 1.49 | 21.6 |
| 4217 | 2.13 | 0.26 | 0.062 | 4.20 | 3.96 | 2.31 | 2.95 | 0.034 | 0.037 | 2.85 | 11.1 |
| 4296 | 2.14 | 0.05 | 0.012 | 1.91 | 0.86 | 0.66 | 1.39 | 0.018 | 0.004 | 2.47 | 12.7 |
| 4351 | 1.54 | 0.05 | 0.021 | 1.08 | 0.97 | 0.00 | 0.78 | 0.031 | 0.016 | 2.20 | 12.5 |
| 4401 | 1.64 | 0.30 | 0.115 | 4.81 | 3.12 | 4.29 | 4.69 | 0.043 | 0.075 | 2.09 | 14.2 |
| 4513 | 1.79 | 0.27 | 0.139 | 4.64 | 2.19 | 2.02 | 3.14 | 0.043 | 0.083 | 1.08 | 22.1 |
| 4541 | 2.34 | 0.09 | 0.020 | 2.69 | 1.48 | 1.05 | 1.06 | 0.024 | 0.085 | 2.33 | 11.4 |
| 4663 | 1.54 | 0.24 | 0.100 | 4.27 | 3.42 | 2.29 | 2.84 | 0.030 | 0.059 | 1.96 | 17.0 |
| 4682 | 1.31 | 0.17 | 0.044 | 3.33 | 3.15 | 2.39 | 5.4 | 0.033 | 0.059 | 3.61 | 9.0 |
| 4834 | 1.53 | 0.05 | 0.011 | 1.79 | 0.98 | 1.08 | 2.11 | 0.031 | 0.035 | 13.0 | |
| 4852 | 2.06 | 0.32 | 0.153 | 6.32 | 2.94 | 2.94 | 5.09 | 0.034 | 0.088 | 10.8 | |
| 4864 | 1.92 | 0.18 | 0.078 | 3.60 | 0.20 | 1.56 | 0.76 | 0.005 | 0.008 | 22.1 | |
| 5003 | 1.62 | 0.11 | 0.019 | 2.89 | 1.09 | 1.69 | 0.67 | 0.029 | 0.056 | 15.2 | |
| 5018 | 1.19 | 0.36 | 0.165 | 5.34 | 3.78 | 2.87 | 7.98 | 0.050 | 0.103 | 12.0 | |
| 5097 | 1.27 | 0.46 | 0.225 | 7.47 | 3.37 | 3.25 | 9.19 | 0.070 | 0.100 | 12.2 | |
| 5217 | 2.80 | 0.07 | 0.008 | 1.36 | 0.60 | 2.29 | 1.21 | 0.000 | 0.011 | 15.5 | |
| 6051 | 3.61 | 0.12 | 0.042 | 3.43 | 1.94 | 1.39 | 1.35 | 0.000 | 0.658 | 15.6 |
| X | Y | Sample | A | B | C |
|---|---|---|---|---|---|
| (Index) | (Index) | ||||
| Mgb | Na | All | 1.674 | 0.225 | |
| Mgb | Fe | All | 0.927 | 0.241 | 0.023 |
| Mgb | H | All | 2.010 | 0.0113 | |
| Mgb | H | AllbbOnly 34 of the 47 M49 GCs in our sample have measured H indices, 7 of which are highly uncertain. | 2.728 | 0.010 | |
| H | H | High SNRbbOnly 34 of the 47 M49 GCs in our sample have measured H indices, 7 of which are highly uncertain. | 0.795 | 0.624 |
| Galaxy | Min | 1st Quartile | Median | 3rd Quartile | Median / bbGalaxy scale lengths from Côté et al. (2003) for M49 and from Côté et al. (2001) for M87. |
|---|---|---|---|---|---|
| (Arcsec) | (Arcsec) | (Arcsec) | (Arcsec) | ||
| M49 | 33 | 107 | 159 | 224 | 1.0 |
| M87aaData from Cohen, Blakeslee & Ryzhov (1998). | 24 | 120 | 214 | 313 | 1.7 |
| M49 | M87 | Galaxy | NGC6553, | |||
|---|---|---|---|---|---|---|
| Index | Min | Max | Min | Max | M92 | NGC 6528 |
| (Å or dex) | (Å or dex) | (Å or dex) | (Å or dex) | (Å or dex) | (Å or dex) | |
| Mgb | 0.67 | 7.32 | 0.39 | 5.19 | 0.57 | 3.80 |
| Fe | 0.10aaThis would increase to 0.5 if negative equivalent widths for the Fe5335 index were ignored. | 3.70 | 0.28 | 3.40 | 0.45 | 2.69 |
| NaD | 0.46 | 7.98 | 0.40 | 6.35 | 0.67 | 4.16bbNa D lines may be affected by interstellar absorption. |
| H | 0.14 | 2.87 | 0.67 | 2.98 | 2.53 | 1.70 |
| H | 0.81 | 3.25 | 0.97 | 3.39 | 2.35 | 1.29 |
| Z/H | 1.99 | 0.90ccThis decreases to 0.85 dex when only the Mgb and Fe indices are used, ignoring the very strong NaD lines found in the strongest lined of the M49 GCs. | … | … | 0.03ddThe NaD indices have been ignored here. | |
| Fe/H(Zinn) | 0.41 | 0.19 | 2.24 | 0.08 |
| IDaafrom Geisler, Lee & Kim (1996) | [Z/H]bbThis is the total [Z/H] obtained using the models of Thomas, Maraston & Bender (2002) as described in the text. | ErrorccThe 1 rms error in [Z/H]. | [Fe/H]Zdd[Fe/H] on the scale of Zinn & West (1984) with the Worthey (1994) models obtained following the procedures of Cohen, Blakeslee & Ryzhov (1998). |
|---|---|---|---|
| (dex) | (dex) | (dex) | |
| 1475 | 0.94 | 0.39 | 1.12 |
| 1508 | 0.32 | 0.46 | 0.11 |
| 1650 | 0.36 | 0.20 | 0.04 |
| 1731 | 0.10 | 0.29 | 0.38 |
| 1798 | 0.56 | 0.15 | 0.23 |
| 1846 | 0.54 | 0.27 | 0.22 |
| 1889 | 1.99 | 0.43 | 1.90 |
| 1892 | 1.36 | 1.36 | 1.66 |
| 1905 | 0.56 | 0.32 | 0.63 |
| 2013 | 1.93 | 0.78 | 1.22 |
| 2031 | 1.04 | 0.44 | 0.98 |
| 2045 | 0.26 | 0.32 | 0.48 |
| 2060 | 1.88 | 0.49 | 1.43 |
| 2178 | 1.30 | 0.82 | 1.22 |
| 2188 | 0.68 | 0.51 | 0.86 |
| 2306 | 0.60 | 0.29 | 0.68 |
| 2406 | 0.50 | 0.19 | 0.19 |
| 2421 | 1.16 | 0.70 | 1.10 |
| 2502 | 0.06 | 0.22 | 0.24 |
| 2528 | 0.98 | 0.31 | 1.03 |
| 2543 | 1.06 | 0.54 | 1.12 |
| 2569 | 0.38 | 0.12 | 0.05 |
| 2813 | 0.36 | 0.31 | 0.00 |
| 3150 | 0.06 | 0.22 | 0.29 |
| 3603 | 0.24 | 0.29 | 0.14 |
| 3788 | 0.24 | 0.49 | 0.25 |
| 3900 | 0.80eeThis decreases to 0.53 dex when only the Mgb and Fe indices are used, ignoring the very strong NaD lines. | 0.26 | 0.35 |
| 4017 | 0.98 | 0.36 | 0.92 |
| 4062 | 0.90 | 0.33 | 0.41 |
| 4144 | 1.10 | 0.36 | 1.32 |
| 4168 | 0.56 | 0.29 | 0.71 |
| 4217 | 0.04 | 0.26 | 0.27 |
| 4296 | 1.14 | 0.77 | 1.28 |
| 4351 | 2.06 | 0.99 | 2.05 |
| 4401 | 0.34 | 0.20 | 0.05 |
| 4513 | 0.06 | 0.15 | 0.24 |
| 4541 | 0.70 | 0.58 | 0.84 |
| 4663 | 0.04 | 0.17 | 0.29 |
| 4682 | 0.05 | 0.29 | 0.04 |
| 4834 | 0.94 | 0.66 | 1.00 |
| 4852 | 0.56 | 0.20 | 0.23 |
| 4864 | 0.22 | 0.14 | 0.69 |
| 5003 | 0.52 | 0.44 | 0.83 |
| 5018 | 0.60ffThis decreases to 0.45 dex when only the Mgb and Fe indices are used, ignoring the very strong NaD lines. | 0.25 | 0.32 |
| 5097 | 0.98ggThis decreases to 0.85 dex when only the Mgb and Fe indices are used, ignoring the very strong NaD lines. | 0.30 | 0.49 |
| 5217 | 1.50 | 0.51 | 1.25 |
| 6051 | 0.26 | 0.31 | 0.62 |
| Galaxy | MV | Low Peakaa[Fe/H] on the Zinn & West (1984) metallicity scale is given. | High Peak | Mean | Sample Size | Refbb1. This paper 2. Geisler, Lee & Kim (1996), 3. Larsen et al. (2001) , 4. Cohen, Blakeslee & Ryzhov (1998), 5. Lee & Geisler (1993), 6. Whitmore et al. (1995), 7. Kissler-Patig et al. (1998), 8. Dirsch et al. (2003), 9. Perrett et al. (1996), 10. Harris (1996). The conversion of V-I color to [Fe/H] of Barmby et al. (2000) is used for the HST data. |
|---|---|---|---|---|---|---|
| (mag) | (dex) | (dex | (dex) | |||
| M49 (spec) | ccApparent mag from de Vaucouluers et al. (1991), assuming distance of 0.77 Mpc for M31 and 16 Mpc for Virgo. For NGC 1399, we adopt their with of 71 km s-1 Mpc-1; see Freedman et al. (2001). | 47 | 1 | |||
| M49 (Wash. phot) | 1800 | 2 | ||||
| M49 (HST phot) | … | 532 | 3 | |||
| M87 (spec) | ccApparent mag from de Vaucouluers et al. (1991), assuming distance of 0.77 Mpc for M31 and 16 Mpc for Virgo. For NGC 1399, we adopt their with of 71 km s-1 Mpc-1; see Freedman et al. (2001). | 1.3 | 0.0:ddUncertain as the spectroscopic sample in M87 is dominated by GCs from the metal poor peak. | 0.95 | 150 | 4 |
| M87 (Wash. phot) | 1.3 | 407 | 5 | |||
| M87 (HST phot) | 709 | 3,6 | ||||
| NGC 1399 (spec) | ccApparent mag from de Vaucouluers et al. (1991), assuming distance of 0.77 Mpc for M31 and 16 Mpc for Virgo. For NGC 1399, we adopt their with of 71 km s-1 Mpc-1; see Freedman et al. (2001). | 18 | 7 | |||
| NGC 1399 (Wash. phot) | … | 2864 | 8 | |||
| NGC 1399 (HST phot) | … | 408 | 3 | |||
| M31 (spec) | ccApparent mag from de Vaucouluers et al. (1991), assuming distance of 0.77 Mpc for M31 and 16 Mpc for Virgo. For NGC 1399, we adopt their with of 71 km s-1 Mpc-1; see Freedman et al. (2001). | 1.44 | 0.50 | 301 | 9 | |
| Galaxy | eede Vaucouluers & Pence (1978) | 147 | 10 |
| Fe/H Range | No. | Median Age | |
|---|---|---|---|
| (dex) | (Gyr) | (Gyr) | |
| 10 | 16 | 2.8 | |
| to 0.05 | 10 | 13 | 4.3 |
| to | 10 | 11 | 3.7 |
| to | 10 | 13 | 2.4 |
| 7 | 14 | 1.6 | |
| 23 | 13.9 | 4.1 | |
| 24 | 12.8 | 2.6 |
| Z/H Range | No. | Median Age | |
|---|---|---|---|
| (dex) | (Gyr) | (Gyr) | |
| 8 | 5 | ,+6 | |
| +0.3 to +0.7 | 8 | 8 | 3 |
| to +0.3 | 8 | 10 | 3 |
| to | 8 | 15 | 3 |
| 8 |