MULTI-TeV GAMMA-RAY FLARES
FROM MARKARIAN 421 IN 2000 AND 2001 OBSERVED WITH THE TIBET AIR SHOWER ARRAY
Abstract
Several strong TeV -ray flares were detected from Markarian 421 in the years 2000 and 2001 by the Tibet III air shower array at a level of statistical significance of 5.1 . Markarian 421 was unprecedentedly active at X-ray and TeV -ray energies during this period, and a positive correlation was found between the change of the ASM/RXTE X-ray flux and the Tibet TeV -ray flux. When a power-law energy spectrum for -rays from this source is assumed, the spectral index is calculated to be 3.240.69 at the most active phase in 2001. The spectral index observed by the Tibet air shower array is consistent with those obtained via imaging air Cerenkov telescopes.
1 INTRODUCTION
A variable -ray source Markarian 421 (Mrk 421) at redshift is known to be a blazar class of active galactic nuclei (AGNs) with a common feature of BL Lac objects. Since a relativistic jet from this AGN is aligned along our line of sight, its photon emission is dominated by the jet power output, which is mainly non-thermal, extending over more than fifteen energy decades. In 1991, the EGRET detected -ray emissions from Mrk 421, which was the first detection of a BL Lac-type -ray source. Its integrated photon flux above 100 MeV was cm-2 s-1, and its differential photon energy spectrum can be represented by a power law with an exponent of 1.960.14 Lin et al. (1992). Subsequently, the first detection of TeV -rays from this source was made by the Whipple collaboration (Whipple) in 1992. The average integral flux was estimated to be cm-2 s-1 above 0.5 TeV, being 0.3 times as large as that from the Crab Nebula which often serves as the standard candle in TeV -ray astronomy Punch et al. (1992).
Occasionally, the -ray flux from Mrk 421 shows a rapid variability at TeV energies. The Whipple observed significant variabilities on a few-hour time scale on May 14 and 15 in 1994, during which the average source flux above 250 GeV increased by a factor of 10 Kerrick et al. (1995). Such rapid variabilities of TeV -ray flux were detected again by the Whipple during the period from April 20 through May 5 in 1995 Buckley et al. (1996) and in May, 1996 Gaidos et al. (1996) at sub-TeV energies. At the second outburst in 1996, which lasted for about 30 minutes, the flux increased by a factor of 20-25.
Various theoretical models of photon emission mechanisms are based basically on the Synchrotron self-Compton (SSC) model Gould (1965), combining the synchrotron photons and inverse Compton (IC) photons produced by accelerated high-energy electrons which interact with the magnetic field and the synchrotron photons, respectively, in a jet. This model naturally leads to a photon energy spectrum having two broad continuous peaks, one at energies between the infrared and X-ray regions and the other at energies between the GeV and TeV regions. This lower-energy peak is attributed to synchrotron radiation from accelerated high-energy electrons in the AGN, and the higher-energy peak is due to inverse Compton scattering of the same electrons off the soft photons (Maraschi, Ghisellini, & Celotti, 1992; Marscher & Travis, 1996). In 1995 and 1998, a simultaneous multi-wavelength observation of Mrk 421 was made, covering the radio, optical, and X-ray bands as well as the MeV-TeV -ray regions. It was shown from this observation that the multi-wavelength spectrum observed is consistent with that expected from the SSC model, suggesting a possible coincidence of X-ray and TeV -ray emissions (Macomb et al., 1995; Takahashi et al., 1996, 2000).
It has been suggested that TeV -rays from nearby AGNs are absorbed rapidly due to their interaction with the infrared photon field in the intergalactic space. Therefore, the shape of the multi-TeV -ray energy spectrum provides us important information on the column density and energy spectrum of intergalactic infrared photons. From this point of view, TeV -ray data have been used to impose an upper limit of these photons that are difficult to measure directly (De Jager, Stecker, & Salamon, 1994; Biller et al., 1995).
In the years 2000 and 2001, fortunately, Mrk 421 entered a very active phase, showing strong and frequent flaring of X-rays and TeV -rays. During this period, TeV -rays from Mrk 421 were detected via various imaging air Cerenkov telescopes (IACTs) used in the Whipple Krennrich et al. (2001), the HEGRA Krawczynski et al. (2001), the CAT Piron et al. (2001), and the CANGAROO Okumura et al. (2002) experiments. The Tibet air shower experiment also successfully detected multi-TeV -rays from this source.
In this paper, we report the result on the flux of -rays from Mrk 421 observed by this array during its outbursting period in the years 2000 and 2001 in comparison with those from the ASM/RXTE satellite and IACTs.
2 EXPERIMENT
The Tibet air shower experiment has been successfully operated at Yangbajing (E, N; 4,300 m above sea level) in Tibet, China since 1990. The Tibet I array constructed in 1990 Amenomori et al. (1992) was gradually updated by increasing the number of counters in 1995 and 1996, as briefly described elsewhere Amenomori et al. (2000, 2002). Using this array, we successfully observed multi-TeV -ray signals from the Crab Nebula in 1999 Amenomori et al. (1999) and multi-TeV -ray flares from Mrk 501 in 1997 Amenomori et al. (2000).
In the late fall of 1999, the array was further updated by adding 235 scintillation counters so as to enlarge a high density array, Tibet III, with a 7.5 m lattice interval as shown in Figure 1. The Tibet III array consists of 533 scintillation counters covering 22,050 m2. Each counter has a plastic scintillator plate (BICRON BC-408A) of 0.5 m2 in area and 3 cm in thickness and is equipped with a fast timing (FT) photomultiplier tube (PMT, Hamamatsu H1161). A 0.5 cm-thick lead plate is put on the top of each counter in order to increase the array sensitivity by converting -rays into electron-positron pairs in the shower (Bloomer, Linsley, & Watson, 1988; Amenomori et al., 1990). The relative position of each counter is measured by the use of a portable GPS (Global Positioning System) with an inaccuracy of less than 2 cm. Timing and charge information from each hit PMT is digitized by the use of a time-to-digital converter (TDC, LeCroy 1887) and a charge-sensitive analog-to-digital converter (ADC, LeCroy 1881M), respectively. All the TDCs and ADCs are regularly monitored using a FASTBUS calibration module (CAT, LeCroy 1810) every 20 minutes. The length of each signal cable is also monitored, with an inaccuracy of 0.1 ns, by measuring a mismatched-reflection pulse from each counter every 20 minutes.
An event trigger signal is issued when an any-four coincidence appears in the FT counters each recording more than 0.6 particles within a coincidence gate width of 300 ns, resulting in the trigger rate of about 680 Hz. All triggered data are collected using a computer via FASTBUS-to-VMEbus interface and stored on the data tapes (20GB/day). We collected 2.71010 events during the period from November 17, 1999 through October 10, 2001, and the live time was calculated to be 456.8 days. The event selection was made by imposing the following conditions on the recorded data: (1) each shower event should fire four or more FT-counters recording 1.25 or more particles, (2) among the 9 hottest FT-counters in each event, 8 should be contained in a fiducial area enclosed by the dashed line in Figure 1. If the number of hit counters is less than 8, the numbers of all should be contained in its area, and (3) the zenith angle of the arrival direction should be less than 40∘. After this data selection and quality cuts, 5.52109 events remain for further analysis. The mode energy of air shower events, thus obtained, is estimated to be about 3 TeV Amenomori et al. (1999), covering the upper part of the energies measured by the atmospheric Cerenkov technique.
3 PERFORMANCE OF THE TIBET III ARRAY
In order to successfully detect transient -ray signals from a point source, it is important to check the stable operation of equipment over a long period of time regarding such factors as variation of event rate, pointing accuracy, and the angular resolution of the array.
The long-term stability of the daily event rate is shown in Figure 2, where its variation is shown to be less than 5% and it is mostly due to atmospheric pressure and temperature effects. The stability in the pointing accuracy and angular resolution of the Tibet III array can be directly checked by monitoring the Moon’s shadow in the cosmic ray flux Amenomori et al. (2000). The statistical significance of the Moon’s shadow observed via the Tibet III array is 26 for 1.3-year observation, that is, a 7 level per month. The displacement of the center of the Moon’s shadow in the north-south direction enables us to estimate the systematic error in pointing accuracy and its long-term stability, since the east-west component of the geomagnetic field is almost zero at Yangbajing. The displacements of the shadow’s center from the apparent center in the north-south direction are plotted as a function of observation time in terms of a sidereal month (27.3 days) in the upper panel of Figure 3. From this figure, it is estimated that the systematic pointing error per month is smaller than , while the overall pointing error for the observation period is smaller than . The amount of cosmic-ray deficits by the Moon provides a good measure of the angular resolution. The lower panel in Figure 3 demonstrates the long-term stability of the ratio of the observed deficit counts to the expected ones within a window of the angular radius . The data show a variation smaller than 8%, confirming the stability of angular resolution.
The performance of the Tibet III array is also examined by means of a full Monte Carlo (MC) simulation. We used the Corsika Ver. 6.004 code Heck et al. (1998) for the generation of air shower events and the Epics uv7.24 code Kasahara (2003) for the detection of shower particles with scintillation counters, respectively. Primary particles were sampled from the energy spectrum made by using direct observational data (Asakimori et al., 1998; Sanuki et al., 2000; Kamioka et al., 2001) in the energy range from 0.3 TeV to 1000 TeV. The absolute flux of the primary particles is estimated with the error of about 20% at the lower energy region, while its uncertainty may become larger than 50% at energies higher than 100 TeV. Figure 4 shows the size spectrum of observed events, where the size is expressed by being the sum of the number of particles per m2 for each FT counter. The observed spectrum shows close agreement with the simulation both in terms of the event rate and the shape, as shown in Figure 4. After the event reduction described in 2, the event rates are 140 Hz for the experiment and 1301 Hz for the simulation, respectively. For more details regarding the performance of the Tibet III array, see Amenomori et al. (2001a, ; 2001b, ).
4 ANALYSIS
In order to extract an excess of TeV -ray events coming from the direction of Mrk 421, the background event density must be carefully estimated. The background is estimated by the number of events averaged over 8 off-source cells with the same angular radius as on-source, at the same zenith angle, recorded at the same time intervals as the on-source cell events. The search window radius is expressed as degrees as a function of , which maximizes the ratio according to a MC study as shown in Figure 5. This angular radius can be used for the analysis of various -ray sources, while depending weakly on the orbital motion of a source. The center positions of these off-source cells, located at every step from the source position measured in terms of angle distance in the azimuthal direction at the same zenith angle as the on-source direction, move picking up events recorded in the common time interval to the on-source cell. Here, it is worthwhile to note that two off-source cells adjacent to the on-source cell are excluded in order to avoid a possible signal tail leaking in the off-source events. This method, the so-called “equi-zenith angle background estimation”, can reliably estimate the background events under the same condition as on-source events. The Tibet III array, however, has a small anisotropy of 1.5% in maximum amplitude in the azimuthal direction, as the array is constructed on the ground with a slight slope of 3 to the normal plane in the northwest direction. Hence, we analyzed 71 different dummy sources which follow the same diurnal rotation (at the same declination) as that of Mrk 421 using the equi-zenith angle method, and corrected the anisotropy of off-source events using the azimuthal distribution averaged over 71 dummy sources events. In the case of Mrk 421, the number of off-source events decreases by (0.160.02)%. It is noted that the equi-zenith angle method fails when the source object stays very close to the zenith since an off-source cell overlaps with other cells. This method can be used when a point source exists at zenith angles larger than 6∘. In the case of Mrk 421, its zenith angle at the southing is about 8∘ at Yangbajing, so that each on/off-source cell is independent throughout the observation period.
5 RESULTS AND DISCUSSIONS
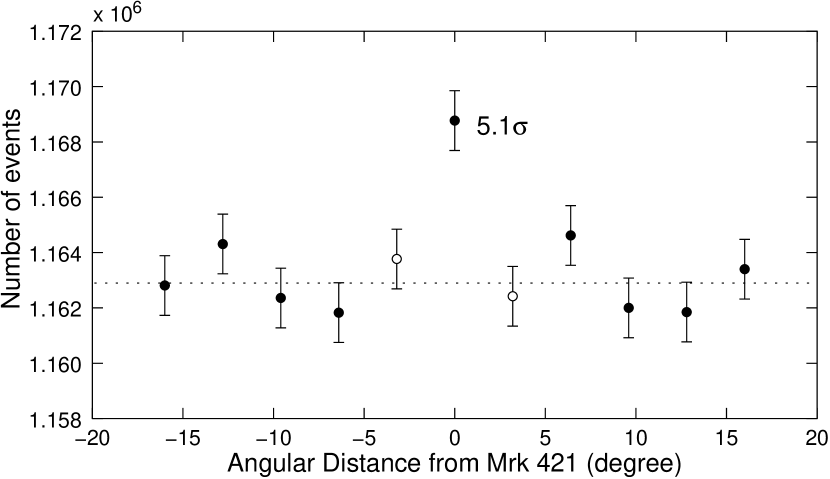
We calculated the statistical significance of TeV -ray signals from Mrk 421 using the following formula (Li & Ma, 1983): , where , , and are the number of events in the on-source cell, the number of background events summed over 8 off-source cells, and the ratio of on-source solid angle area to off-source solid angle areas ( = 1/8 in this work), respectively.
The number of events after the event reduction is plotted in Figure 6 as a function of angular distance from Mrk 421. A clear peak of -rays from Mrk 421 is seen at 5.1 statistical significance above the flat cosmic-ray background for the observation of 456.8 live days.
5.1 TeV -RAY/keV X-RAY CORRELATION
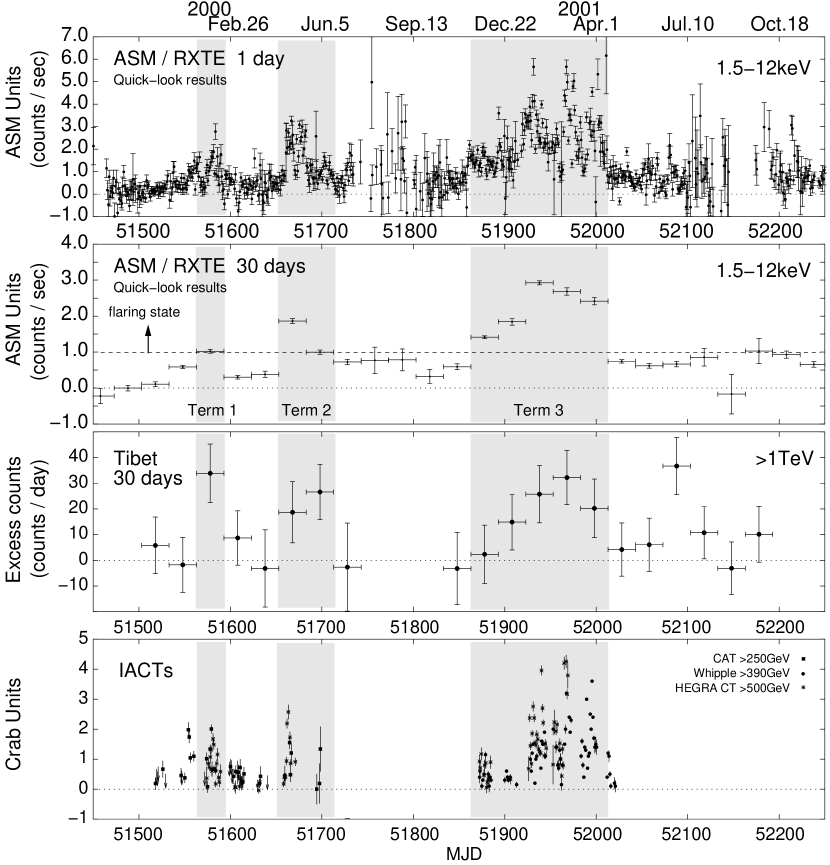
We plot our daily excess event rate from Mrk 421 averaged over every month in Figure 7, together with quick-look results from the all-sky monitor on the Rossi X-Ray Timing Explorer (ASM/RXTE) (Levine et al., 1996; ASM/RXTE team, 2003) and those from three IACTs: the Whipple Holder et al. (2001), HEGRA Kohnle et al. (2001), and CAT Piron et al. (2001). Since the Tibet III array was operated very stably during this period as discussed in 3, the observed variation cannot be attributed to any artificial noises or unstable data-acquisition system. Furthermore, one can see an excellent correlation among the 5 experiments as shown in Figure 7. The Tibet III array can observe TeV -rays continuously regardless of day/night, while the ASM/RXTE satellite orbits the Earth at a cycle of about 90 minutes, monitoring the X-rays continuously. Figure 8 shows the observation time overlap between the Tibet III array () and the ASM/RXTE satellite (). It tells us that ( ) / is 32.7%, while ( ) / is 2.5%. These constant overlapping fractions are sufficient to study the TeV -ray/keV X-ray correlation with both data sets.
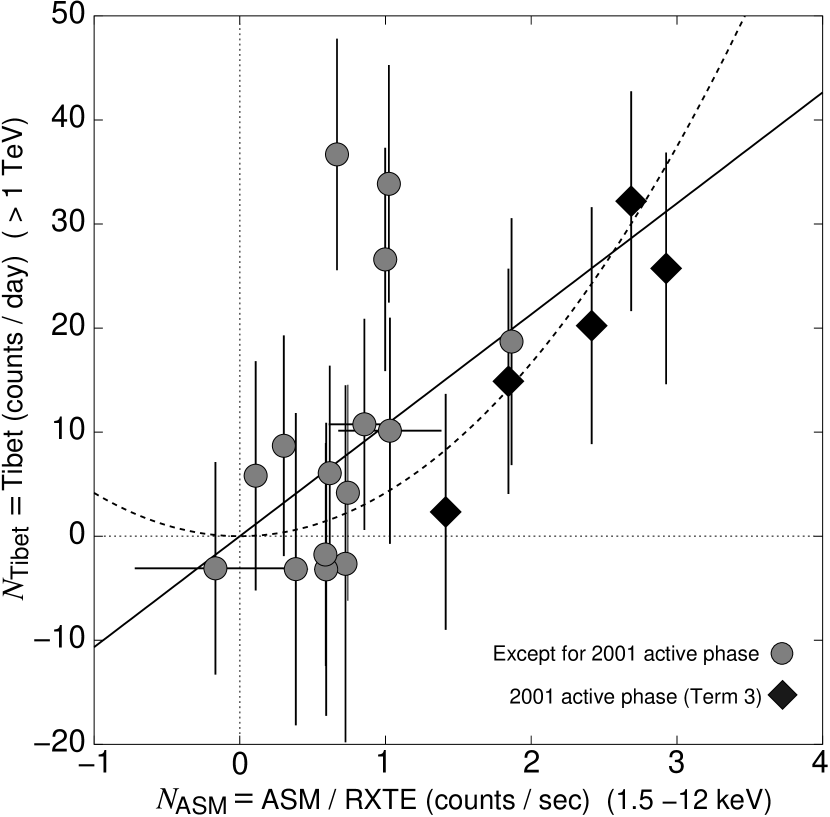
Figure 9 shows a correlation plot of excess counts between the ASM/RXTE data (2nd panel in Fig. 7) and the Tibet III data (3rd panel in Fig. 7) during the overlap period. A positive correlation is observed between the number of excess events in Tibet III () and those in ASM/RXTE (), which is given by = (10.661.83) with or = (4.160.81) with , where d.o.f. is degree of freedom. This positive flux correlation between the keV and the TeV regions will be consistent with the SSC model prediction. Furthermore, the correlation between Tibet III data and ASM/RXTE satellite data appears linear rather than quadratic, although the statistical significance is not sufficient, which may suggest some contribution of soft photons other than synchrotron photons to the TeV -rays as discussed below.
A comparison between the multi-wavelength spectra of Mrk 421 and Mrk 501 was made based on a 5-year observation from 1993 to 1998 via the ASCA and the RXTE satellites Kataoka et al. (2001). According to this paper, there is a conspicuous difference between Mrk 421 and Mrk 501 regarding the synchrotron component of the photon spectrum. In the case of Mrk 501, the position of the peak energy in the synchrotron component shifts manifestly from low energies to high energies as the source becomes brighter, but that of Mrk 421 remains almost constant. They consider that the time variation of the flux intensity may be caused by the increase of the number of high-energy electrons in the case of Mrk 421, while it is caused by the increase of the maximum acceleration energy of electrons in the case of Mrk 501. If only synchrotron photons contribute to the TeV -ray component via the SSC mechanism and the injected electron density changes as in the case in Mrk 421, the synchrotron flux will be proportional to the electron density (), and the IC TeV -ray flux will be proportional to both the electron density and synchrotron photon flux as . In this case, the correlation of is expected. On the other hand, if the seed photons of the IC scattering process are fed by external photons from the accretion disk Dermer, Schlickeiser, & Mastichiadis (1992) or from the central region of the AGN Sikora, Begelman, & Rees (1994), then the TeV -ray/keV X-ray correlation may come down to a linear correlation.
On the other hand, if we examine the correlation closely, some intense TeV -ray flares seem to have occurred without large X-ray flares as seen in the flare phases except for Term 3 (meshed circles in Fig. 9). These results may suggest that the physical parameters such as magnetic field strength, injected electron density and its spectral index, seed photon density, etc. Petry et al. (2000), in the shock region of the AGN jet differ flare by flare.
While no definite conclusion can be obtained regarding the correlation discussed above based on the present experiment, it is very important to continue the long-term simultaneous multi-wavelength observation of Mrk 421 flares and to accumulate sufficient experimental data in order to understand the mechanism of TeV -ray emissions from Mrk 421 and Mrk 501. It should be stressed that a true long-term simultaneous TeV -ray/keV X-ray observation is available by means of only the combination of an X-ray satellite experiment and a wide field-of-view air shower experiment.
5.2 ENERGY SPECTRUM OF FLARING TeV -RAYS
In order to determine the energy spectrum of flaring -rays from Mrk 421, we divided the Tibet III dataset into 3 terms according to the period that the ASM/RXTE satellite recorded more than 1.0 ASM units (counts/sec) averaged over 30 days, which is shown by three gray areas in Figure 7. We also calculated the detector response of the Tibet III array based on the full MC simulation. For this, -rays from Mrk 421 are simulated, assuming a differential power-law spectrum of , where varies from 2.6 to 6.0 and taking into account the diurnal motion of Mrk 421 in the sky. Air shower events are uniformly thrown within a circle with a radius of 300 m whose center is positioned on the center of the array. This radius is sufficient to collect all -ray events which are actually triggered in our array. Using the calculated effective area, the excess event rate, live time, and the relation between and the primary -ray energy, we can calculate the differential energy spectrum of -rays from Mrk 421. In the present work, the energy points indicate the log-scale mean of energies in each bin defined as follows: 10 10 (), and 100 100 (), where the lowest energy bin is dropped off in the analysis because the trigger efficiency is estimated to be very low (1%). Thus, the total number of energy bins available in the analysis is six.
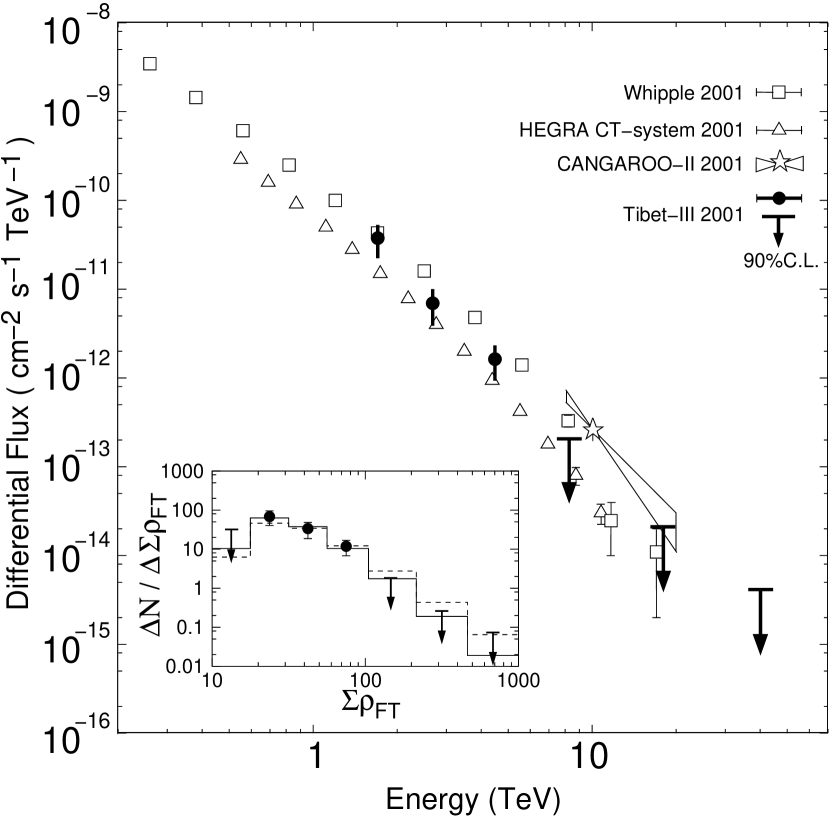
We obtained the differential energy spectra for the 3 terms and their power indices() are summarized in Table 1. Figure 10 shows the differential energy spectrum observed in the most active phase in 2001 (Term 3), with a spectral index of 3.240.69 at energy range between 1 TeV and 5 TeV, together with those obtained by the IACT experiments during 2001. Figure 10 (inset) shows the spectrum of observed -ray events from Mrk 421, together with those from the MC simulation assuming spectral indices of 3.24 (solid line) and of 2.8 (dashed line), respectively. Note that the absolute flux cannot be discussed in terms of Figure 10 because our observation period did not overlap perfectly those of IACTs, and that the absolute flux is estimated in all experiments at an error of approximately 20% which originates from the uncertainty of the absolute energy scale.
It is considered that the energy spectrum may become steep or break at high energies due to several reasons such as the interaction of -rays with the infrared photon field in the intergalactic space De Jager, Stecker, & Salamon (1994), the photon-photon pair attenuation near the source Dermer & Schlickeiser (1994), and the Klein-Nishina scattering cross section limit Hillas (1999). A cutoff energy () of the spectrum may be estimated by fitting a spectrum form of to the observed data. For example, the HEGRA group Aharonian et al. (2002) estimated a cutoff energy to be 3.6 TeV and 6.2 TeV for Mrk 421 and Mrk 501, respectively, and considered that this difference may be attributed to some intrinsic difference between -ray emission mechanisms. On the other hand, the Whipple group Krennrich et al. (2001) reported a cutoff energy to be 4.3 TeV and 4.6stat TeV for Mrk 421 and Mrk 501, respectively. They argue that the same cutoff energy obtained for both sources having almost the same redshift may be due to the absorption by the infrared photon field in the universe. Our observed spectrum for Mrk 421 is not inconsistent with those from the HEGRA, Whipple, and CANGAROO groups within statistical and systematic errors.
6 SUMMARY
Mrk 421 was in an active phase during the period between the year 2000 and 2001, showing strong and frequent flaring. During this flaring period, the Tibet III array successfully monitored the sky region with 2-steradian solid angle. This constant observation is beyond reach of IACTs which can observe the sky only on clear moonless nights. The stability of the array operation can be well checked by continuously observing the Moon’s shadow and the event rate of air shower events. Using this array, we detected multi-TeV flaring -rays from Mrk 421 at a significance level of 5.1 and found a positive flux correlation between the keV and TeV energy regions. The Tibet III and the ASM/RXTE data seem to favor a linear correlation rather than a quadratic one, although these data have not yet expressed sufficient statistical significance for this finding to be certain. Here, it should be stressed that the Tibet III array succeeded in the first observation of long-term correlation between satellite keV X-ray and TeV -ray data based on simultaneous observation. The observed energy spectrum with a power index of 3.240.69 is not inconsistent with those measured by IACTs within statistical and systematic errors.
The area of the Tibet III array was further enlarged up to 36,900 m2 by adding 200 counters in the late fall of 2002 and this new array has been successfully operating since then, triggering air shower events at a rate of 1,450 Hz with a dead time of about 10%. With the advent of the full-scale Tibet III array, long-term observation of TeV -rays from Mrk 421 or Mrk 501 together with other wavelength data may lead in the near future to a deeper understanding of the -ray emission mechanism. Moreover, the successful observation of -rays from the Crab Nebula, Mrk 421, and Mrk 501 by the Tibet air shower experiment demonstrates that we are now ready for detecting unknown stable/transient TeV -ray point sources through an all-sky survey.
References
- Aharonian et al. (2002) Aharonian, F., et al. 2002, A&A, 393, 89
- Amenomori et al. (1990) Amenomori, M., et al. 1990, Nucl. Instrum. Methods Phys. Res., A 288, 619
- Amenomori et al. (1992) ———. 1992, Phys. Rev. Lett., 69, 2468
- Amenomori et al. (1999) ———. 1999, ApJ, 525, L93
- Amenomori et al. (2000) ———. 2000, ApJ, 532, 302
- (6) ———. 2001a, Proc. 27th Int. Cosmic Ray Conf. (Hamburg), 2, 573
- (7) ———. 2001b, Proc. 27th Int. Cosmic Ray Conf. (Hamburg), 6, 2395
- Amenomori et al. (2002) ———. 2002, ApJ, 580, 887
- Asakimori et al. (1998) Asakimori, K., et al. 1998, ApJ, 502, 278
- ASM/RXTE team (2003) ASM/RXTE team 2003, http://xte.mit.edu/ASM_lc.html
- Biller et al. (1995) Biller, S. D., et al. 1995, ApJ, 445, 227
- Bloomer, Linsley, & Watson (1988) Bloomer, S. D., Linsley, J., & Watson, A. A. 1988, J. Phys. G, 14, 645
- Buckley et al. (1996) Buckley, J. H., et al. 1996, ApJ, 472, L9
- De Jager, Stecker, & Salamon (1994) De Jager, O. C., Stecker, F. W., & Salamon M. H. 1994, Nature, 369, 294
- Dermer, Schlickeiser, & Mastichiadis (1992) Dermer, C. D., Schlickeiser, R., & Mastichiadis, A. 1992, A&A, 256, L27
- Dermer & Schlickeiser (1994) Dermer, C. D., & Schlickeiser, R. 1994, ApJS, 90, 945
- Gaidos et al. (1996) Gaidos, J. A., et al. 1996, Nature, 383, 319
- Gould (1965) Gould, R. J. 1965, Phys. Rev. Lett., 15, 511
- Heck et al. (1998) Heck, D., et al. 1998, Report FZKA, 6019, Forschungszentrum Karlsruhe
- Helene (1983) Helene, O. 1983, Nucl. Instrum. Methods, 212, 319
- Hillas (1999) Hillas, A. M. 1999, Astropart. Phys., 11, 27
- Holder et al. (2001) Holder, J., et al. 2001, Proc. 27th Int. Cosmic Ray Conf. (Hamburg), 7, 2613
- Kamioka et al. (2001) Kamioka, E., et al. 2001, Adv. Space Res., 26, 1839
- Kasahara (2003) Kasahara, K. 2003, http://eweb.b6.kanagawa-u.ac.jp/~kasahara/ResearchHome/EPICSHome/
- Kataoka et al. (2001) Kataoka, J., et al. 2001, astro-ph/0105029.
- Kerrick et al. (1995) Kerrick, A. D., et al. 1995, ApJ, 438, L59
- Kohnle et al. (2001) Kohnle, A., et al. 2001, Proc. 27th Int. Cosmic Ray Conf. (Hamburg), 7, 2605
- Krawczynski et al. (2001) Krawczynski, H., et al. 2001, ApJ, 559, 187
- Krennrich et al. (2001) Krennrich, F., et al. 2001, ApJ, 560, L45
- Levine et al. (1996) Levine, A. M., et al. 1996, ApJ, 469, L33
- Li & Ma (1983) Li, T.-P., & Ma, Y.-Q. 1983, ApJ, 272, 317
- Lin et al. (1992) Lin, Y. C., et al. 1992, ApJ, 401, L61
- Macomb et al. (1995) Macomb, D. J., et al. 1995, ApJ, 449, L99
- Maraschi, Ghisellini, & Celotti (1992) Maraschi, L., Ghisellini, G., & Celotti, A. 1992, ApJ, 397, L5
- Marscher & Travis (1996) Marscher, A. P., & Travis, J. P. 1996, A&A, 120, 537
- Okumura et al. (2002) Okumura, K., et al. 2002, ApJ, 579, L9
- Petry et al. (2000) Petry, D., et al. 2000, ApJ, 536, 742
- Piron et al. (2001) Piron, F., et al. 2001, A&A, 374, 895
- Punch et al. (1992) Punch, M., et al. 1992, Nature, 358, 477
- Sanuki et al. (2000) Sanuki, T., et al. 2000, ApJ, 545, 1135
- Sikora, Begelman, & Rees (1994) Sikora, M., Begelman, M. C., & Rees, M. 1994, ApJ, 421, 153
- Takahashi et al. (1996) Takahashi, T., et al. 1996, ApJ, 470, L89
- Takahashi et al. (2000) ———. 2000, ApJ, 542, L105


| Term Nameaa MJD of Term 1, 2 and 3 ranges 51563-51593, 51653-51713 and 51863-52023, respectively. | Spectral Index | Energy range | ||
|---|---|---|---|---|
| (TeV) | ||||
| Term1+2+3 | -3.770.50 | 1 - 5 | 0.8 | 1 |
| Term1+2 | -4.520.80 | 1 - 5 | 0.5 | 1 |
| Term3 | -3.240.69 | 1 - 5 | 0.2 | 1 |