Mapping of Large Scale m [CII] Line Emission: Orion A
We present the first results of an observational programme undertaken to map the fine structure line emission of singly ionized carbon ([CII] m) over extended regions using a Fabry Perot spectrometer newly installed at the focal plane of a cm balloon-borne far-infrared telescope. This new combination of instruments has a velocity resolution of km/s and an angular resolution of . During the first flight, an area of ′′ in Orion A was mapped. These observations extend over a larger area than previous observations, the map is fully sampled and the spectral scanning method used enables reliable estimation of the continuum emission at frequencies adjacent to the [CII] line. The total [CII] line luminosity, calculated by considering up to 20% of the maximum line intensity is % of the luminosity of the far-infrared continuum. We have compared the [CII] intensity distribution with the velocity-integrated intensity distributions of 13CO(1-0), CI(1-0) and CO(3-2) from the literature. Comparison of the [CII], [CI] and the radio continuum intensity distributions indicates that the largescale [CII] emission originates mainly from the neutral gas, except at the position of M43, where no [CI] emission corresponding to the [CII] emission is seen. Substantial part of the [CII] emission from here originates from the ionized gas.
The observed line intensities and ratios have been analyzed using the PDR models by Kaufman et al. (1999) to derive the incident UV flux and volume density at a few selected positions. The models reproduce the observations reasonably well at most positions excepting the [CII] peak (which coincides with the position of Ori C). Possible reason for the failure could be the simplifying assumption of a homogeneous plane parallel slab in place of a more complicated geometry.
Key Words.:
infrared: ISM – ISM: lines and bands – ISM: individual (Orion A)1 Introduction
In recent years it has been established that molecular clouds show definite evidence of internal structures in the forms of clumps and filaments. The UV radiation, from external or embedded OB stars, incident on the molecular clumps dissociates molecules and ionizes atoms within a shell of A on the surface of the clumps and forms the Photon Dominated Regions (PDR). The externally heated PDR gas cools via characteristic FIR and sub-mm lines of various atomic and molecular species. The fine structure lines of [CII] m and [OI] m typically account for % of the cooling of the PDRs. One dimensional theoretical models for PDRs (Tielens & Hollenbach, 1985; Sternberg & Dalgarno, 1989) can explain the observed intensities of C+, C0 and O0 lines but fail to explain the extended nature of the [CII] emission. However a more realistic model suggests that the molecular clouds are clumpy in nature which allows the UV radiation to penetrate deeper and hence the observed emission consists of the contribution from many photodissociated clump surfaces along the line of sight (Köster et al., 1994). The observed [CII] as well as the CO line intensities scale with the density of the PDRs and the intensity of the UV radiation. Most of the high spatial resolution observational studies of [CII] line emission have concentrated on regions of high density and high UV radiation intensity. However large scale surveys with COBE (Wright et al., 1991), Balloon-borne Infra Red Telescope (BIRT) (Shibai et al., 1991) and Balloon-borne Infrared Carbon Explorer (BICE) (Nakagawa et al., 1998) have shown that the diffuse [CII] emission from the lower density regions contributes significantly to the cooling of the gas in our Galaxy and there is a significant drop in [CII] to continuum ratio towards regions of active star formation. Thus large scale high angular resolution studies of extended [CII] and CO emission from both the active star forming regions and PDRs with low densities and low UV radiation intensity are needed to understand the dominant cooling mechanisms under different physical conditions within the molecular clouds. However the [CII] fine structure line is observable only from above the earth’s atmosphere using aircraft and balloons, thus restricting the scope of the observational studies. Here we present the first results of a balloon-borne programme for observation of the [CII] emission from Galactic star forming regions.
Situated at a distance of 450 pc, the Orion molecular cloud is the nearest region of active star formation. It also shows clear evidence of ubiquity of PDRs (Genzel & Stutzki, 1989). Owing to its proximity and brightness, numerous observational studies have been directed towards Orion and these have resulted in improving our understanding of the interplay between stars and the interstellar matter (ISM). In addition, Orion is also a good benchmark source to test any new observing system. The Orion molecular cloud also has the advantage of being like a ridge extended along the north-south direction with much smaller extent along the east-west. This is particularly useful for chopped observational studies, so that the emission lost due to self-chopping is negligible.
Previous [CII] observations of Orion were carried out from the Kuiper Airborne Observatory. These include the mapping of a ′ region in OMC 1 by Stacey et al. (1993), the mapping of ′′ region in the Orion Molecular Ridge (OMC 1 and 2) by Herrmann et al. (1997) and heterodyne spectroscopy of M42 by Boreiko et al. (1988); Boreiko & Betz (1996).
Here we present a large scale study of [CII] m fine-structure line emission towards Orion A. The map is fully sampled and covers an area of ′′. The rest of the paper is organized as follows: A brief description of the instrument, observational procedure and parameters are presented in Sect. 2. Sect. 3 presents the data analysis methods, Sect. 4 presents the results of observation, Sect. 5 presents comparison with other observations and Sect. 6 presents a discussion of the intensity profiles and interpretation of the line intensity ratios using a PDR model.
2 Instrument & Observation
2.1 FPS100
A Fabry Perot Spectrometer (FPS) tuned to the [CII] m line was installed at the focal plane of the cm TIFR balloon-borne FIR telescope (Ghosh et al., 1988). We refer to this new combination of instruments as FPS100. The FIR telescope has an f/8 Cassegrain configuration in which the secondary mirror can be wobbled with an amplitude of and a frequency of Hz. The FPS was designed at ISAS, Japan and in an earlier configuration was used at the focal plane of the BICE (Nakagawa et al., 1998). Interfacing of the FPS to the TIFR telescope necessitated modification of the optical components in order to achieve f-number compatibility between the two. New electronics was also designed and built to implement the observing modes (discussed in Sect. 2.2). We point out that the FPS on the BICE had an angular resolution of ′, while on the TIFR telescope the achieved angular resolution is . The FPS, in brief is a tandem Fabry Perot Spectrometer, consisting of two Fabry Perot interferometers: one a high order interferometer with movable plates to scan the wavelength (Scanning Fabry Perot; SFP) and the other a low-order interferometer with fixed plates (Fixed Fabry Perot; FFP) which acts as an order sorter for the SFP. The two interferometers together with other optics of the spectrometer and the FIR detector, are cooled to K with liquid helium. The FIR detector used is a stressed Ge:Ga photoconductor (Hiromoto et al., 1989) with an NEP of Watt/.
2.2 Observation Modes
The FPS100 has been designed for two observation modes, viz., chopped and unchopped. Both modes involve frequency modulation of the signal achieved by sweeping the SFP up and down at a preselected scan frequency and over a preselected velocity range around the expected position of the [CII] line. The spectral scanning, in addition to being important for background reduction is also useful for estimating the neighboring continuum reliably. The primary difference between the two modes of observation lies in the fact that, in the chopped mode the sky chopping (effected by wobbling the secondary mirror) is functional, while in the unchopped mode there is no sky chopping. In the chopped mode the frequency of chopping is Hz. For both modes it is possible to carry out spatial raster scans covering a rectangular box around the target source.
Thus, the chopped mode involves sky chopping, spatial and spectral scanning. For meaningful measurements the frequencies of spatial scan (), sky chopping () and spectral scan () in this mode should maintain the following relation: . The signal detected in this mode is the difference between the emission in the two beams and is processed through linear phase band pass filters and further amplified (with selectable gains). There after the signal is phase sensitively detected (with online phase adjustment capability) and digitized for the telemetry. One of the outputs of the PreAmplifier for the SPectrometer (PASP) is used as the output signal for the mode. The signal is sampled at a frequency of Hz.
In the mode, since there is no onboard background subtraction, the integration time over each spectral element is kept small, i.e., in effect a series of narrow band observations are done. Thus for this mode the spectral scan frequency is at least times higher than that for the mode. For this mode the relation between the different frequencies involved is . Since there is no modulation of the signal due to sky chopping (), the corresponding output from the PASP is directly digitized using a bit ADC. The frequency of spectral modulation being higher in this mode, the signal is sampled at a frequency of Hz.
2.3 Observation Details
The FPS100 payload was flown for the first time from the TIFR Balloon Facility, Hyderabad, in Central India (Latitude = N, Longitude = E) on 1999 November 25. The observations presented here were carried out in the chopped mode. The choice of the chopped mode over the unchopped mode was based on considerations related to the noise level during the flights. For the chopped mode the noise level was found to be consistent with the pre-flight tests in which the flight condition was simulated by closing the window of the FPS and keeping the rest of the configuration identical to that during the flight.
Jupiter was observed for absolute flux calibration as well as for determining the point spread function (PSF). The angular resolution achieved during these observations was . A rectangular region of ′′ towards Orion A was observed in approximately minutes. The spatial scan rate was /s and the spectral scan frequency was Hz.
3 Data Analysis
The entire dataset for Orion A was split into two parts depending on whether the SFP is scanned from lower to higher frequency (Up) or in the reverse sense (Down). The data analysis procedure described in the following text was applied independently to these two datasets.
The signal measured is a combination of the emission from the astronomical source and the residual (post sky chopping) foreground radiation contributed by the atmosphere and the instrument. In the present work we have estimated the foreground emission by considering the signal at the edges of the spatial scan lines where there is no apparent contribution from the astronomical source. As expected the residual emission in the chopped mode was found to be negligible.
Each spectral scan was corrected for foreground radiation. Since the instrumental profile is much wider than the intrinsic astronomical line profile, the observed spectral profiles are dominated by the instrumental profile. Since the Lorentzian profile is a good approximation for the instrumental profile, we have fitted each spectral profile by a combination of the Lorentzian profile and a linear function of the wavenumber , representing the contribution of the continuum emission at these wavelengths. The fitted function has the following form:
| (1) |
The fitting procedure involves parameters viz., C1, C2, C3, and . and are respectively the central position and FWHM of the line. The observed line profile is slightly modified from the instrumental profile because the astronomical line emission slightly broadens its width and shifts its central position as well. Thus for regions with strong [CII] line emission, all the parameters are kept free and and are determined accurately. Since the [CII] linewidth in the region near Ori C is km/s (Boreiko et al., 1988). Hence the line being not resolved by the FPS100 we have kept and fixed for all spectral profiles and determined the values of the remaining parameters from the fit. Fig. 1 presents the observed data (shown as points) corresponding to a spectral profile and the function (shown as a continuous line with = cm-1 and = cm-1) fitted to it. This value of corresponds to a velocity resolution of km/s.

This profile fitting results in two datasets corresponding to the intensities of the [CII] line and the continuum. Using the telescope aspect information the intensity (line or continuum) is gridded into a two dimensional matrix with pixels of size . The sky matrix thus derived is a convolution of the intensity distribution of the source and the bipolar (due to sky chopping) PSF. Using the PSF determined from Jupiter observations the data was deconvolved using a Maximum Entropy Method (MEM) based deconvolution scheme (Ghosh et al., 1988) to obtain the intensity distributions of the [CII] line and the continuum. The deconvolved maps of the [CII] line (and continuum) intensity distributions obtained from the two independent datasets (Up and Down) match well. This confirms the reliability of most of the observed features. The final [CII] line and continuum maps are obtained by averaging the respective Up and Down datasets.
4 Observational Results
4.1 The [CII] map
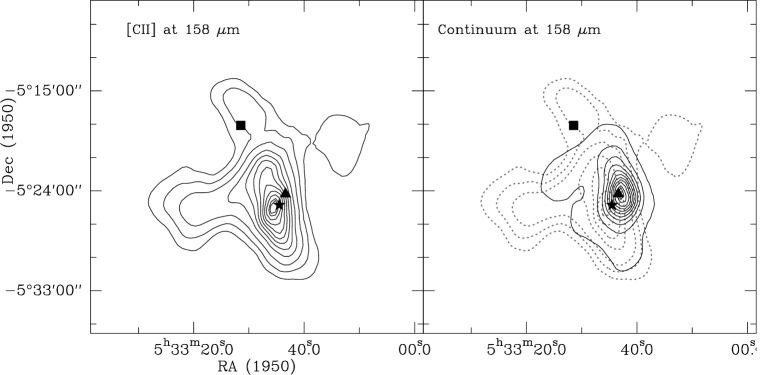
Fig. 2 shows the fully sampled maps of velocity-integrated [CII] intensity and the continuum emission at m. The [CII] emission peaks at the position of Ori C. Features detected in the [CII] emission are similar to those observed by Stacey et al. (1993) and Herrmann et al. (1997). Both of these previous observations done with an effective beamsize of ″ were confined (particularly along the right ascension) to the immediate vicinity of the central part of Orion A, while Herrmann et al. (1997) extended the map northward along the ridge. The present observations, though with slightly lower angular resolution cover a larger extent and detect a strong emission far towards the east as well as from M43 in the north. The [CII] map also exhibits an additional emission peak to the west of the main structure in the Orion A region. The extended nature of the [CII] emission supports the present understanding that the [CII] emission not only arises from the direct interface between the ionized region (produced by the Ori C) and the molecular cloud, but also from neutral atomic interfaces deeper into the molecular cloud produced by the diffuse UV radiation field. There is no enhancement of [CII] emission close to the outflow associated with BN/KL; this is consistent with the theoretical models (Hollenbach & McKee, 1989) which predict that not much [CII] is produced in shocks. The [CII] emission falls off sharply towards the west, but appears to be more extended in the east. This conforms well with the currently understood structure of the region (Wilson et al., 1997). This model assumes that the dense gas near the ionizing star shields the more distant gas to the east from the flux of the ionizing photons and to the west there being less dense neutral matter, the ionized gas flows in and dominates. The separated emission peak towards the west has also been detected in [CI](1-0) and CO(3-2) emissions, as will be discussed in detail later. [CII] emission detected from the HII region M43, possibly arises from the associated HII region which is energized by the star NU Ori.
4.2 Comparison of [CII] & Continuum emission at m
Comparison of the [CII] emission with the continuum emission at m (right panel of Fig. 2) reveals that although there is an overall correlation between the two, there are distinct differences as well. The salient difference in features between the continuum and the [CII] emission are: (1) the positions of the peaks of the two emissions are different and (2) the [CII] emission is more extended than the continuum emission.
In contrast to the [CII] emission which peaks at the position of Ori C, the continuum emission peaks at the position of the BN/KL object. This possibly indicates that while the BN/KL object corresponds to the strongest embedded energizing source, giving rise to the dust emission peak, it is still not evolved enough to photodissociate gas which can emit [CII] strongly. An alternative or additional explanation for the difference in the peak positions could be the higher dust density close to the BN/KL object.
The [CII] emission is more extended compared to the continuum emission, indicating the extended presence of neutral photodissociated gas and leaking of the UV photons from Ori C. The continuum emission in contrast falls off sharply with increasing distance from the embedded young stellar objects responsible for heating the dust in this region.
However we point out that for the lower contour levels, the sensitivity of the continuum emission presented here is limited. This also accounts for the lack of the northward and eastward extension of the continuum emission as compared to the [CII] emission. This becomes apparent if we compare the features of the continuum map with those in the m map by Mookerjea et al. (2000). While the central features match exceedingly well, the extended nature of the continuum emission is clearly missed by the present observations.
4.3 Gas Heating Efficiency
The total [CII] luminosity detected in the central region enclosed within contours up to 20% of the peak line emission is . The total FIR continuum luminosity was calculated from the flux detected at m up to 6% of the peak, using the formula proposed by Thronson & Telesco (1986). The calculation assumes a dust temperature of K (Mookerjea et al., 2000) and a dust emissivity of and the calculated FIR continuum luminosity is . The choice of the lowest contour levels in the [CII] and continuum maps, up to which we integrate ensures integration over similar regions. Thus the [CII] luminosity detected is of the total FIR continuum luminosity.
Large scale survey of the Galactic [CII] emission (Nakagawa et al., 1998) using the BICE shows that the [CII]/FIR ratio is low towards the major star forming regions and the ratio is 0.2% for compact sources. The ratio presented in Nakagawa et al. (1998) uses the total continuum emission derived between 40 and 120 m. If the same ratio is calculated over 1 to 500 m, for a dust temperature of 50K and an emissivity index of 2.0 the ratio would be 0.1%. The BICE survey was conducted with an effective beamsize of 15′, which is much larger than the resolution of our observations (15). The resulting difference in the beam filling factors of the two observations can possibly account for this discrepancy in the estimated ratio of the [CII] and the FIR luminosities.
The reduction in the [CII] to continuum ratio towards regions of high mass star formation is explained by model calculations. PDR models (Hollenbach et al., 1991) show that in high density regions with large G0, the [CII] line is rather saturated due to its lower excitation energy and lower critical density, while lines such as the [O I] m line become dominant coolants. In addition, dust grains being positively charged in regions with high G0, the efficiency of photoelectric heating of gas decreases.
5 Morphological comparison with other observations:
We present a comparison of the observed [CII] and dust continuum emission with the 13CO(1-0), [CI](1-0), CO(3-2) and the radio continuum emission at GHz. The comparison with 13CO(1-0) is aimed at understanding the overall column density structure of this region, vis-a-vis the presence of heating sources. The comparison with [CI] and CO(3-2) emissions is aimed towards understanding the volume density structure and the distribution of the UV field, in an attempt to derive a coherent picture of PDRs giving rise to all of these emissions. The comparison of [CII] emission with the radio continuum emission is intended to identify ionized gas contributing substantially to the [CII] emission.
5.1 Comparison with 13CO(1-0): Column density tracer
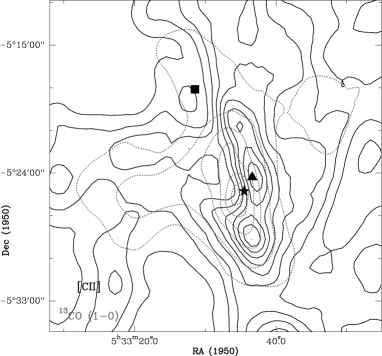
Observations suggest that 12CO is optically thick (Castets et al., 1990) in Orion A. On the other hand, 13CO is optically thin in most cases and is a better tracer of the column density of the neutral molecular gas. We compare our [CII] data with that of 13CO(1-0) observed with a beam of ″, at the FCRAO by Plume et al. (2000). Fig. 3 also shows an overlay of the [CII] emission with the 13CO (1-0) emission. The 13CO (1-0) data has been integrated over velocities ranging between and km/s, smoothed to the resolution of the [CII] map () and regridded on a grid.
The velocity integrated 13CO (1-0) intensity map shows two prominent peaks, one coinciding with the infrared object BN/KL and the other lying to the south of it. The continuum emission also peaks at the location of the BN/KL object, thus implying a core of high column density (and possibly high volume density as well) with an embedded heating object at a reasonably early stage of evolution. The southward extension of the dust continuum emission is resolved into a clump in the 13CO(1-0) map. However, neither the 13CO(1-0) nor the dust continuum map show the separated emission peak to the west, which is seen in the [CII] map. The [CII] emission in contrast shows a single peak at the position of the ionizing star Ori C. Since both [CII] and 13CO (1-0) emission are to a good extent optically thin, the dissimilarity in the overall emission features hint at the difference in the phases of the ISM which dominantly contribute to these emissions. The 13CO(1-0) emission originates from cold molecular material and hence is more widespread. We note that there is a distinct similarity in the eastward extension of the 13CO(1-0) emission with that of the [CII] emission. The 13CO(1-0) map shows an isolated peak at the position of M43 to the north, which is a little offset from the [CII] intensity enhancement in this direction.
5.2 Comparison with CI(1-0), CO(3-2): PDR view
The present understanding of the PDRs in molecular clouds suggests that the [CII] emission from the PDRs arises from the surface of UV irradiated clumpy molecular clouds. The penetration of UV into the molecular material creates a stratification in which several carbon bearing species appear and disappear sequentially with increasing visual extinction into the cloud. Other species which are present in the PDRs and contribute to the cooling of these regions include, the neutral atomic carbon and the CO (mid-J rotational transitions) from close to the edge of the UV irradiated surface and the low-J rotational transitions of CO and its isotopomers which trace the large scale gas distribution of the molecular cloud.
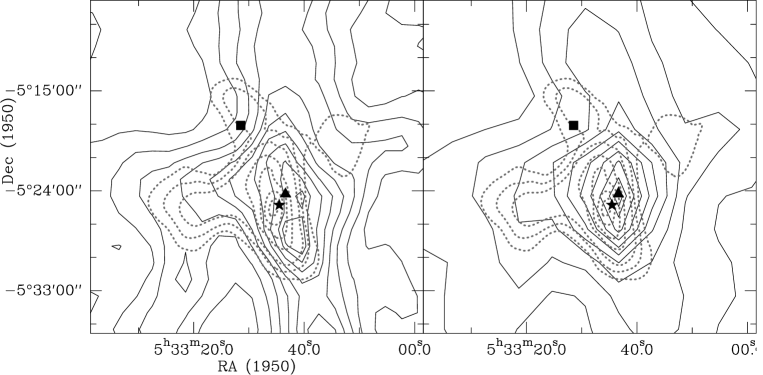
Fig. 4 shows the measured [CI] 3P1-3P0 () and CO (3-2) () emission from the same region of Orion A, as we have mapped in [CII]. The [CI] and CO(3-2) data have been taken from the paper by Ikeda et al. (1999). The [CI] and the CO (3-2) data were observed with angular resolutions of 22 and 3′ respectively. Both datasets were presented in the paper with an angular resolution of 3′ and on a grid spacing. For proper morphological comparison, we have smoothed the [CII] data to a resolution of ′.
[CI] arises only from the neutral phase of the ISM, while CO (3-2) traces the warm and/or dense gas. In other words the CO(3-2) emission stems from the possible clumpy structures in the ISM which also harbour the [CII] and [CI] emitting regions closer to their surfaces. The [CI] emission originating from the neutral gas is more widespread than the [CII] emission and peaks at two positions, none coinciding either with the BN/KL object or Ori C. The southern peak matches with the second peak of the 13CO(1-0) map. We point out that the peaks of the emissions of the three lines follow the sequence [CII]/CO/[CI], which is different from the PDR scenario in which the dominant carbon bearing species changes from C+ to C0 to CO. The eastward extension and the separated emission peak to the west seen in the [CII] map are clearly seen in the [C I] map also. We note that [CI] emission shows no enhancement at the position of M43 contrary to the expectation that presence of [CII] emission indicates the presence of PDR and hence [CI] emission. This indicates that the [CII] emission in M43 originates from the associated HII region, rather than from the neutral PDR.
At this angular resolution the CO(3-2) map shows much less features as compared to the [CI] map. The emission peaks at a single position centered on the BN/KL object, much like the continuum emission. The peak position is identical to the northern peak of the 13CO(1-0) emission. The extension towards the east and the separated emission peak to the west as seen in the [CII] map are also clearly distinguishable in the CO(3-2) map. Presence of these features in the CO(3-2) map suggests enhancement of temperature and hence presence of embedded sources. This is also substantiated by the observed [CII] emission.
5.3 Comparison with GHz radio continuum
The first ionization potential of carbon is eV (less than that of hydrogen). Hence, the [CII] emission stems not only from the neutral PDRs but also from the ionized gas in the HII regions. Model calculations of dust free HII regions imply that stars hotter than spectral type O7 produce sufficiently high flux of photons with energies greater than 24.587 eV to maintain all of the helium in the form of He+, and therefore all of the carbon in the form of C++ (the ionization energy required to produce C++ lies only 0.204 eV below that required to ionize He). However, presence of dust within the HII region causes the stellar Ly continuum radiation field to become depleted of He-ionizing photons. As a result some C+ may be found in dusty HII regions ionized by stars hotter than O7. Alternatively, the HII regions whose ionizing stars are O8 or cooler are incapable of maintaining a significant fraction of carbon in the C++ state and hence may have a significant population of C+.
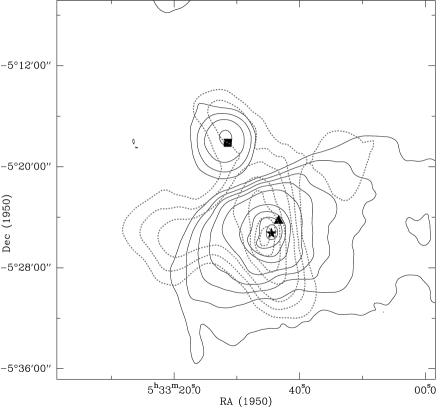
Fig. 5 shows an overlay of the GHz radio continuum emission measured using VLA, with an angular resolution of ′ by Subrahmanyan et al. (2001), with the [CII] map. The basic features of the radio continuum emission are very different from the [CII] emission, implying origin in different components (ionized and/or neutral) of the ISM. The [CII] emission is extended along the north-south direction, while the radio continuum emission is extended in the east-west direction. The [CII] halo is more extended toward the east, while the radio continuum is extended mostly toward the west. This agrees well with the recent models for the Orion A region (Wilson et al., 1997). The radio continuum emission peaks at the positions of the two HII regions associated with M42 and M43. The [CII] map peaks at the position of M42 and shows enhanced emission close to M43, with no corresponding enhancement in [CI] emission.
We note, M42 is ionized by a O6-O7 star, so that the calculated [CII] intensity originating in the ionized gas is only 5% (Russell et al., 1980). However M43 is ionized by a B0.5 V star, so the enhancement of [CII] emission with no corresponding [CI] emission peak can be attributed to the ionized gas in the HII region.
6 Discussion
6.1 Line Intensity Profile & Ratios
In order to probe the density and the UV field strength distribution with increasing distance from Ori C, we derive profiles of the [CII], [CI], CO(3-2) line intensities for a east-west cut at the declination of the Ori C and calculate the intensity ratios at a few selected points. All three datasets have/are smoothed to an angular resolution of ′ and are gridded on a grid.
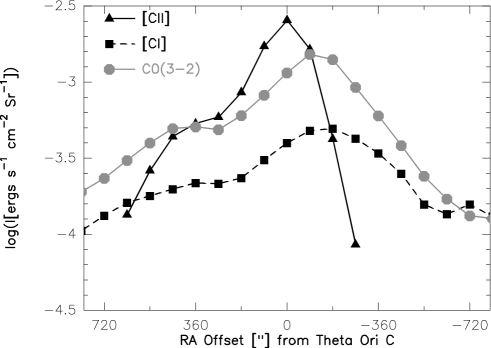
Fig. 6 shows the intensity profiles referred to above, of [CII], [CI] and CO(3-2) along the east-west direction at the declination of Ori C. The [CII] emission falls off rapidly (steeper towards the west) away from Ori C, but continues showing residual emission well beyond. The [CI] emission arising from cold neutral medium is more widespread. The CO(3-2) emission tracing warmer gas is moderately distributed, and it’s profile shows a hump towards the east which is similar to that seen in the [CII] intensity profile.
Table 1 presents the absolute [CII] intensities, the C+ column densities and ratios observed at several selected positions (offsets relative to Ori C) along the E-W cut shown in Fig. 6 as well as the position of the BN/KL object (-90″,90″). In order to obtain a first order estimate the C+ column densities have been calculated assuming the line to be optically thin, the densities to be high enough so that the emission is thermalized to a temperature of K (Stacey et al., 1993) and the beam filling factor to be unity. The C+ column densities are thus lower limits. In Table 1 the UV flux and density correspond to the results of the PDR model analysis of these intensities. We discuss the PDR modeling in details in the next subsection.
| Position1 | I[CII] | N | Density | UV flux | Remarks | ||||
|---|---|---|---|---|---|---|---|---|---|
| ergs s-1 cm-2 sr-1 | cm-2 | log(cm-3) | log(G0) | ||||||
| (-90″,90″) | 1.30(-3) | 7.3 (17) | 267 | 0.29 | 5.0 | 4.25 | 1.0 | CO(3-2) peak | |
| (0″,0″) | 2.55(-3) | 1.4 (18) | 631 | 220 | 0.35 | 5.25 | 5.5 | … | [CII] peak |
| (180″,0″) | 8.57(-4) | 4.8 (17) | 361 | 141 | 0.39 | 5.0 | 4.75 | 0.7 | |
| (-180″,0″) | 4.21(-4) | 2.4 (17) | 0.35 | 4.75 | 2.5 | 1.6 | |||
| (360″,0″) | 5.30(-4) | 3.0 (17) | 239 | 104 | 0.43 | 4.75 | 3.75 | 0.6 |
1 Offsets relative to the position of Ori C ( = , = -°′″)
Since the PDR model gives no solution, the UV flux has been calculated using the luminosity of Trapezium cluster (L) and the distance between the Trapezium cluster and the molecular cloud (d = 0.25pc O’Dell (2001))
6.2 Density and UV Flux from PDR Model
We have used the PDR model of Kaufman et al. (1999) to interpret the observed intensity ratios of [CII], [CI] and CO(3-2) lines and to estimate the volume density and the UV field strength at selected positions. Table 1 presents the observed line ratios and results of modeling including the values of the reduced at each of these positions. The models by Kaufman et al. (1999) are similar in terms of chemistry, radiative transfer, thermal balance etc. to those presented by Tielens & Hollenbach (1985), Hollenbach et al. (1991) and Wolfire et al. (1990). But they use updated reaction rates, heating rates as well as chemical abundances and most importantly they take into account the heating due to PAHs which is important for the interpretation of the FIR cooling lines like [CII] and [OI]. Kaufman et al. (1999) have created a database of PDR models, for a density range from n to cm-3 and for a far-ultraviolet (FUV) radiation field ranging between G to (where G0 is in units of an average interstellar flux of ergs s-1 cm-2).
In order to determine the densities and UV fluxes which can explain intensity ratios, we have done a fitting of the observed ratios with respect to the model predictions. Fig. 7 shows in grey scales the reduced for the observed line ratios at the selected positions. The grey scale is proportional to the and weighted with the individual observational uncertainties. Based on the estimated calibration errors of the individual observations, we take an uncertainty of % for the ratios involving [CII], while for the [CI]/CO(3-2) ratio the uncertainty is taken to be %. The lines correspond to the observed intensity ratios and the absolute [CII] intensity (as described in the legends). The values for the volume density and UV flux at each position were determined from the location of the minimum . We discuss the result of modeling for each position separately.
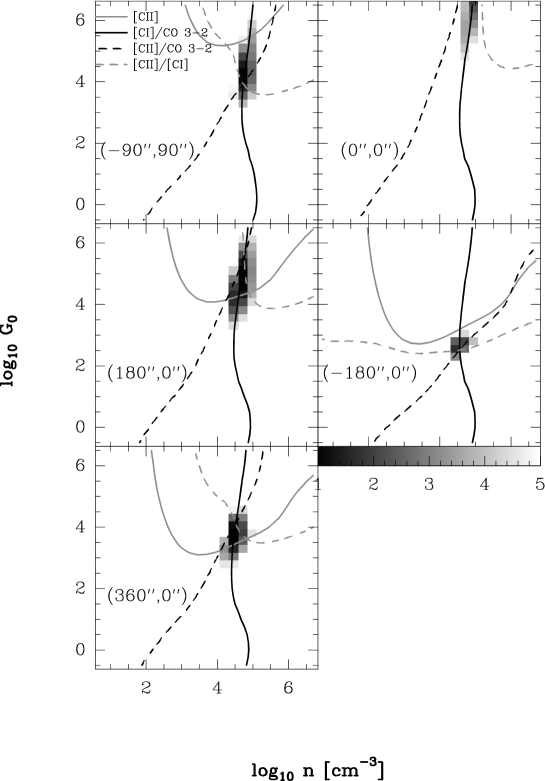
6.2.1 Positions away from the [CII] peak
(-90″,90″): This position corresponds to the peak of the CO (3-2) map and is approximately the location of the BN/KL object. The best fit model corresponds to an UV field of G and a volume density of cm-3. The density compares well with those derived from the multi-line study of Orion A by Wilson et al. (2001). We point out that the fitted model is not accurate; though it explains the line intensity ratios, the derived physical conditions predict an absolute [CII] intensity lower than the observed value.
East of Ori C: We are able to explain all the intensity ratios as well as the [CII] intensity at the eastern positions (″,″) and (″,″) using the PDR models.
West of Ori C: We restrict the analysis of the western side to a single point (-″,″) owing to the limited dynamic range of the [CII] map. The model fitted is acceptable, although we note that the predicted [CII] intensity is lower than the observed intensity.
6.2.2 The [CII] peak
(0″,0″): This corresponds to the position of the star Ori C. For the parameter space explored the models do not have any solution. We identify the failure as due to the excess of observed [CII] emission over the model predictions. We note that if models corresponding to higher UV field were considered, a solution could be derived, but it would not have been realistic. This is because for the given luminosity () of the ionizing stars, the Trapezium cluster, and their distance of 0.25 pc from the molecular cloud (O’Dell, 2001) the strength of the UV field at this position would at most be G0.
Since the ionizing star is of the type O6 the contribution of the ionized gas towards the [CII] emission will be negligible, unless the high dust density plays a crucial role. However this scenario for the present is highly speculative, so we do not persist with it. Instead we keep in mind that the geometry and structure of Orion A is far too complicated and not fully understood to be satisfactorily modeled by the presently available PDR models. We consider the effect of inappropriate model geometry as a probable reason behind the failure of the PDR models to generate a satisfactory solution.
We first estimate the C+ column density which is needed to explain the detected [CII] intensity, assuming that the line is optically thin. For regions outside HII regions the almost temperature independent, critical density (ncrit) for collisional excitation is cm-3. Since the measured volume densities for these regions are well in excess of these values (typically cm-3), the [CII] emission is in thermal equilibrium. Stacey et al. (1993) suggest that the minimum gas kinetic temperature of the region is K. With these assumptions and values we estimate the C+ column density to be cm-2. Assuming an abundance ratio of [C+]/[H] , this corresponds to a hydrogen column density of cm-2, which is equivalent to an Av of mag. The model of Kaufman et al. (1999) treats the PDRs for Av upto mag, but being a homogeneous slab model considers the [CII] emitting region to be confined to the surface. If instead of a single such surface, a number of such surfaces (optically thin for [CII] emission) are placed, then it is possible to enhance the C+ intensity relative to the other line intensities. The need to invoke a number of such surfaces, suggests the presence of non-homogeneity or clumpiness in the ISM. The scenario changes appreciably if a spherical clump model of PDRs is used, in which case the width of the [CII] emitting layer changes depending on the size of the clump (Köster et al., 1994). A model treating an ensemble of spheres is more realistic, since observations support that the ISM consists of clumps immersed in a tenuous inter-clump medium, rather than being a homogeneous slab. Mochizuki et al. (1994) have explicitly discussed that in the clumped scenario, the [CII] emission is enhanced significantly compared to the homogeneous case, if the average size of the clumps are such that A mag.
6.3 Summary of PDR modeling
The PDR models are able to explain the observed line intensity ratios, satisfactorily for positions away from the energizing sources like the Ori C and the BN/KL object. At the position of the [CII] peak in particular it fails to provide a solution, mainly because of the excess in [CII] emission over the model prediction. This is probably because the actual geometry is far more complex than the model assumptions. However, in the absence of velocity-resolved [CII] observations it is difficult to throw more light on the actual structure of the [CII] emitting region. We note that although the contribution of the ionized gas towards the [CII] emission at the peak position in M42 is expected to be negligible it may not be totally absent and must be taken into account while attempting better constrained modeling at other positions.
According to the PDR model, the [CI]/CO(3-2) intensity ratio constrains the volume density, while the [CII]/[CI] is very sensitive to the strength of the UV flux. For all the selected positions, the [CI]/CO(3-2) intensity ratio varies very little and the derived volume densities are almost the same. The larger variation of [CII]/[CI] intensity ratios corresponds to a larger spatial variation of the UV field strength.
7 Summary
We have presented the first results of observations with a Fabry Perot spectrometer tuned to [CII] m onboard a balloon-borne FIR telescope, FPS100. These observations demonstrate the capabilities of the instrument we had planned for. The line integrated intensity map of [CII] emission from the Orion A region as well as the continuum emission at m have been obtained here. The [CII] luminosity is % of the FIR continuum luminosity. Morphological comparison of the [CII] map with with [CI] at GHz, CO (3-2) and 13CO (1-0) data show (i) that the peaks of the emission occur in the sequence of [CII]/CO/[CI] which is contrary to the PDR scenario and (ii) the [CII] emission from M43 in the absence of corresponding [CI] emission stems from the HII region and not from the PDR.
The [CII], [CI] and CO (3-2) line intensity ratios have been modeled using the PDR models of Kaufman et al. (1999). The models though somewhat simplistic, considering homogeneous plane parallel slabs instead of the clumpy structure seen observationally, are a first step towards understanding the observations. The models do not reproduce the observed [CII] intensity as well as the intensity ratios involving [CII] for positions which are close to the ionizing source (viz., Ori C and possibly BN/KL). This possibly is an effect of the assumption of plane parallel geometry instead of the more complicated structure of the region. The models produce acceptable solutions for regions with diffuse UV radiation. Similar to the [CII] intensity profile both the incident UV flux and the volume density show sharper decline towards the west of Ori C, than towards the east. For all the selected positions the volume density derived using the PDR models varies little, while the UV field strength varies substantially.
Acknowledgements.
We thank the referee, T. L. Wilson for his comments which have improved the scientific contents of this paper. It is a pleasure to thank all members of the Infrared Astronomy Group of TIFR and the Balloon Group and Control Instrumentation Group of the TIFR Balloon Facility, Hyderabad, for their support during the balloon flight. We thank M. Ikeda for providing the [CI] and CO (3-2) datasets, F. Bensch for providing the 13CO (1-0) dataset and R. Subrahmanyan for VLA GHz continuum image. We also thank M. Wolfire for generating the ratio plots for the PDR models specially for this work. BM acknowledges the research fellowship of the Alexander von Humboldt Foundation, Germany. This research has made use of the SIMBAD database, operated at CDS, Strasbourg, France.References
- Boreiko & Betz (1996) Boreiko, R. T. & Betz, A. L. 1996, ApJ, 467, L113
- Boreiko et al. (1988) Boreiko, R. T., Betz, A. L., & Zmuidzinas, J. 1988, ApJ, 325, L47
- Castets et al. (1990) Castets, A., Duvert, G., Dutrey, A. et al.1990, A&A, 234, 469
- Crawford et al. (1985) Crawford, M. K., Genzel, R., Townes, C. H., & Watson, D. M. 1985, ApJ, 291, 755
- Genzel & Stutzki (1989) Genzel, R. & Stutzki, J. 1989, ARA&A, 27, 41
- Ghosh et al. (1988) Ghosh, S. K., Iyengar, K. V. K., Rengarajan, T. N. et al. 1988, ApJ, 330, 928
- Herrmann et al. (1997) Herrmann, F., Madden, S. C., Poglitsch, A. et al. 1997, ApJ, 481, 343
- Hiromoto et al. (1989) Hiromoto, N., Itabe, T., Aruga, T. et al. 1989, Infrared Physics, 29, 255
- Hollenbach & McKee (1989) Hollenbach, D. & McKee, C. F. 1989, ApJ, 342, 306
- Hollenbach et al. (1991) Hollenbach, D. J., Takahashi, T., & Tielens, A. G. G. M. 1991, ApJ, 377, 192
- Ikeda et al. (1999) Ikeda, M., Maezawa, H., Ito, T., et al. 1999, ApJ, 527, L59
- Kaufman et al. (1999) Kaufman, M. J., Wolfire, M., Hollenbach, D., & Luhman, M. L. 1999, ApJ, 527, 795
- Köster et al. (1994) Köster, B., Störzer, H., Stutzki, J. & Sternberg, A. 1994, A&A, 284, 545
- Lester et al. (1983) Lester, D. F., Dinerstein, H. L. Werner, M. W., Watson, D. M., & Genzel, R. L. 1983, ApJ, 271, 618
- Mochizuki et al. (1994) Mochizuki, K., Nakagawa, T., Doi, Y., et al. 1994, ApJ, 430, L37
- Mookerjea et al. (2000) Mookerjea, B., Ghosh, S. K., Rengarajan, T. N. et al. 2000, AJ, 120, 1954
- Nakagawa et al. (1998) Nakagawa, T., Yui, Y. Y., Doi, Y. et al. 1998, ApJS, 115, 259
- O’Dell (2001) O’Dell, C. R. 2001, ARA&A, 39, 99.
- Plume et al. (2000) Plume, R., Bensch, F., Howe, J. et al. 2000, ApJ, 539, L133
- Russell et al. (1980) Russell, R. W., Melnick, G., Gull, G. E. & Harwit, M. 1980, ApJ, 240, L99
- Shibai et al. (1991) Shibai, H., Okuda, H., Nakagawa, T. et al. 1991, ApJ, 374, 522
- Stacey et al. (1993) Stacey, G. J., Jaffe, D. T., Geis, N. et al. 1993, ApJ, 404, 219
- Sternberg & Dalgarno (1989) Sternberg, A. & Dalgarno, A. 1989, ApJ, 338, 197
- Subrahmanyan et al. (2001) Subrahmanyan, R., Goss, W. M. & Malin, D. 2001, AJ, 121, 399
- Thronson & Telesco (1986) Thronson, H. A. & Telesco, C. M. 1986, ApJ, 311, 98
- Tielens & Hollenbach (1985) Tielens, A. G. G. M. & Hollenbach, D. 1985, ApJ, 291, 722
- Wilson et al. (2001) Wilson, T. L., Muders, D., Kramer, C. & Henkel, C. 2001, ApJ, 557, 240
- Wilson et al. (1997) Wilson, T. L., Filges, L., Codella, C., Reich, W. & Reich, P. 1997, A&A, 327, 1177
- Wolfire et al. (1990) Wolfire, M. G., Tielens, A. G. G. M., Hollenbach, D. 1990, ApJ, 358, 116
- Wright et al. (1991) Wright, E. L., Mather, C., Bennett, C. et al. 1991, ApJ, 381, 200