33email: scilla@df.unipi.it 44institutetext: INFN Sezione di Pisa, via Buonarroti 2, 56127 Pisa, Italy
55institutetext: Osservatorio Astronomico di Capodimonte, via Moiariello 16, 80131 Napoli, Italy 66institutetext: Osservatorio Astronomico di Collurania, via Maggini, 64100 Teramo, Italy 77institutetext: Dipartimento di Astronomia e Scienza dello Spazio, Largo E. Fermi 5, 50125 Firenze, Italy
Stellar Evolutionary Models for Magellanic Clouds
We supplement current evolutionary computations concerning Magellanic Cloud stars by exploring the evolutionary behavior of canonical stellar models (i.e.,with inefficient core overshooting) with metallicities suitable for stars in the Clouds. After discussing the adequacy of the adopted evolutionary scenario, we present evolutionary sequences as computed following a selected sample of stellar models in the mass range 0.8 8 M⊙ from the Main Sequence till the C ignition or the onset of thermal pulses in the advanced Asymptotic Giant Branch phase. On this basis, cluster isochrones covering the range of ages from 100 Myr to 15 Gyr are presented and discussed. To allow a comparison with evolutionary investigations appeared in the recent literature, we computed additional sets of models which take into account moderate core overshooting during the H burning phase, discussing the comparison in terms of current uncertainties in the stellar evolutionary models. Selected predictions constraining the cluster ages are finally discussed, presenting a calibration of the difference in magnitude between the luminous MS termination and the He burning giants in terms of cluster age. Both evolutionary tracks and isochrones have been made available at the node http://gipsy.cjb.net as a first step of a planned “Pisa Evolutionary Library”.
Key Words.:
stars:evolution, globular clusters:general, open clusters and associations:general, Galaxies:Magellanic Clouds1 Introduction
Stellar evolution in both Magellanic Clouds (MCs) has been the object of several investigations already appeared in the current literature, mainly because the stars in the Clouds can provide relevant constraints on distances to these stellar systems which, in turn, play a relevant role in constraining the cosmic distance scale (see e.g. Gallart et al. 2003, Woo et al. 2003, Bertelli et al. 2003, Salaris et al. 2003). At the same time, recent improvements in the observational capabilities have suddenly increased our knowledge of Magellanic stars, not only reaching fainter magnitudes but also revealing objects populating the right center of several stellar clusters (see e.g. Brocato et al. 2001, Brocato et al. 2003, Rich et al. 2000). However, the theoretical scenario concerning the evolution of MC stars has not been exhaustively explored yet. Recent theoretical computations for suitable chemical abundances, as given by the“canonical” values Z=0.004 (SMC) and Z=0.008 (LMC), all rely on the assumption of an efficient overshooting in the convective cores (Yi et al. 2001, Girardi et al. 2000, hereinafter GBBC, Salasnich et al. 2000). The parallel availability of evolutionary results from the canonical scenario, where convective mixing is based on the well known Schwarzschild criterion, appears of obvious relevance, at least to allow significant tests of the various assumptions.
This paper presents such a canonical evolutionary scenario, as based on the most recent version of our evolutionary code. For the sake of completeness, evolutionary computations with efficient overshooting will be also presented, and a comparison with similar computations in the recent literature will be provided. The availability of such an evolutionary scenario has recently allowed Brocato et al. (2003) to discuss new observational data for the LMC cluster NGC1866, showing that the question about the actual efficiency of core overshooting is indeed still open. In the following section we will discuss the theoretical background, giving a preliminary discussion on the choice of several evolutionary inputs and exploring the robustness of evolutionary results vis-a-vis the unpredictable amount of mass loss. Evolutionary models and cluster isochrones are presented in Sect.3, while in Sect.4 models with and without overshooting are compared with previous results appeared in the literature. In Sect.5 several parameters of observational relevance are discussed. A final discussion will close the paper.
2 The theoretical background
Stellar models critically depend on the physical inputs adopted in the computational procedure, and only suitable observational tests can give light on the actual adequacy of theoretical predictions. Present models were computed with an updated version of the FRANEC evolutionary code (see e.g. Chieffi & Straniero 1989) by adopting recent physical ingredients available in the literature, namely the equation of state and the opacity from the Livermore tables (Iglesias & Rogers 1996, Rogers et al. 1996) and updated nuclear cross sections (see Ciacio et al. 1997 and Cassisi et al. 1998 for more details). When efficient, the element diffusion has been taken into account with diffusion coefficients as given by Thoul et al. (1994). With these choices we have already shown that the Standard Solar Model appears in good agreement with helioseismological constraints (see Degl’Innocenti et al. 1997) as well as with the location in the color-magnitude diagram (CMD) of stars with Hipparcos parallaxes in the two nearby open clusters Hyades and Pleiades (Castellani et al. 2001, Castellani et al. 2002).
When moving to the lower metallicities of MC stellar populations, further tests are needed, to assess the overall adequacy of the evolutionary predictions and, in particular, to calibrate the value of the mixing length parameter, which governs the efficiency of the super-adiabatic convection and, in turn, the temperature of the Red Giant Branch (RGB) in old stellar clusters. For this test we choose the well observed galactic globular 47 Tuc with [Fe/H]=-0.70 0.03 (Carretta & Gratton 1997) and [/Fe]0.16 (see e.g. Ferraro et al. 1999); one indeed derives a total metallicity Z0.0040.0045, in reasonable agreement with the value Z=0.004 generally adopted for the SMC population. As shown in Fig. 1, by adopting the cluster reddening E(B-V)=0.03 from Schlegel et al. (1998), our models appear in good agreement with observations, and the choice l=H with =1.9 appears able to reproduce the observed RGB color. The distance modulus (13.56 mag.) obtained from the fit of the horizontal branch appears in perfect agreement with the result by Carretta et al. (2000).
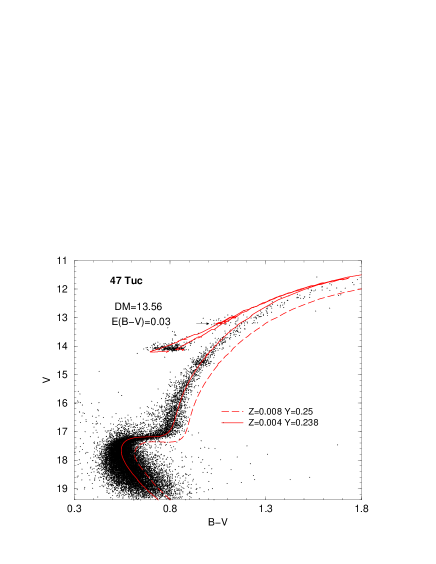
One may add the encouraging evidence that theoretical predictions concerning the bottom luminosity of the Asymptotic Giant Branch (AGB) appear in excellent agreement with observations. Entering into details, one may object that the predicted RG branch at the larger luminosity becomes progressively hotter than observed, making the fit good but not perfect. One could account for such an evidence by slightly decreasing the mixing length above the Horizontal Branch (HB) luminosity. However, it appears worth noting that such a behavior could be explained by mass loss in the upper RGB region, with a final decrease in mass by about 0.1-0.2 M⊙. Indeed, if the star internal structure does not react to mass loss (Castellani & Castellani 1993) the stellar envelope moves toward the redder RG branch of the decreasing masses.
In principle, there are no reasons for the mixing length remaining constant for stars of different mass or chemical composition. However, from the same Fig. 1 one finds that, when passing from Z=0.004 to Z=0.008, the predicted RGB color increases by about (B-V) 0.1, in reasonable agreement with the observed difference between SMC and LMC field Red Giants (Matteucci et al. 2002). Moreover, Brocato et al. (2003) have already found that this mixing length calibration gives red giants in good agreement also with the CM diagram location of the He burning intermediate mass stars in the LMC cluster NGC1866, with an estimated metallicity Z=0.0070.008. As a conclusion, one may be rather confident that present theoretical results should be at least in reasonable agreement with the major observational constraints.
Evolutionary computations have been performed neglecting the occurrence of mass loss. In the case of low mass stars developing electron degeneracy in the RGB phase, one knows that mass loss is governing - as a free parameter - the color location of the Zero Age Horizontal Branch (ZAHB) stars. A theoretical analysis of the effect of mass loss on stars with masses in the range 1.5 M2.5 M⊙ has been presented by Castellani et al. (2000), showing that one expects only minor variations in the luminosity of clumping He burning stars. The effects of mass loss in more massive stars has been already exhaustively discussed in the literature (see, e.g., Bertelli et al. 1985). As an example Fig. 2 shows the evolution of a 4.0 M⊙ model as computed by adopting the Reimers’s formulation (Reimers 1975) under various assumptions on the free parameter , governing the mass loss rate. One finds that even for values as large as 5 (against the recommended value of 1) the major effect is a reduction of the He burning blue loop, with a decrease in the loop luminosity not larger than logL0.025.
One may conclude that theoretical predictions appear rather robust vis-a-vis reasonable amounts of mass loss, which should not sensitively alter the current evolutionary scenario.

3 The models


Suitable sets of evolutionary models covering the mass range 0.88 M⊙ have been computed for the two metallicities Z=0.008 and Z=0.004, taken as representative of the Large and the Small Magellanic Cloud abundances, respectively (see e.g. Luck et al. 1998, Hilker et al. 1995). Original helium abundances have been fixed at Y=0.238 (Z=0.004) or Y=0.25 (Z=0.008), as obtained by assuming a primordial helium content Y and Y/Z 2.5 (see e.g. Pagel & Portinari 1998, Castellani et al. 1999). All these models have been followed from the Main Sequence (MS) through both the H and He burning phases, till C ignition or the onset of thermal pulses in the advanced AGB phase. For the less massive stars undergoing violent He flashes this has been done by using structures at the RG tip to produce suitable models of ZAHB, which have been evolved till the onset of the thermal pulses. Even less massive stars (M0.7 M⊙), whose evolutionary times are longer than the Hubble time, have been evolved up to central H exhaustion.
As an example, Fig. 3 shows the evolutionary paths in the HR diagram of a set of models for the labelled values of the mass and chemical composition. Detailed tables for all the tracks are available at the site http://gipsy.cjb.net in the directory “Pisa evolutionary library”. Each table lists, in the order, the age and, for each given age, the mass, luminosity and effective temperature, followed by the visual magnitude and the colors B-V, U-B, V-I, V-R and R-I as derived by adopting the model atmospheres by Castelli (1999). Tables with the ZAHB luminosity, temperature, V magnitude and B-V color for the various masses and chemical compositions are also available. Moreover, in the same site one may find also files depicting in some details the evolutionary results concerning three selected masses (M=0.9, 2.0 and 4.0 M⊙) covering the so called RG transition (see e.g. Sweigart et al. 1990). These tables are intended to offer to the evolutionary people the opportunity of a close inspection into our results, allowing significative comparison among different evolutionary computations. For each given value of the mass, a file lists in the order the sequence number of the model, its age, central abundance by mass of H or He, luminosity, effective temperature, central temperature and density, the maximum off-center temperature and its location, the mass of the convective core, He core and convective envelope and, in the last four columns, the fraction of the total luminosity released by pp, CNO and He nuclear burning and by the gravothermal energy. The masses of the He core at the helium ignition are in agreement with the results of Dominguez et al. (1999).
As a whole, the evolutionary behavior of all the models follows the well known prescriptions already and abundantly documented in the literature, and it does not deserve further comments. As shown in Fig. 4, we only notice that for Z=0.004 Y=0.238 one finds the lower mass limit for the carbon ignition (Mup) between 6.3 and 6.4 M⊙ (for Z=0.004 Y=0.27 Mup is between 6.0 and 6.1 M⊙ and for Z=0.008 Y=0.25 between 6.7 and 6.8 M⊙). Comparison with previous (canonical) limits as given in Castellani et al. (1990) discloses that with the improved input physics the limit has decreased by about 1 M⊙, a result which appears in agreement with the data presented more recently by Dominguez et al. (1999). Evolutionary tracks have been finally used to produce cluster isochrones covering the ages from 100 Myr to 15 Gyr. Figure 5 shows the isochrones set for the case Z=0.004 Y=0.238, as presented in the log(L/L⊙), logTe diagram. Data for all the isochrones can be found at the already quoted web site in files, which, for each given age, give the mass distribution of the evolving stars and, for each mass, the star luminosity and effective temperature together with the absolute V magnitude and selected colors in the Johnson and near-infrared Cousins bands.
4 Comparison with previous results


| R | ||||||
|---|---|---|---|---|---|---|
| Girardi et al. 2000 | 15.881 | 2.273 | 0.243 | 1.665 | 0.123 | 1.89 |
| No diffusion | 14.504 | 3.093 | 0.278 | 1.771 | 0.086 | 1.46 |
| Standard | 13.853 | 3.067 | 0.289 | 1.754 | 0.084 | 1.33 |
This section will be devoted to a comparison with similar results appeared in the recent literature. In our feeling, such a comparison is of some relevance, at least as a warning for the common reader about the amount of differences that can occur among recent evolutionary computations and against the uncritical use of evolutionary results. Differences in the results available in the literature arise from the adoption of different but still acceptable physical inputs and from the various assumptions about the efficiency of some macroscopic mechanisms as the microscopic diffusion or the core overshooting. In our knowledge, the only recent papers presenting evolutionary models and isochrones for the MC chemical composition are the ones by Girardi et al. (2000, Padova models) and by Yi et al. (2001, Yonsei-Yale models) both adopting a mild overshooting for H burning structures. Very recently the Padova models have been compared with the Yonsei-Yale ones (Gallard et al. 2003), here we will discuss the comparison of our isochrones with the Girardi et al. ones.
In the GBBC work all the H burning models with masses 1.5 M⊙ are supposed to be affected by the core overshooting, with an extra-mixing extending by about l Hp outside the canonical convective core. A similar overshooting has been also applied to all convective cores affecting the central He burning structures. The convective envelopes have been computed by adopting a mixing length parameter =1.68 but allowing for an efficient undershooting at the bottom of the convective region with l Hp for 0.6M/M⊙ 2.0 and lext=0.7Hp for M2.5 M⊙. Microscopic diffusion is not taken into account.
A first meaningful comparison between present and GBBC models can be made for the H burning phases of low mass stars, where overshooting is inefficient for the lack of the convective cores. In Fig.6 (left panel) the GBBC track for a 0.8 M⊙ star (Z=0.004 Y=0.24) is compared with a similar model as computed with our code neglecting diffusion and adopting the same chemical composition and the same mixing length (=1.68). The right panel of the same figure shows how evolutionary tracks are varied when moving toward our canonical model, first increasing from =1.68 to 1.9 and, finally, accounting for element diffusion. As a whole, differences in the left panel have to be ascribed to different input physics, as already exhaustively discussed in Castellani et al. (2000), and to the assumption of the undershooting in GCCB model. Evolutionary tracks in the right panel follow well known theoretical predictions (see e.g. Proffit & Vandenberg 1991, Chaboyer et al. 1992, Castellani et al. 1997) for the effects of the element diffusion. As a whole, the large variations one finds in both panels reinforce the need for suitable tests and calibrations of theories before producing evolutionary data for the observational community.
| Age | MT | MV | m | MT | MV | m | MT | MV | m | ||
|---|---|---|---|---|---|---|---|---|---|---|---|
| STANDARD | =0.1 | =0.25 | |||||||||
| 0.1 | -2.412 | 0.272 | 4.707 | -2.710 | 0.346 | 4.844 | -3.241 | 0.311 | 5.029 | ||
| 0.2 | -1.363 | 0.564 | 3.516 | -1.627 | 0.550 | 3.595 | -2.050 | 0.414 | 3.731 | ||
| 0.3 | -0.756 | 0.745 | 2.961 | -1.002 | 0.704 | 3.036 | -1.403 | 0.544 | 3.164 | ||
| 0.4 | -0.328 | 0.711 | 2.647 | -0.557 | 0.665 | 2.712 | -0.963 | 0.596 | 2.828 | ||
| 0.5 | 0.005 | 0.550 | 2.437 | -0.210 | 0.634 | 2.491 | -0.593 | 0.561 | 2.594 | ||
| 0.6 | 0.279 | 0.200 | 2.289 | 0.069 | 0.515 | 2.318 | -0.299 | 0.505 | 2.420 | ||
| 0.7 | 0.510 | -0.100 | 2.171 | 0.307 | 0.422 | 2.199 | -0.046 | 0.482 | 2.282 | ||
| 0.8 | 0.713 | -0.377 | 2.071 | 0.517 | 0.078 | 2.110 | 0.175 | 0.404 | 2.171 | ||
| 0.9 | 0.887 | -0.606 | 1.989 | 0.701 | -0.232 | 2.018 | 0.374 | 0.242 | 2.080 | ||
| 1.0 | 1.044 | -0.766 | 1.923 | 0.866 | -0.444 | 1.950 | 0.551 | 0.168 | 1.999 | ||
| 1.1 | 1.184 | -0.910 | 1.867 | 1.016 | -0.582 | 1.891 | 0.709 | -0.036 | 1.947 | ||
| 1.2 | 1.307 | -1.035 | 1.815 | 1.152 | -0.763 | 1.840 | 0.853 | -0.256 | 1.882 | ||
| 1.3 | 1.421 | -1.144 | 1.772 | 1.277 | -0.892 | 1.792 | 0.974 | -0.433 | 1.832 | ||
| 1.4 | 1.527 | -1.242 | 1.732 | 1.393 | -1.015 | 1.750 | 1.103 | -0.597 | 1.791 | ||
| 1.5 | 1.626 | -1.334 | 1.699 | 1.501 | -1.130 | 1.712 | 1.211 | -0.717 | 1.747 | ||
| 1.6 | 1.719 | -1.420 | 1.664 | 1.602 | -1.240 | 1.677 | 1.315 | -0.845 | 1.710 | ||
| 1.7 | 1.806 | -1.501 | 1.635 | 1.696 | -1.340 | 1.644 | 1.400 | -0.941 | 1.676 | ||
| 1.8 | 1.888 | -1.576 | 1.607 | 1.785 | -1.440 | 1.615 | 1.494 | -1.059 | 1.647 | ||
| 1.9 | 1.957 | -1.640 | 1.581 | 1.868 | -1.520 | 1.587 | 1.576 | -1.153 | 1.615 | ||
| 2.0 | 2.013 | -1.690 | 1.557 | 1.939 | -1.580 | 1.561 | 1.666 | -1.256 | 1.587 | ||
| 2.5 | 2.274 | -1.925 | 1.455 | 2.231 | -1.870 | 1.457 | 2.012 | -1.641 | 1.476 | ||
| 3.0 | 2.464 | -2.099 | 1.379 | 2.455 | -2.090 | 1.379 | 2.251 | -1.873 | 1.399 | ||
| 3.5 | 2.664 | -2.273 | 1.314 | 2.645 | -2.244 | 1.317 | 2.470 | -2.077 | 1.336 | ||
| 4.0 | 2.786 | -2.392 | 1.266 | 2.801 | -2.390 | 1.266 | 2.656 | -2.258 | 1.285 | ||
| 4.5 | 2.947 | -2.524 | 1.216 | 2.939 | -2.528 | 1.223 | 2.823 | -2.414 | 1.240 | ||
| 5.0 | 3.021 | -2.601 | 1.185 | 3.039 | -2.61 | 1.186 | 2.951 | -2.535 | 1.202 | ||
| 5.5 | 3.162 | -2.708 | 1.148 | - | - | - | - | - | - | ||
| 6.0 | 3.255 | -2.788 | 1.119 | - | - | - | - | - | - | ||
Table 1 compares selected evolutionary quantities for the above 0.8 M⊙ models. Even neglecting element diffusion one finds that the GBBC models have longer central H burning times, but shorter H-shell lifetimes. The large difference in the central He burning structures is partially due to the lower luminosity of their ZAHB models, but we guess it to be largely connected to the adoption of the core overshooting instead of the canonical semiconvection, as in our models. Without entering in further details, we feel that the above comparison convincingly demonstrate that all current models can be safely adopted to obtain a thumbnail understanding of the evolutionary status of actual cluster stars. However, before attempting precise comparison and/or calibrations, one should preliminarily make a reasoned choice among the various available models. This is, e.g., shown by the last column in Table 1, which discloses how far the calibration of the R parameter in terms of the original He content depends on the adopted evolutionary scenario.
| Age | MT | MV | m | MT | MV | m | MT | MV | m | ||
|---|---|---|---|---|---|---|---|---|---|---|---|
| STANDARD Y=0.238 | =0.25 Y=0.238 | STANDARD Y=0.27 | |||||||||
| 0.1 | -2.463 | 0.221 | 4.559 | -3.389 | 0.152 | 5.154 | -2.371 | 0.232 | 4.290 | ||
| 0.2 | -1.397 | 0.356 | 3.453 | -2.139 | 0.193 | 3.682 | -1.305 | 0.305 | 3.246 | ||
| 0.3 | -0.781 | 0.525 | 2.904 | -1.533 | 0.351 | 3.170 | -0.71 | 0.222 | 2.751 | ||
| 0.4 | -0.346 | 0.585 | 2.566 | -1.086 | 0.404 | 2.843 | -0.286 | 0.036 | 2.454 | ||
| 0.5 | -0.020 | 0.387 | 2.358 | -0.730 | 0.400 | 2.607 | 0.046 | -0.126 | 2.252 | ||
| 0.6 | 0.273 | 0.115 | 2.204 | -0.437 | 0.385 | 2.432 | 0.322 | -0.244 | 2.092 | ||
| 0.7 | 0.484 | -0.218 | 2.097 | -0.187 | 0.383 | 2.290 | 0.526 | -0.441 | 1.984 | ||
| 0.8 | 0.651 | -0.484 | 2.004 | 0.032 | 0.375 | 2.174 | 0.705 | -0.620 | 1.897 | ||
| 0.9 | 0.799 | -0.622 | 1.930 | 0.228 | 0.360 | 2.078 | 0.866 | -0.781 | 1.822 | ||
| 1.0 | 0.934 | -0.749 | 1.869 | 0.397 | 0.323 | 2.002 | 1.013 | -0.928 | 1.761 | ||
| 1.1 | 1.058 | -0.861 | 1.813 | 0.544 | 0.142 | 1.937 | 1.156 | -1.014 | 1.709 | ||
| 1.2 | 1.171 | -0.969 | 1.766 | 0.680 | -0.033 | 1.880 | 1.281 | -1.139 | 1.661 | ||
| 1.3 | 1.276 | -1.064 | 1.721 | 0.805 | -0.195 | 1.830 | 1.397 | -1.253 | 1.618 | ||
| 1.4 | 1.374 | -1.154 | 1.682 | 0.921 | -0.342 | 1.786 | 1.502 | -1.362 | 1.580 | ||
| 1.5 | 1.464 | -1.237 | 1.646 | 1.030 | -0.486 | 1.744 | 1.577 | -1.444 | 1.546 | ||
| 1.6 | 1.549 | -1.315 | 1.613 | 1.132 | -0.614 | 1.705 | 1.666 | -1.534 | 1.514 | ||
| 1.7 | 1.629 | -1.390 | 1.582 | 1.228 | -0.741 | 1.671 | 1.734 | -1.591 | 1.485 | ||
| 1.8 | 1.703 | -1.459 | 1.554 | 1.319 | -0.857 | 1.639 | 1.797 | -1.653 | 1.459 | ||
| 1.9 | 1.773 | -1.522 | 1.528 | 1.405 | -0.965 | 1.608 | 1.865 | -1.716 | 1.435 | ||
| 2.0 | 1.839 | -1.586 | 1.504 | 1.487 | -1.074 | 1.581 | 1.918 | -1.763 | 1.412 | ||
| 2.5 | 2.122 | -1.846 | 1.403 | 1.814 | -1.464 | 1.469 | 2.176 | -1.998 | 1.319 | ||
| 3.0 | 2.334 | -2.038 | 1.325 | 2.066 | -1.719 | 1.392 | 2.378 | -2.176 | 1.246 | ||
| 3.5 | 2.504 | -2.193 | 1.263 | 2.284 | -1.938 | 1.330 | 2.546 | -2.318 | 1.188 | ||
| 4.0 | 2.653 | -2.330 | 1.211 | 2.467 | -2.123 | 1.279 | 2.693 | -2.448 | 1.142 | ||
| 4.5 | 2.783 | -2.443 | 1.164 | 2.644 | -2.282 | 1.235 | 2.821 | -2.560 | 1.104 | ||
| 5.0 | 2.898 | -2.542 | 1.123 | 2.833 | -2.487 | 1.195 | 2.936 | -2.661 | 1.070 | ||
| 5.5 | 3.001 | -2.633 | 1.087 | - | - | - | 3.039 | -2.751 | 1.041 | ||
| 6.0 | 3.096 | -2.715 | 1.050 | - | - | - | 3.139 | -2.835 | 1.014 | ||
A short discussion concerning the comparison between present and GBBC models for the more massive stars has been already presented by Brocato et al. (2003) for the case of solar metallicity. To extend the comparison to Magellanic abundances, we computed an additional set of models (Z=0.004 Y=0.238, Z=0.008 Y=0.25) by allowing an efficient core overshooting in the H burning phase, as modelled according to Castellani et al. (2000) with , and values covering the range suggested in the recent literature (see e.g. Girardi et al. 2000, Pols et al. 1998). We recall that due to the different treatment of the overshooting phenomenon the value adopted by the Padua group is roughly equivalent to one half of the value adopted in present work. In particular the Padua =0.5 corresponds to the present =0.25.
| Age(Gyr) | M | M | M |
|---|---|---|---|
| Z=0.008 Y=0.25 | Z=0.004 Y=0.238 | Z=0.004 Y=0.27 | |
| 7.0 | 3.906 | 3.797 | 3.816 |
| 8.0 | 4.032 | 3.919 | 3.922 |
| 9.0 | 4.137 | 4.026 | 4.063 |
| 10.0 | 4.200 | 4.106 | 4.167 |
| 11.0 | 4.232 | 4.196 | 4.268 |
| 12.0 | 4.332 | 4.280 | 4.369 |
| M | M | M |
|---|---|---|
| Z=0.008 Y=0.25 | Z=0.004 Y=0.238 | Z=0.004 Y=0.27 |
| 0.761 | 0.672 | 0.565 |
Figure 7 shows the comparison between a 4 M⊙ by Girardi et al. (2000) and our model with a similar amount of overshooting and the same mixing lenght. One finds that the two models are in rather good agreement, but with GBBC He burning giants fainter than ours. The same figure shows the dramatic difference when neglecting the overshooting, in agreement with already well known predictions (see e.g. Maeder 1975, Bressan et al. 1993 and references therein). Data in the figure add the evidence that a mild overshooting, as given by =0.1, produces only marginal variations in the predicted evolutionary path, so that one can easily predict that the occurrence of such a mild overshooting will be very hard to proof. Evolutionary lines and cluster isochrones with selected choices for the efficiency of overshooting can be found at the same web link quoted above. As usual, models with overshooting are calculated for masses 1.2 M⊙ to avoid the unobserved presence of the overall contraction feature in low mass stars; for this reason isochrones with overshooting are calculated for ages lower than about 5 Gyr. Due to the relatively low ages, models with overshooting do not include microscopic diffusion.
5 An age indicator

Theoretical constraints on the age of stellar clusters are among the most relevant results of stellar evolutionary theories, allowing to shed light on the history of stellar populations. In this context, clusters belonging to the Magellanic Clouds appear of particular interest, since their significant range of ages represents an ideal target for testing theory. The most exhaustive approach to the problem of the cluster ages is obviously provided by the well known isochrone fitting procedure. However, the availability of more direct and simple “age indicators” has been already proved of some relevance.
In the case of old globulars, since the pioneering paper by Iben (1968), the so called “vertical method”, based on the difference (MV) between the Turn-Off (TO) and the helium burning HB phase has been widely used (see e.g. Stetson et al. 1996, Salaris & Weiss 1997, Cassisi et al. 1998, 1999). A similar method can be however adopted for younger clusters, calibrating the difference in magnitude between the bright MS termination (MT) and the clump of He burning giants (see e.g. Salaris & Girardi 2002, Castellani et al. 1999, Udalski et al. 1998). According to such an evidence, we made use of present isochrones to calibrate such a parameter in terms of the cluster ages. The aim is to provide an easy-to-do observational parameter able to derive from the CM diagram of a cluster, at least, a correct order of magnitude for the age, independently of the cluster distance.
Table 2 gives data for such a calibration, as evaluated for LMC compositions and with the labelled assumptions about the efficiency of overshooting, whereas Table 3 gives similar data but for SMC, testing also the effects of an increased amount of original He. The tables gives, for each value of the cluster age, the V magnitude of the MS termination and the difference in visual magnitude between the clump and MT evaluated respectively as the bottom luminosity of the He clump region and as the brightest magnitude reached just after the overall contraction phase (H exhaustion). For each age, the original mass of stars populating the He burning clump is also reported.
Figure 8 shows the run of MV as a function of the cluster age. As already known (see, e.g., Fig. 11 in Castellani et al. 1992) one finds that MV attains a minimum for ages around 300-400 Myr, definitely increasing when the age increases above that value. One concludes that MV works as an univocal indicator only for ages larger than 700-800 Myr, whereas for lower ages there is in principle a possible ambiguity. Data in the same figure shows the not negligible dependence of the calibration on the assumptions made about both overshooting and He content, representing an obvious additional uncertainty. However, it could offers the opportunity to constrain these parameters by comparison with a set of well observed LMC clusters covering a suitable range of ages.
Interestingly enough, one may notice that the predicted evolutionary scenario appears at least qualitatively supported by the the sample of 21 CM diagrams for LMC clusters recently presented by Brocato et al. (2001). By looking at Fig. 14 in that paper, one finds (apart from the case of NGC6718) a support to the overall behavior of MV with time, including the occurrence of a minimum value of the order of the predicted one. Data in the previous Tables 2 and 3 can be useful in several ways. As an example, by simply looking at the CM diagram of cluster NGC2420 (Anthony-Twarog et al. 1990) from the observed difference in magnitude between the He-clump and the MS termination (M 1.5 mag ) one finds for the cluster a (canonical) age of the order of 2 Gyr, in agreement with the results obtained through the fit of the CMD diagram (see e.g. Pols et al. 1998, Prada Moroni et al. 2001) but without the need for a complicate isochrone fitting procedure. In the meantime one gives, at least, an indication of the absolute magnitude of the MS termination and, thus, of the cluster distance modulus together with information on the original mass of the evolving He giants.
6 Final remarks
In this paper we have presented and discussed the canonical evolutionary scenario for stars with the chemical compositions suitable for the two MCs. The effect of overshooting has been also discussed by producing a set of parallel investigations as based on the same procedures and the same input physics. On this basis we make available evolutionary tracks and cluster isochrones covering the range of ages 100 Myr15 Gyr. The difference in magnitudes between the top MS (the Blue Sequence) and He burning structures has been finally calibrated in terms of the cluster age. However, we are well aware that observational constraints on such a parameter can be sometime not easy, if not difficult. A poorly populated cluster may lack of the most luminous stars, either in the He burning phase or above the overall contraction phase. Moreover, in strongly populated clusters the occurrence of binaries can mask the MS top, adding objects at higher luminosity. However, even bearing in mind these warnings, we feel that such a calibration appears as a relevant topic of the presented evolutionary scenario, allowing an easy and quick approach to the problem of cluster ages.
Acknowledgements.
Financial support for this work was provided by the Ministero dell’Istruzione, dell’Università e della Ricerca (MIUR) under the scientific project “Stellar observables of cosmological relevance” (V. Castellani & A. Tornambè, coordinators).References
- (1) Anthony-Twarog B.J., Twarog B.A., Kaluzny J., & Shara M.M. 1990, AJ 99, 1504
- (2) Bertelli G., Bressan A.G., & Chiosi C. 1985, A&A 150,33
- (3) Bertelli G., Nasi E., Girardi L. et al., 2003, ApJ 125, 770
- (4) Bressan A., Fagotto F., Bertelli G., & Chiosi C. 1993, A&AS 100, 647
- (5) Brocato E., Castellani V., Raimondo G., & Walker A. 2003, AJ (in publication), astro/ph 0302458
- (6) Brocato E., Di Carlo E., & Menna G. 2001, A&A 374, 523
- (7) Carretta E. & Gratton R. 1997, A&AS 121, 95
- (8) Carretta E., Gratton R., Clementini G., & Fusi Pecci F. 2000, ApJ 533, 215
- (9) Cassisi S., Castellani V., Degl’Innocenti S., & Weiss A. 1998, A&AS 129, 267
- (10) Cassisi S., Castellani V., Degl’Innocenti S., Salaris M., & Weiss A. 1999, A&AS 134, 103
- (11) Castellani M., & Castellani V. 1993, Apj 407, 649
- (12) Castellani V., Chieffi A., & Straniero O. 1990, ApJS 74,463
- (13) Castellani V., Chieffi A., & Straniero O. 1992, ApJS 78,517
- (14) Castellani V., Ciacio F., Degl’Innocenti S., & Fiorentini G. 1997, A&A 322, 801
- (15) Castellani V., Degl’Innocenti S., & Marconi M. 1999, MNRAS 303, 265
- (16) Castellani V., Degl’Innocenti S., Girardi L. et al. 2000, A&A, 354, 150
- (17) Castellani V., Degl’Innocenti S., & Prada Moroni P.G. 2001, MNRAS 320, 66
- (18) Castellani V., Degl’Innocenti S., Prada Moroni P.G., & Tordiglione V. 2002, MNRAS 334, 193
- (19) Castelli F. 1999, A&A, 346, 564
- (20) Chaboyer B., Sarajedini A., & Demarque P. 1992, ApJ 394, 515
- (21) Chieffi A., & Straniero O. 1989, ApJS 71, 47
- (22) Ciacio F., Degl’Innocenti S., & Ricci B. 1997, A&AS 123, 449
- (23) Degl’Innocenti S., Dziembowski W.A, Fiorentini G., & Ricci B. 1997, Astrop. Phys. 7, 77
- (24) Dominguez I., Chieffi A., Limongi M., & Straniero O. 1999, ApJ 524, 226
- (25) Ferraro F.R., Messineo M., Fusi Pecci F. et al. 1999, AJ 118, 1738
- (26) Gallart C., Zoccali M., Bertelli G. et al., 2003, ApJ 125, 742
- (27) Girardi L., Bressan A., Bertelli G., & Chiosi C. 2000, A&AS 141, 371
- (28) Hilker M., Richtler T., & Gieren W. 1995, A&A 294, 648
- (29) Iben I.Jr. 1968, Nature, 220, 143
- (30) Iglesias C.A., & Rogers F.J. 1996, ApJ 464, 943
- (31) Luck R.E., Moffet T.J., Barnes T.G., & Gieren W.P. 1998, AJ 115, 605
- (32) Maeder A. 1975, A&A 40, 303
- (33) Matteucci A., Ripepi V., Brocato E., & Castellani V. 2002, A&A 387, 861
- (34) Pagel B.E.J., & Portinari L. 1998, MNRAS 298, 747
- (35) Pols O.R., Schroeder K-P, Hurley J.R., Tout C.A., & Eggleton P.P. 1998, MNRAS 298, 525
- (36) Prada Moroni P.G., Castellani V., Degl’Innocenti S., & Marconi M. 2001, Mem. SAIt 72, 407
- (37) Proffit C.R. & VandenBerg D.A. 1991, ApJS 77, 473
- (38) Reimers D. 1975, Mem. Soc. R. Sci. Liege, ser. 6, vol.8, p. 369
- (39) Rich R. M., Shara M., Fall S. M., & Zurek D., 2000, AJ 119, 197
- (40) Rogers F.J., Swenson F.J., & Iglesias C.A. 1996, ApJ 456, 902
- (41) Salaris M, & Girardi L., 2002, MNRAS 337, 332 (2002)
- (42) Salaris M, & Weiss A. 1997, A&A 327, 107
- (43) Salaris M, Percival S., Brocato E., Raimondo G., & Walker A. R., 2003, ApJ (accepted), astro-ph/0301532
- (44) Salasnich B., Girardi L., Weiss A., & Chiosi C. 2000, A&A 361, 1023
- (45) Schlegel D.J., Finkbeiner D.P., & Davis M. 1998, ApJ, 500, 525
- (46) Sosin C., Piotto G., Djorgovski S.G. et al., 1996, Proceeding of the workshop ”Stellar Ecology”, Marciana Marina, Italy, Rood R.D. and Renzini A. eds., p.92
- (47) Stetson P.B., VandenBerg D.A., & Bolte M., 1996, PASP 108, 560
- (48) Sweigart A.V., Greggio L., & Renzini A., 1990, ApJ 364, 527
- (49) Thoul A., Bahcall J., & Loeb A. 1994, ApJ 421, 828
- (50) Udalski A., Szymański M., Kubiak M. et al., 1998, Acta Astr. 48, 1
- (51) VandenBerg D.A., Bolte M., & Stetson P.B. 1996, ARA&A 34, 461
- (52) Yi S., Demarque P., Kim Y-C. et al., 2001, ApJ 533, 670
- (53) Woo J. H., Gallart C., Demarque P., Yi S., & Zoccali M., 2003, ApJ 125, 754