C II∗ ABSORPTION IN DAMPED Ly SYSTEMS: (II) A NEW WINDOW ON THE STAR FORMATION HISTORY OF THE UNIVERSE
Abstract
Starting from the SFR per unit physical area, determined for DLAs using the C II∗ method, we obtain the SFR per unit comoving volume at 3. Pure warm neutral medium (WNM) solutions are ruled out since they generate more bolometric background radiation than observed, but the CNM-dominated two-phase solutions are consistent with the backgrounds. We find the SFR per unit comoving volume for DLAs agrees with that for the Lyman Break Galaxies (LBGs). Though the mass of produced stars indicated by the SFRs is consistent with the current densities of known stellar populations, the mass of metals produced by =2.5 is 30 times larger than detected in absorption in DLAs. Of the three possible solutions to this “missing metals” problem, the most likely appears to be that star formation occurs in compact bulge regions. We search for evidence of feedback and find no correlations between the SFR per unit area and N(H I), but possible correlations between SFR per unit area and low-ion velocity width and SFR per unit area and metal abundance. We show that (a) the correlation between cooling rate and dust-to-gas ratio is positive evidence for grain photoelectric heating, (b) the CMB does not significantly populate the C II excited fine-structure states, and (c) the ratio of CII∗ to resonance-line optical depths is a sensitive probe of the multi-phase structure of the DLA gas. We address recent arguments that DLAs are comprised only of WNM gas, and show them to be inconclusive. Despite the rough agreement between SFR per unit comoving volume for DLAs and LBGs, current evidence indicates these are distinct populations.
submitted to the Astrophysical Journal Nov.5,2002
1 INTRODUCTION
This is the second of two papers describing a new method for obtaining star formation rates (SFRs) in damped Ly systems (DLAs). In Paper I (Wolfe, Prochaska, & Gawiser 2003) we showed how measurements of C II∗ 1335.7 absorption lines in DLAs allow one to infer the cooling rate per H atom of the neutral gas. Since we assume steady-state conditions, this equals the heating rate per H atom, which we use to infer the SFR per unit area, . We do this by assuming gas in DLAs to be heated by the same mechanism responsible for heating the ISM in the Milky Way, the grain photoelectric effect (Bakes & Tielens 1994; Weingartner & Draine 2001a). In that case the heating rate is proportional to the product of the dust-to-gas ratio, , the photoelectric heating efficiency, , and the mean intensity of FUV radiation, ; the latter is proportional to for sources in a plane parallel layer. Specifically, in Paper I we modeled DLAs as uniform gaseous disks with radius, , and scale-height , in which the sources of FUV radiation were uniformly distributed. We also showed how can be deduced from the [Fe/Si] and [Si/H] abundance ratios (recall [X/Y]log10(X/Y) log10(X/Y)⊙) for the following assumptions about grain composition: grains were either carbonaceous as in the Galaxy (the “Gal” model) or Silicates as in the SMC (the “SMC” model). We inferred by assuming the number of depleted C or Si atoms per depleted Fe atom to be the same in DLAs as in the ISM. Furthermore, we considered depletion ratios ranging from a minimal “nucleosynthetic ceiling” in which the intrinsic ratio, [Fe/Si]int=0.2, to a maximal depletion ratio, [Fe/Si]int=0.0 (see Prochaska & Wolfe 2002; hereafter referred to as PW02).
In Paper I we solved the transfer equation for and then
calculated the thermal equilibrium of gas subjected to cosmic-ray and
X-ray heating in addition to grain photoelectric heating. The gas was
assumed to cool in the usual way; i.e., by emission of fine-structure,
metastable, and Ly lines as well as grain recombination
radiation. We found that gas can reside in two thermally stable
states; a cold neutral medium (CNM) and a warm neutral medium (WNM)
(see Wolfire et al. 1995, hereafter W95). Typically, the densities
and temperatures of the CNM and WNM are 10 cm-3and 150 K, and 0.2
cm-3 and 8000 K respectively. We further assumed the CNM and WNM
to be in pressure equilibrium at pressure
= where and are
the minimum and maximum pressures of the pressure versus density
curve. We considered a CNM model in which the line-of-sight to the
background QSO encounters comparable column densities of gas in the
CNM and the WNM. We also considered a WNM model in which the
line-of-sight encountered only WNM gas at pressure equal to
. Combining the measured heating rates with those predicted at
the thermally stable gas densities, and , we
obtained unique values for for each DLA; one value for the CNM
solution and the other for the WNM solution. We then averaged ,
for two redshift bins centered at =2.15 and =3.70, to derive the
average SFR per unit physical area, . The WNM models result in
significantly higher SFRs than the CNM models since the measured
[C II] 158 m cooling rate per H atom, , is a small
fraction of the total cooling rate in the WNM, whereas equals
the total cooling rate in the CNM (see Paper I).
This paper starts by considering quantities with cosmological significance. Specifically, in 2 we combine with the incidence of DLAs per unit absorption distance interval, (Bahcall & Peebles 1969), to derive the SFR per unit comoving volume, . We then derive the bolometric background intensity, , for all model combinations. We show that the WNM models produce more background radiation than observed in every case, and as a result are ruled out. By contrast the CNM models are consistent with the observed values of . We compute a consensus model, which is an average over all the CNM models. We show that the resulting are comparable to inferred for the Lyman Break Galaxies (Steidel et al. 1999; hereafter referred to as LBGs). In 3 we consider implications of these results. We compute the mass of stars and the mass of metals produced by the star formation history, , of the consensus model. While the mass of stars is consistent with masses of current stellar populations, the mass of metals produced by =2.5, is more than 30 times the mass of metals inferred for DLAs at the same redshift. We discuss possible solutions to this dilemma including a “bulge” model in which star formation is confined to a compact region located at the center of the extensive region creating C II∗ absorption. We consider independent evidence for (a) star formation and (b) the deposition of stellar energy into the absorbing gas, i.e., feedback. At this point the reader not interested in the physics of interstellar gas can turn to the final section, 6. Having discussed various implications of our models we proceed to test their self-consistency in 4 where three tests are carried out. First, we find a statistically significant correlation between the [C II] 158 m cooling rate per atom, , and , which is strong evidence in favor of grain photoelectric heating. Second, we show that the spontaneous energy emission rate, , reflects the cooling rate of the gas instead of the excitation level caused by CMB radiation. Third, we examine the ratio of C II∗ to resonance-line optical depths to look for evidence of shifts in gas phase. In 5 we discuss arguments made by other authors against the presence of CNM gas in DLAs. A careful reassessment of these arguments shows that they do no rule out the presence of CNM gas in DLAs. A summary and concluding remarks are given in 6.
Unless stated otherwise we adopt an Einstein-deSitter cosmology in which =1, =0, and =0.5 to facilitate comparison with published results.
2 COSMOLOGICAL QUANTITIES
We now turn to quantities with cosmological significance. We compute the SFR per unit comoving volume, . The redshift dependence of implies a star formation history throughout spacetime that gives rise to background radiation. We calculate the bolometric intensity of this background radiation for the CNM and WNM models and compare the results with observations. We then construct a consensus CNM model for , which is consistent with measurements of the background radiation.
2.1 The SFR per Unit Comoving Volume
The SFR per unit comoving volume for DLAs is given by
| (1) |
where is the average SFR per unit physical area at redshift , and and are the average physical cross-sectional area and comoving density of the DLAs. While neither nor has been determined from observations, their product is known from the incidence of DLAs per unit absorption distance interval, (e.g. Storrie-Lombardi & Wolfe 2000). We find
| (2) |
where is the average projection of on the plane of the sky, and , the absorption distance (Bennett et al. 2003), is given by
| (3) |
As a result
| (4) |
We computed by assuming the DLAs to be plane-parallel layers; i.e., =2, and by choosing an Einstein-deSitter cosmology (=1,=0, =0.5). Although this model is ruled out by observations (e.g. Bahcall et al. 1999), it is the model used in most published determinations of (e.g., Steidel et al. 1999; Lanzetta et al. 2002), and for this reason we selected it for purposes of comparison. We chose and its associated errors from Table 3 in Paper I and calculated at the mean of the redshift bins from the expression
| (5) |
found by Storrie-Lombardi & Wolfe (2000) for the Einstein-deSitter cosmology. Errors in were computed by propagating errors in and in .
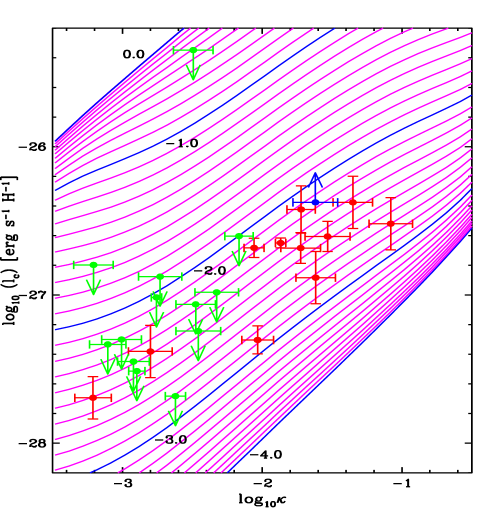
The results for the “Gal” dust models are shown in Figure 1 as magenta data points for minimal depletion
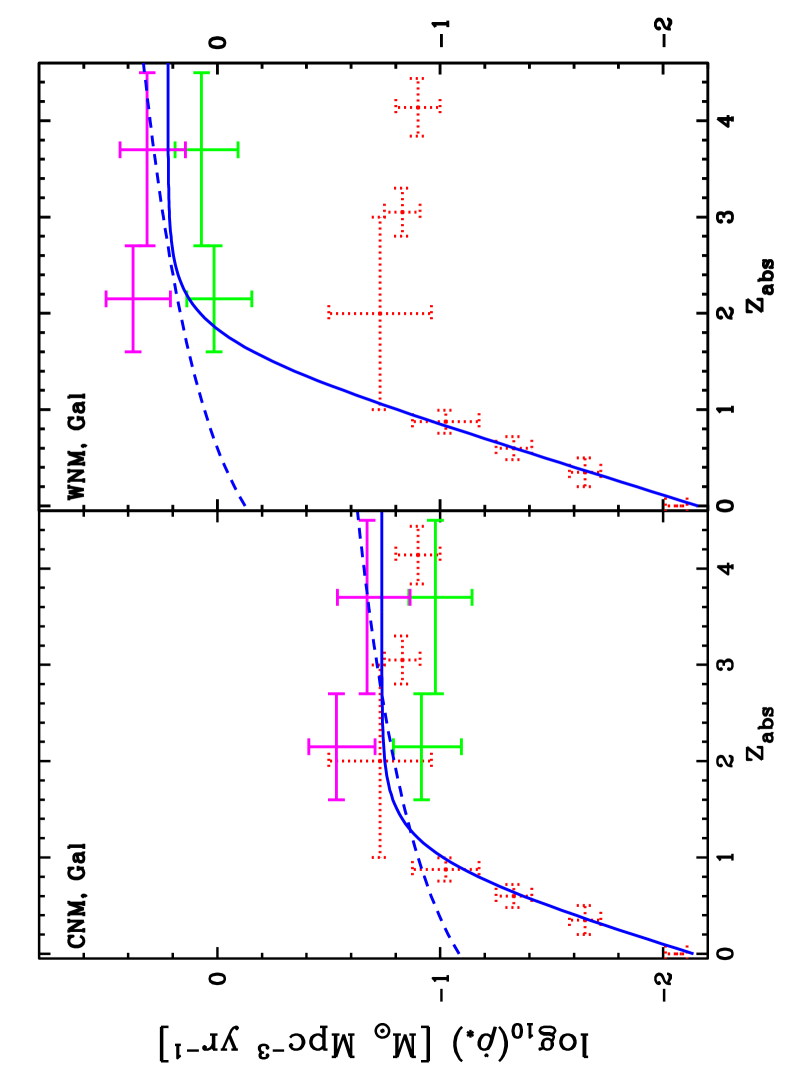
and green data points for maximal depletion. As expected, the SFRs per unit comoving volume for the WNM models (Figure 1b) are at least 10 times higher than for the corresponding CNM models (Figure 1a). Furthermore, for every model, minimal depletion gives rise to higher than the maximal depletion. This is because for a given heating rate, is inversely proportional to the dust-to-gas ratio, , and is lower for minimal depletion than for maximal depletion. Figure 1 also reveals no evidence for statistically significant redshift evolution of determined by the C II∗ technique. This is in accord with determinations of from luminosities measured for flux-limited samples of galaxies, shown as red data points. For the galaxy sample the SFRs in the two highest redshift bins are based on Lyman-break galaxies that are luminous at rest-frame UV wavelengths (Steidel et al. 1999), while the four lowest redshift points are based on galaxies with lower luminosities (Lilly et al. 1996). The bin at = 2 is based on far-infrared (FIR) luminous galaxies detected by SCUBA (Holland et al. 1999). The redshifts for these objects were determined from a still uncertain radio-FIR photometric redshift indicator (Barger et al. 2000). Interestingly, the magnitude of the comoving SFRs deduced by the C II∗ and galaxy luminosity techniques are not very different in the redshift interval where they overlap; i.e., [2,4.5]. For the CNM model the difference is less than a factor of 2, while for the WNM model the difference is about a factor of 10. We discuss possible implications of this agreement in 2.3 and 6.
To test the generality of these conclusions, the calculations were repeated for the “SMC” dust models. The results, shown in Figure 2, reveal the same patterns as found for “Gal” dust. The principal difference is the systematically higher values of predicted by corresponding “SMC” models. This is because the photoelectric heating efficiency of silicate grains is lower than that of carbonaceous grains (see Figure 15 in Weingartner & Draine
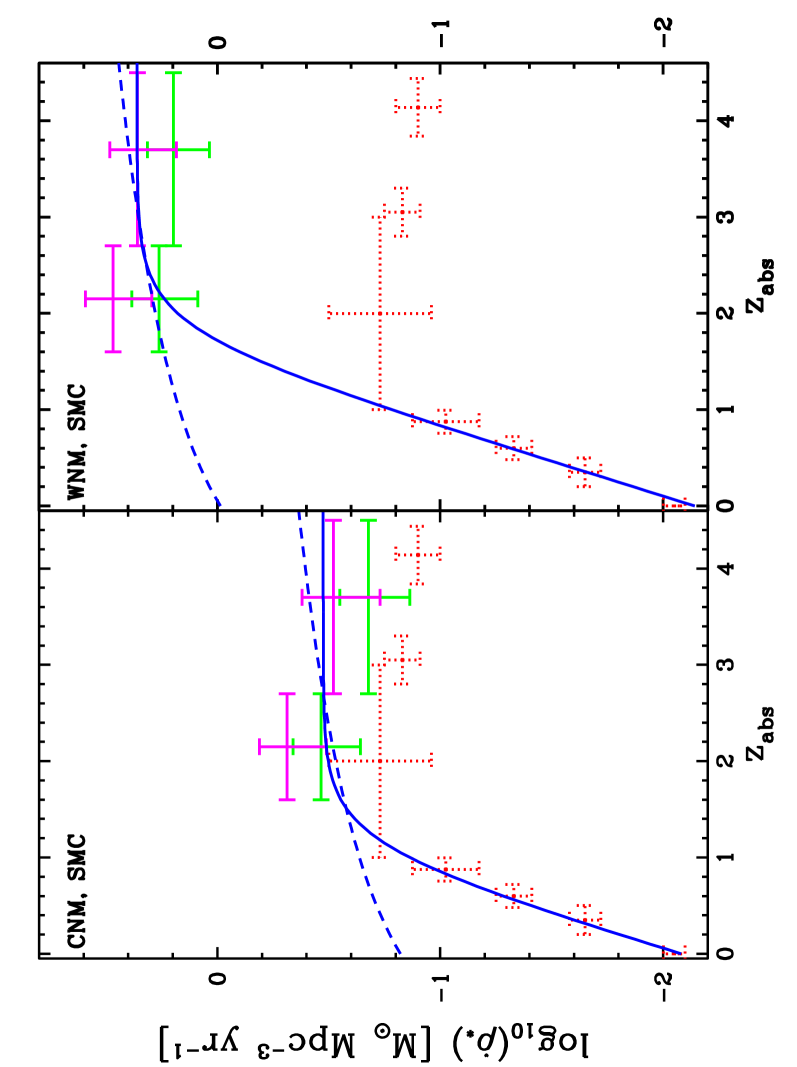
2001a), and as a result higher SFRs are required to achieve a given heating rate in the case of silicate (i.e., “SMC”) grains. Comparison between Figures 1 and 2 also reveals smaller differences between derived for minimal and maximal depletion in the case of “SMC” dust than for “Gal” dust. The phenomenon is present in the CNM model but not the WNM model. In the case of maximal depletion, [C/H]gas is larger by 0.2 dex than for minimal depletion. But an increase in [C/H]gas causes a decrease in , which can increase significantly if intersects the rising () curves caused by the transition from WNM to CNM temperatures (see Figure 5 in Paper I). In the case of “SMC” dust this effect compensates for the decrease in caused by the increase in discussed above, because the heating rate increases more rapidly with density than for “Gal” dust (Weingartner & Draine 2001a). Consequently, the net difference in , hence , is smaller for “SMC” than for “Gal” dust.
2.2 Bolometric Background Intensity
While the general trends in the versus plane appear to be insensitive to our choice of model assumptions, large systematic uncertainties in the comoving SFRs remain. Though uncertainties in dust composition and depletion level are contributing factors, the largest source of error stems from uncertainties in the thermal phase: Does C II∗ absorption arise from gas in the CNM or WNM phase? To address this question we compute the extragalactic bolometric background intensity, . Because is generated by a given star formation history, and since the star formation histories indicated by the CNM and WNM models are very different, measurements of the background intensity may be able to discriminate between them.
The bolometric extragalactic background intensity generated by a given star formation history, (), is as follows:
| (6) |
where is the bolometric luminosity per unit mass as a function of age of a stellar population with a specified IMF (Madau & Pozzetti 2000), is the formation epoch of the stellar population, and is the current age of the universe. We tested the models by computing backgrounds generated by analytic fits to the C II∗ comoving SFRs. The fits are shown as smooth curves in Figures 1 and 2, and the backgrounds they generate as corresponding curves in Figure 3.
First, we explored the hypothesis that high- DLAs evolve into normal low- galaxies. Evolution into normal galaxies is consistent with the recent identification of DLAs at 1 with the local galaxy population (Zwaan et al. 2002; Turnshek et al. 2002; Rosenberg & Schneider 2003). In that case the star formation histories are constrained to pass through the comoving SFRs measured for galaxies at 1 and for DLAs at higher redshifts. The results are shown as solid blue curves for “Gal” dust in Figure 1 and “SMC” dust in Figure 2. For the CNM model (Figures 1a and 2a) the curves resemble the star formation histories inferred from galaxy luminosities in the redshift interval = [0,5]. For the WNM model (Figures 1b and 2b) the fits greatly exceed the comoving SFRs inferred for the LBGs at 2, though they are in good agreement with the galaxy data at 1. Here the DLAs could represent a population of objects undetected in emission at high that evolve into normal galaxies at low redshifts. Second, we considered an hypothesis in which the star formation histories of DLAs are dictated solely by their redshift evolution, without regard to the galaxy data. In this case we combined the expression for () in equation (4) with the expression for in equation (5). Although we find is independent of redshift in the redshift interval = [1.6,4.5], at lower redshifts there are no measurements of C II∗, and as a result () is unknown. Low redshifts are crucial because that is where most of the background radiation arises. For simplicity we let equal a constant evaluated by averaging over all the inferred from C II∗ absorption. The results are shown as dashed curves in Figures 1 and 2.
The resulting backgrounds are shown in Figure 3 where we plot the predicted bolometric intensity from DLAs with versus . The significance of this quantity, , is that it reveals the contribution to the measured background, (i.e, ), made by DLAs in the redshift range for which () has been determined; i.e., =[1.6,4.5]. The backgrounds were obtained with an Einstein-deSitter cosmology assuming = 0.5, by adopting the same IMF used to relate to mean intensity (see Paper I), using Bruzual and Charlot’s (1993) population synthesis libraries (see Madau & Pozzetti 2000), and by assuming a formation redshift, = 5. For comparison, the two horizontal straight lines depict upper and lower limits on set by measurements between 0.15 m and 1000 m (Hauser & Dwek 2001). This wavelength range is relevant since it brackets the background spectra predicted for most models of DLAs (e.g. Pei et al. 1999). According to Dwek (2002) the upper limits, which are crucial here, are conservative and should be regarded as 95 confidence limits. It is important to emphasize that while is cosmology dependent, the backgrounds computed from the C II∗ technique (i.e. by combining equations (4) and (6)) are independent of the adopted cosmology and Hubble constant. Therefore, consistency between theory and observation is independent of the cosmology one assumes.
The background intensities predicted for the WNM models are too high. Figures 3b and 3c depict backgrounds generated by the “Gal” and “SMC” dust models
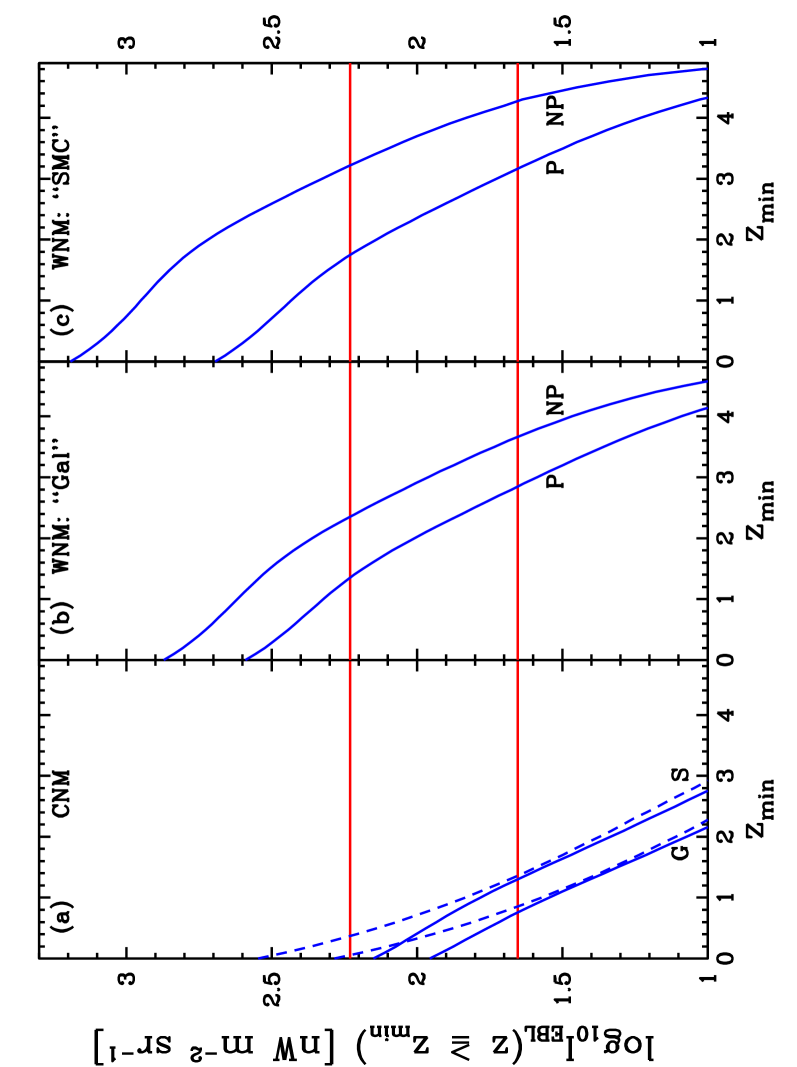
respectively. The curves labeled “P” correspond to the star formation histories generated by the solid curves in Figures 1b and 2b, where “P” indicates that optical pumping is included (where optical pumping is the mechanism by which the populations of the ground-term fine-structure states are mixed through UV excitations to higher lying levels [e.g. Sarazin et al. 1979]). The curves labeled “NP” show backgrounds generated by star-formation histories without optical pumping. As discussed in in Paper I the true WNM solution lies between these limits. The predicted background for the “Gal” model is between 2.5 and 5 times the 95 confidence upper limit on , and between 3 and 10 times this limit for the “SMC” model. In both models, sources with =1.6 generate background intensities exceeding the 95 confidence upper limit, indicating that DLAs in which C II∗ absorption arises in WNM gas produce more background radiation than observed. When the contribution of lower- galaxies is included, the observed upper limits to the backgrounds are exceeded by much larger factors. Had we computed backgrounds generated by the dashed curves in Figures 1b and 2b, we would reach the same conclusion; i.e., the WNM models are ruled out.
This disproof of the WNM-dominated solution appears to be robust. The FUV mean intensities inferred for 4 DLAs in which is detected (Ge & Bechtold 1997; Srianand et al. 2000; Molaro et al. 2002; Levshakov et al. 2002) are comparable to =1.7, the value found for the Galaxy ISM (Draine 1978; note is in convenient units of 10-19 ergs cm-2 s-1 Hz-1 sr-1). Although these results may need to be corrected for suppression of optical pumping (Sarazin et al. 1979), the implication is that is significantly lower than required by the WNM models. Furthermore, the backgrounds predicted for the WNM models are conservative lower limits. This is because we assumed the pressure of the two-phase medium, , to exceed , the maximum pressure allowed for gas in a pure WNM phase. Values of would result in lower values of , hence higher . Note, that high values of are predicted even if C II∗ absorption arises in warm gas with temperatures below that predicted by our two-phase model. We considered scenarios in which C II∗ absorption arises in gas with 1000 K; i.e., in thermally unstable gas like that predicted by Vazquez-Semadeni et al. (2000). Figure 3c in Paper I shows that at such temperatures the total cooling rate is considerably larger than the 158 m emission rate, especially in the absence of optical pumping. The resulting backgrounds are significantly above the 95 confidence upper limit on when the emission from 1 galaxies is added to the contribution from DLAs. Therefore, WNM models, or any model in which [C II] 158 m emission does not dominate the cooling rate, are unlikely to be correct.
By contrast, CNM models in which decreases with decreasing redshift are consistent with the background data. Consider models in which equals a constant given by the average of all the inferred values of for the CNM models. These are depicted by dashed curves in Figure 3a and correspond to the “Gal” () and “SMC” () star formation histories shown as dashed curves in Figures 1a and 2a. Both models predict to be above the 95 confidence upper limit on bolometric intensity. Moreover, Figures 1a and 2a show that at =0 is significantly above the comoving SFR inferred from the luminosities of local galaxies. On the other hand, the solid curves in Figure 1a and 2a depict model star formation histories that are compatible with inferred for galaxies at 1. These curves generate the backgrounds shown as solid curves in Figure 3a, which are compatible with the limits on . For these models at = 0 must be significantly below the 10-2.2 M determined at high redshifts both for “Gal” and “SMC” dust. At first, this appears to be inconsistent with the observation that deduced for local disk galaxies is comparable to 10-2.4 M (Kennicutt 1998). But the latter star formation estimates were made by averaging over the corrected de’Vaucouleurs’ radius, , whereas DLA absorption at any redshift would occur out to an average radius, 2 (Wolfe et al. 1986). However, to compute , it is necessary to average over , not . Therefore, the appropriate value of for local disk galaxies should be reduced by a factor of four to 10-3.0 M. We conclude that if DLAs evolve into normal galaxies, their SFR per unit area has decreased significantly since 1.6. We emphasize this conclusion holds for averaged over rather than , which is normally used for computing in nearby galaxies (Kennicutt 1998). 111When we compared the average in DLAs to the average for the ISM (Paper I), we found the ratio, ()DLA/()ISM roughly equaled the average dust-to-gas ratio of DLAs relative to that of the ISM, i.e. . This indicated in DLAs to be roughly equal to the ISM value, =1.7, which corresponds to =10-2.4 M. Does this contradict our finding that at =0 equals 10-3.0 M? The answer is no because the high opacity of dust in the ISM indicates arises mainly from local sources within the optical radius, whereas the lower opacity of dust in DLAs indicates inferred from C II∗ absorption lines is a global average, which includes the very low SFRs occurring outside the optical radius
2.3 Consensus Star Formation Model
By ruling out the WNM hypothesis, we have eliminated half the models discussed so far. Nevertheless, the remaining CNM models contain significant systematic uncertainties, as indicated by the scatter amongst inferred from the various dust hypotheses (Figures 1a, 2a). Here we attempt to assess these errors as well as errors due to other effects, and to deduce consensus values for .
To estimate the size of the systematic errors, we test the sensitivity of the CNM models to variations of crucial input parameters. We find to be sensitive to changes in equilibrium pressure, , and that the effect is similar in magnitude to the scatter in due to uncertainties in the composition and depletion level of dust. The results in Figures 1 and 2 were computed assuming = . Because of the uncertainties surrounding this criterion (see discussion in Paper I), we now consider the effects of letting vary between and . We find that decreases with increasing . As rises, increases, which results in lower values of for a fixed (see Figure 5 in Paper I). Therefore, is a minimum when =, and a maximum when =. We assume the variances in are determined by differences between these limiting values of and the means defined by =. It is possible to increase the variances in further by relaxing the standard ratio of cosmic-ray ionization rate, , to the SFR per unit area, , given in equation (9) in Paper I. But the consequent increase in is constrained by the upper limit on to log10 0.2 M, while the decrease is limited to log10 1.5 M by the observed ratios of C II to C I column densities, which become too small when / is more than twice the standard value (see 5.1). Though it is possible for to attain these extreme values, it is more likely to remain within the standard limits, which justifies their use in constructing the variances. Similar procedures were used to compute variances in due to variations in other input parameters such as the ratio of the radius to height, , of the model uniform disk (see Figure 4 in Paper I).
In order to compute consensus values of in a given redshift bin, we considered all four possible combinations of “Gal” versus “SMC” dust composition and minimal versus maximal depletion. For each of these four models we determined the probability distribution of using the best-fit value and an error budget that included (a) varying from to , (b) varying the aspect ratio between minimum and maximum values, and (c) the random errors appearing in Figures 1 and 2. Although we suspect that “SMC” dust and minimal depletion are more likely to be correct, we conservatively assumed that all four models were equally likely. We performed a Monte Carlo simulation drawing an equal number of simulated
data points from each of the four model probability distributions. Note that this is equivalent to a Monte Carlo simulation where each DLA is analyzed using all four models and then these 4 data points are resampled at random to generate the maximum possible variance. The resulting probability distribution for is well described by a Gaussian, and we computed the resulting mean, 68% confidence intervals, and 95% confidence intervals. There are additional systematic uncertainties that we are unable to quantify at present, including those due to uncertainties in the grain size distribution, and others that we are unable to compute such as possible radial variations in . We do not expect these additional sources of error to dominate. In particular, we show in 3.2 that the error due to our assumption of spatially uniform is probably less than 0.1 dex. The largest systematic uncertainty at present is produced primarily by the model with “Gal” dust composition and maximal depletion, so falsifying either the “Gal” or maximal depletion solutions would raise the result for and significantly reduce the uncertainty.
| log10 | ||
| M⊙yr-1Mpc-3 | ||
| Einstein deSittera | Standard b | |
| 2.15 | 0.580.42 | 0.680.42 |
| 3.70 | 0.590.35 | 0.710.35 |
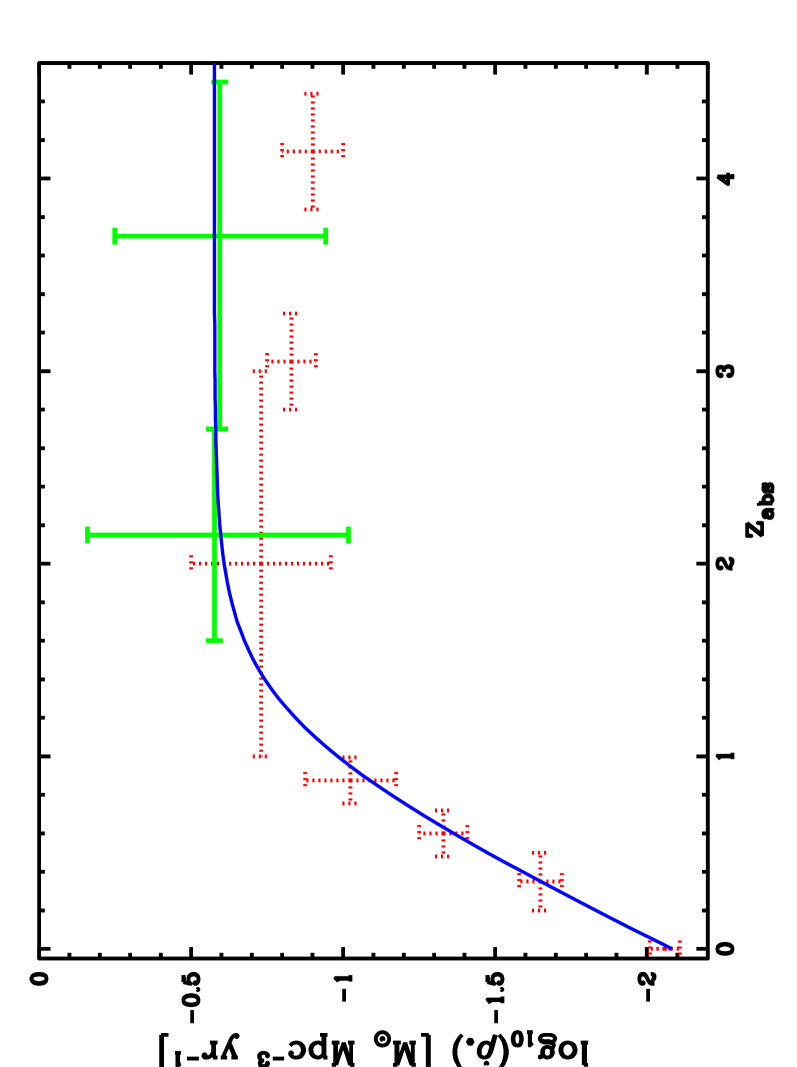
The consensus “Madau” diagram for DLAs is shown in Figure 4. The results are for the Einstein deSitter cosmology, and the interested reader is referred to Table 1 where we compare these with inferred for the standard cosmology; the differences are of order 0.1 dex. The error bars (corresponding to 68 confidence levels) are of course larger than in Figures 1 and 2, which include only random errors. Though our errors are larger than reported for the Lyman-Break galaxies, the latter errors do not include systematic errors such as extinction corrections to galaxy luminosities, which are surely present (see discussion in Steidel et al. 1999). By contrast the effects of dust are essential features of our models. Moreover the low values of imply that at least half of the radiation from the disk is emitted at rest-frame FUV wavelengths; i.e., our dust correction is less than a factor of 2. The blue curve is our eyeball fit through the DLA and low- galaxy data in this diagram and will be used in the following section to compute integrated quantities such as the mass in stars and metals produced over various time scales. Of course, it is possible that high- DLAs do not evolve into low- DLAs and their associated galaxies, but instead evolve into a population of objects with luminosity density far below that of normal galaxies. While we cannot rule out this scenario altogether, we believe it is implausible. The principal argument against it is the agreement between the comoving mass density of neutral gas in high- DLAs and the mass density of visible matter in current galaxies (Storrie-Lombardi & Wolfe 2000). This indicates a connection between DLAs at high redshift with those at low redshift, unless one assumes this agreement is a random coincidence. As a result, the most likely scenario is one in which decreases in time at 1.6 in such a way that the DLAs evolve into low- galaxies.
Figure 4 also shows consistency with inferred from gas consumption in DLAs (Pei et al. 1999), which lends credibility to the idea that the decline with time of the comoving density of neutral gas is related to star formation. Furthermore, Figure 4 indicates approximate agreement between determined for DLAs and LBGs. That measurements of the same quantity by independent techniques based on different physical considerations are even in approximate agreement is either a coincidence or indicates a connection between DLAs and LBGs. We shall address this issue in 6.
3 IMPLICATIONS
In this section we discuss several consequences of this work. In particular we discuss (a) the production of stars and metals implied by the derived , (b) a scenario in which star formation is confined to a centrally located bulge, and (c) evidence for feedback.
3.1 Baryon and Metal Production
Having determined for DLAs, we can integrate under the smooth curve in Figure 4 to obtain , the comoving mass density of stars at redshift . We find
| (7) |
where this expression for is independent of cosmology and Hubble constant when is determined from the C II∗ technique; i.e., from equation (4). Note that unlike , this integral receives considerable weight from
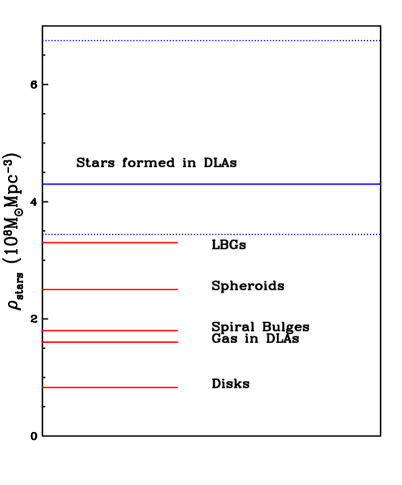
1.6. Pettini (1999) used the last equation to determine (0), the current mass density in stars formed by the LBGs. Our estimate of (0) for DLAs, which we obtain by integrating the last equation from =0 to , is shown in Figure 5 along with 68 confidence intervals. We compare this to determinations of the current mass densities of stars formed by LBGs and other stellar populations (Fukugita et al. 1998). In deriving this result we (a) integrated to the present under the solid curve shown in the figure, and (b) multiplied by Leitherer’s (1998) correction factor of 0.4 (adopted to correct for a more realistic IMF [see Pettini 1999]). Figure 5 shows DLAs and LBGs produce the same mass in stars to within 1 . Moreover, the star formation history of DLAs suffices to produce the observed stellar content of spheroids, bulges of spirals, and spiral disks. Though the indicated uncertainties in (0) are large, the similarity between the predicted stellar content of DLAs and observed stellar content of galaxies is consistent with the idea that their progenitors were DLAs (e.g. Wolfe 1995). In addition, the similarity between the comoving gas density in DLAs at 3 (Storrie-Lombardi & Wolfe 2000) and (0) is further evidence of self-consistency, though some infall might be required if the gas density is really lower than (0).
We also updated Pettini’s (1999) calculation for the mass of metals produced by = 2.5, the median redshift of DLAs for which metal abundances have been determined (Pettini et al. 1994; PW02). Pettini (1999) obtained this result using comoving SFRs for LBGs whereas we use comoving SFRs for DLAs. The result shown in Figure 6 was computed assuming =(1/42) (Madau et al. 1996), and is compared with the comoving density of
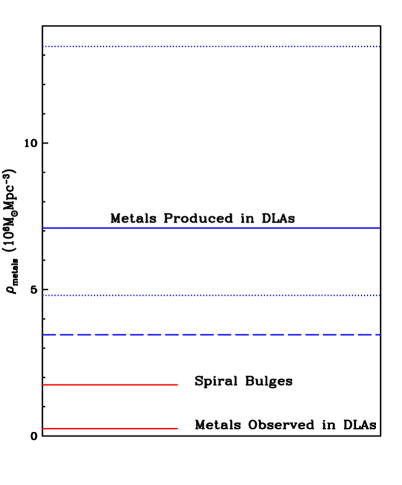
metals in = 2.5 DLAs and with the current mass density of metals in spiral bulges. Clearly the metals produced are sufficient to account for the metal content of spiral bulges. However, as discussed by Pettini (1999) the mass density of produced metals is 30 times higher than metals observed in DLAs. The difference is significant, since as shown in Figure 6, the observed metal content of DLAs is well below the 95 confidence contour predicted for the produced metal content. Therefore, the difference between observed and produced metal content is real and leads to a “missing metals” problem. Pettini (1999) first noticed this problem when he found that the metals produced in LBGs exceeded the metals measured in DLAs. The problem is much more severe in our case because we are measuring both metal production and metal content in the same population.
Three possible solutions to the missing metals problem are to sequester the metals produced away from the DLA gas observed at , either by confining these metals in “bulges”, in different systems, or in the IGM. The first solution requires that most of the star formation we are seeing is occurring in a compact region, i.e., a bulge, and metals produced in this region do not rapidly enrich the rest of the gas of the galaxy beyond the low metallicities observed in DLAs. The second solution requires that DLAs are a transitory phase early in the formation of galaxies, meaning that by the time significant metals have been produced the neutral gas has already been used up. Hence the objects observed as DLAs at are entirely distinct from objects that follow the DLA star formation history starting at formation redshifts . The third solution solution is to allow the metal-enriched material of supernovae to blow out of the DLA galaxy (Mac Low & Ferrara 1999). We see two problems with blow out. First, the efficiency of ejecting metal-enriched gas must exceed 1(29/30)=0.97, which is much larger than the maximum efficiency of 0.5 seen in local starburst galaxies (Martin 2003). Second, such ejection would result in a mean IGM metallicity, [M/H]=1.2, which is at least two orders of magnitude larger than the metallicity of the Ly forest (Songaila 2001); this would require placing most of the metals in the highz IGM in some undetectable state. In the next subsection we shall explore the solution we find most appealing, the bulge hypothesis. Other possible explanations include changing the IMF from that assumed by Pettini (1999) (which is the same Madau et al. [1996] IMF used in our previous computations) so that lower masses of metals are released at the endpoints of stellar evolution.
3.2 Bulge Hypothesis
Suppose star formation is concentrated in the central regions of DLAs, e.g., in proto-bulges, which at early times could be configurations of molecular clouds that are rarely detected in DLAs because of a small covering factor or possible obscuration by dust. In that case most of the metals would be released in the bulge, which would explain why the mass of metals produced in DLAs is consistent with the mass of metals in spiral bulges within the errors, as shown in Figure 6. The Milky Way bulge is relevant since it is a metal-rich but old population of stars most of which formed by = 2.5 (Wyse et al. 1997). In this picture a small fraction of the metals produced would find their way to the outer disk via stellar winds or supernovae explosions, thereby explaining the lower metallicities of the DLA gas. This idea is self-consistent since, as we now show, the higher star formation rate per unit area in the central region can account for the heating rates inferred from the C II∗ observations of the outer disk without significantly increasing .
For simplicity, let the bulge be a sphere with radius , which is located at the center of a uniform disk with radius and half-thickness . In this scenario the disk gives rise to damped Ly and C II∗ absorption, while FUV radiation emitted by the bulge is the source of the mean intensity at radius , , which heats the gas through grain photoelectric emission. In that case the mean intensity is given by
| (8) |
where , is the Luminosity per unit frequency bandwidth of FUV starlight emitted by the bulge, and is the absorption opacity due to dust in the uniform disk.
The radiation intensity inferred from DLAs by our method represents an average over all possible lines of sight through these uniform disks, where the C II* column determined for each system represents the average of all gas along that particular line of sight. We approximate this “average of averages” as a simple average of the radiation intensity received at all points in the disk, i.e.
| (9) |
with , , and where we have assumed , which seems reasonable for the thick disks expected at high redshift. Except for the limit, this expression is equivalent to the solution for obtained for uniform disks (see eq. 14 in Paper I) since the luminosity density of such disks, =/(2). This occurs because of the symmetry between the flux received at the center of a uniform disk from all points within the disk and the average flux received over a uniform disk from a bulge located at its center. When integrated, the solution looks just like that of equation 15 in Paper I except that the 1 is replaced by , which will be very close to 1 given that the entire disk is nearly optically thin (the bulge of course is likely to be optically thick and have a different value of , but our observations are sensitive to the FUV photons that successfully escape from the bulge region so this does not affect the results). If /() is the same for the bulge and disk models, the expected values of radiation intensity are equal to an accuracy within 10 , i.e. where is the mean intensity computed for disks with a uniform distribution of sources in equation (14) in Paper I. Since these two models represent extremes of the source distribution (uniform versus central source) we expect any intermediate source distributions to lead to similar values of radiation intensity. This is important since hierarchical structure formation implies that a given DLA could receive radiation from several compact regions of active star formation rather than a single central bulge. Because the SFRs per unit comoving volume for bulges or disks are given by
| (10) |
the bulge-to-disk ratio ()B/()D=
/. Comparison between equations
14 in Paper I and equation (9)
in this paper shows this ratio
equals the product of
/ and the
ratio of the dimensionless integrals in both equations.
To compare bulge and disk SFRs we assume that
= so that both models generate the
observed heating rate. Because the
dimensionless integrals
are identical to within 10, we find that ()B
()D.
As a result the estimates of deduced for star formation throughout uniform disks do not change significantly when star formation is confined to the centers of such disks. Therefore, our estimates of for disks do not appear to be very sensitive to the radial distribution of the sources of FUV radiation provided the disks are optically thin to such radiation. Though the disks are likely to be optically thin, we cannot rule out the presence of optically thick dust in the bulge, which attenuates some fraction of the FUV radiation emitted by the stars. In that case the expression for ()B is found by equating for the disk and bulge models and the resulting ()B would be a lower limit to the actual SFR per unit comoving volume. Since we can increase (1.6) inferred for the consensus model, i.e., inferred from FUV heating, by a factor of 3.3 before the background is violated, the radiation attenuated in the bulge model can be as much as a factor of 2.3 times that observed; i.e., as much as 0.7 of the total FUV radiation can be attenuated.
We can also use the bulge model to compute the total SFRs, , required to explain the observed C II∗ heating rates. From equation (8) we find that = 1.9 yr-1, where we used the Madau et al. (1996) calibration to convert to . Assuming = 6.8, the average of the positive detections for the “Gal” minimal depletion model, we have =13 yr-1. If we let equal 10 kpc, a typical impact parameter, we find that is consistent with upper limits obtained from H imaging of 7 DLAs by Bunker et al. (2001). On the other hand this SFR is about 3 times higher than the more sensitive NICMOS upper limits reported by Kulkarni et al. (2001) for the DLA toward Q124434. Unfortunately we do not have C II∗ 1335.7 profiles of this DLA. Future searches for emission from DLAs with detected C II∗ absorption may prove to be sensitive tests of the bulge hypothesis. These tests will be less sensitive for the uniform disk models, where the predicted surface brightnesses are low. In any case the limits on for the bulge hypothesis place severe constraints on rotating disk models in which 20 kpc is required (PW97), since for the central bulge will be higher than observational constraints allow.
3.3 Search for Evidence of Star Formation and Feedback
Stars leave imprints on the gas from which they form, and this
may be detectable in DLAs. In the uniform disk scenario
a correlation should exist between and
(H I) resembling
the Kennicutt relation found in nearby disk galaxies
(Kennicutt 1998).
This is a manifestation of the condensation of gas
into stars, since it is equivalent to the Jeans
instability criterion in rotating disks (Toomre 1964).
Stars also deposit
energy and other byproducts of stellar evolution into
the gas, and so one might expect to find evidence of
feedback if the uniform disk scenario is correct.
This would occur through shocks
generated by supernova explosions. Because of the short main sequence
lifetimes of the progenitor stars, feedback is directly related to
the SFR. By contrast, in the bulge scenario
the connection between stars and
DLA gas may (a) not exist or (b) be indirect.
We test these ideas with SFRs derived from the CNM model with “Gal”
dust and minimal depletion.
The results of this investigation are
statistically indistinguishable from those of “Gal” dust with maximal
depletion, and “SMC” dust with maximal or minimal depletion.
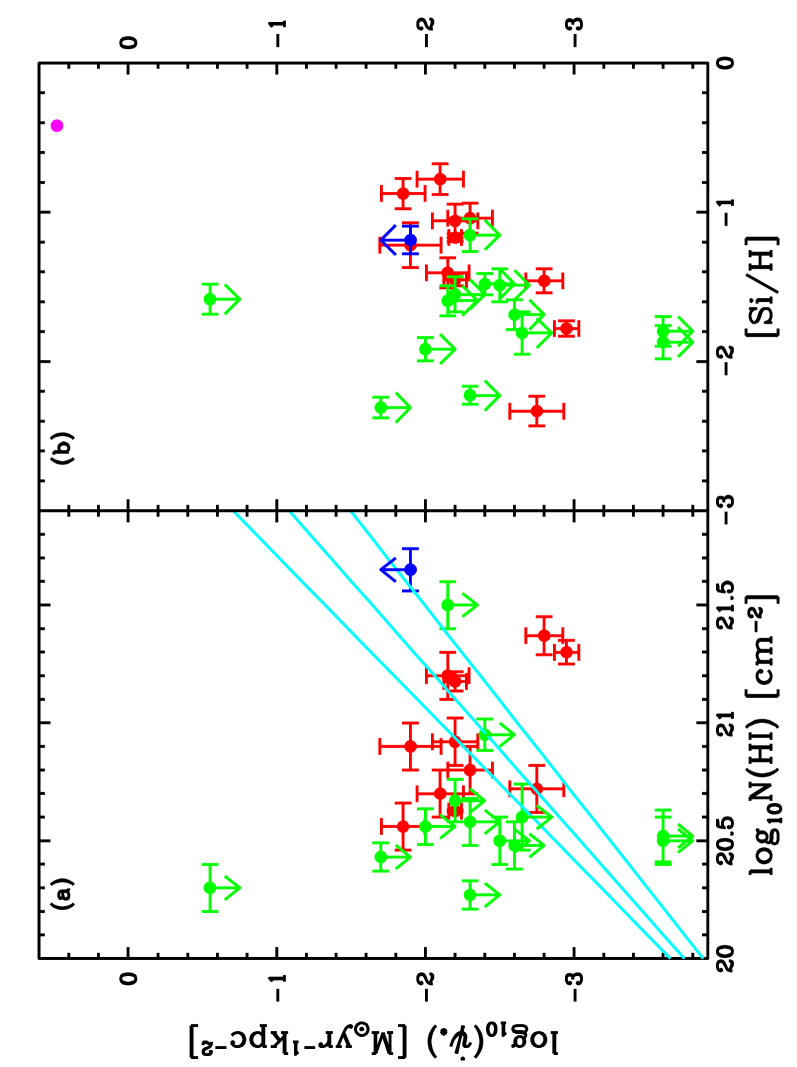
The test of the Kennicutt relation is shown in Figure
7a where we plot
((H I), ) pairs for DLAs along with the 1-
contours of the Kennicutt
relation.222Although the total H column density
is used for nearby galaxies,
(H I) is adequate for DLAs where
the molecular content of the gas is low (Petitjean et al. 2002);
Ledoux et al. 2002
Clearly the DLAs show no evidence for a Kennicutt relation. Specifically,
a Kendall test using only positive
detections reveals = 0.25 and
the probability that the null hypothesis of no correlation is correct is
=0.28. This conclusion differs
from
the findings of Lanzetta et al. (2002) who
used the Kennicutt relation to deduce the SFR intensity distribution
as a function of SFR per unit area from the frequency distribution
of H I column densities in DLAs.
They
found
excellent agreement with the intensity distribution deduced directly from galaxy brightnesses. In that case is deduced from emission from pixels with linear dimension of 0.2 kpc. By contrast, the H I column densities in DLAs are sampled over transverse distances determined by the linear scale of the continuum source in QSOs, which is typically less than 1 pc. As a result, the agreement between column density measurements on small scales with SFRs per unit area on larger scales indicates that on average the Kennicutt relation for nearby galaxies holds in high- DLAs (Lanzetta et al. 2002).
The reasons why the points in Figure 7a display so much scatter about the Kennicutt relation are straightforward. First, if star formation occurs in the DLA gas, inferred from the C II∗ technique is averaged over the linear dimensions of the DLA, which exceed 5 kpc in any model (e.g. Haehnelt et al. 1998). Because (H I) likely varies on scales smaller than 5 kpc, correlations between ((H I),) pairs are not expected. Second, in the bulge model, star formation does not occur in the gas giving rise to damped Ly absorption. As a result no correlations between ((H I),) pairs are predicted. However, it may be possible to distinguish between the two models with a sufficiently large data set. If star formation occurs in the DLA gas, (H I) averaged over the DLA sample should correspond to (H I) averaged across a typical DLA, and therefore the sample averages of (H I) and should obey the Kennicutt relation. On the other hand, no such correlation is predicted for the bulge model. Interestingly, the averages over the positive detections in Figure 7a result in =6.410-3 M and =1.01021 cm-2, which are within 1 of the
average Kennicutt relation. In the bulge model this is merely a coincidence.
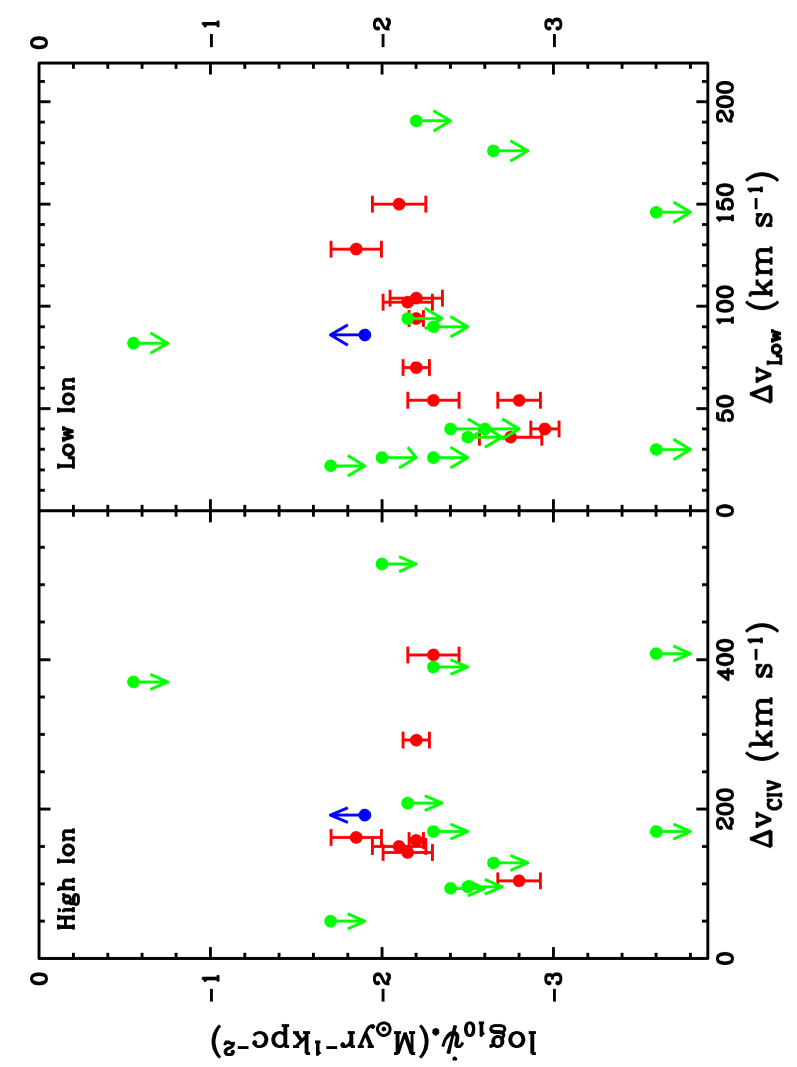
To search for evidence of feedback, we first looked for correlations between SFR per unit area and metallicity. Nearby spirals exhibit negative radial gradients in metallicity (Garnett et al. 1997) and in SFR per unit area (Dopita & Ryder 1994), implying a correlation between metallicity and SFR per unit area. Such metallicity gradients may have also been detected in DLAs (Wolfe & Prochaska 1998). We used ([Si/H], ) pairs to search for such correlations. The results shown in Figure 7b yield tentative evidence for a correlation since =0.46 and =0.05, where again we used only positive detections. We then focused on kinematic evidence for feedback. In the ISM, enhancements in velocity width are found in regions of higher than average SFRs such as Orion (Cowie et al. 1979) and Carina (Walborn et al. 1998; Savage et al. 2001). Evidently, gas in these regions is stirred up by increased supernova activity. We tested for kinematic feedback by looking for correlations between absorption-line velocity width and . Specifically, we checked for kinematic feedback in the neutral gas by searching for correlations between (, ) pairs, where is the velocity width of low ions in DLAs (Prochaska & Wolfe 1997; hereafter PW97). We also checked for kinematic feedback in the ionized gas by searching for correlations between (,) pairs, where is the velocity width of the C IV 1550 transition. The results using only positive detections are shown in Figure 8a and reveal no evidence for correlations in the ionized gas, since =0.97 and =0.76. But Figure 8b does reveal possible evidence for kinematic correlations in the neutral gas, since =0.77 and =0.002.
The reasons for null correlations in the case of feedback are the same as discussed above. Namely, no correlations are expected for the bulge hypothesis because star formation occurs in regions disconnected from the absorbing gas used to infer metallicity and kinematics. In the disk model, is averaged over linear scales large compared to the l pc transverse dimensions sampled in absorption. Therefore, in this model the null correlation between and indicates significant random variations in high-ion velocities on linear scales small compared to the length scale of the star forming regions in DLAs. Because it is reasonable to expect similar variations in the case of low-ion velocities, how can we understand a correlation between the (, ) pairs, if confirmed? The answer may be that has global rather than local significance. Specifically, may reflect the depth of the gravitational potential well of the DLA, as predicted in the case of rotating disks (PW97) or protogalactic clumps (Haehnelt et al. 1998); i.e., the SFR per unit area may be correlated with total mass. Note, this explanation would apply both to the uniform disk and bulge models. A similar explanation might also apply if the tentative correlation between ([Si/H],) pairs is confirmed; namely, that the metallicity of the gas does not vary randomly on scales small compared to scale of the galaxy hosting the DLA. Rather, metallicity might be a function of total mass, as in the case of current galaxies.
Of course all these results need to be tested with more data. In particular, the statistical significance of the correlation between and would be reduced if the two upper limits with 150 km s-1 were added to the sample of positive detections. On the other hand, the two DLAs with log103.6 M are the “outliers” discussed in Paper I. These are more likely to be WNM-dominated absorbers with significantly higher values of , in agreement with the predicted correlations.
4 TESTS OF THE MODELS
Having presented evidence for star formation in DLAs, and having the described the implications of the derived star formation histories, we now discuss three tests of the models upon which these results are based. The first is a test for the grain photoelectric heating mechanism, the second tests the hypothesis that is a cooling rate, and the third describes a search for evidence of a two-phase medium.
4.1 Evidence For Grain Photoelectric Heating
A critical premise of the C II∗ technique is that neutral gas in DLAs is heated by photoelectrons ejected from interstellar grains by FUV radiation emitted by massive stars. In that case the heating rate per H atom, . The efficiency of grain photoelectric heating, , is essentially constant as it is insensitive to variations in electron density, temperature, and FUV radiation field in the CNM. Moreover, the scatter in is limited such that the average log10=2.19 M. Therefore, a prediction of the grain photoelectric heating scenario is that should be roughly correlated with the dust-to-gas ratio, .
We test the grain photoelectric heating hypothesis by letting = (which is an excellent approximation in the CNM) and then compare with . The two quantites are plotted against each other in Figure 9. The red data points are positive detections, green are upper limits, and blue is a lower limit. The solid curves are lines of constant predicted by a version of the CNM model with a fixed redshift and a given prescription for computing from metallicity. That is, for a given metallicity and we calculate two-phase equilibria of gas subjected to grain photoelectric heating and assume the DLA density to be given by the computed . We include the CMB contribution to radiative excitations of the [C II] fine-structure states by assuming = 2.8, the median redshift of the sample, and ignore optical pumping (which should lead to no loss in generality since optical pumping is negligible in the CNM). To calculate we adopt the CNM “Gal” model with minimal depletion. As a result we let the intrinsic carbon abundance, [C/H]int=[Si/H]int[Fe/Si]int and [Fe/Si]int = 0.2. We also assume [Fe/Si]gas=0.4, which is the average value for our sample. We then compute with techniques described in Paper I. Visual inspection of Figure 9 indicates several phenomena. First, the measured and are correlated. Specifically, performing the Kendall tau test using the positive detections alone we find =0.64 and =0.0064, where is the probability of the null hypothesis of no correlation. Second, the slope of the data in the (, ) plane is approximately parallel to the model predictions, and all the positive detections are bounded by log10 = 2 and 3 M. Third, the case for correlation receives additional support from the location of the upper limits at low dust-to-gas ratios, i.e., log10 2.2, and the lower limit at the relatively high dust-to-gas ratio, log10 1.6.
Can the correlation between and be explained by heating mechanisms other than grain photoelectric heating? The obvious alternatives are cosmic-ray and X-ray heating. Suppose the actual SFRs are orders of magnitude lower than we infer for grain photoelectric heating, but the cosmic-ray ionization rate, , is large; i.e., the ratio / is orders of magnitude larger than given in equation (9) in Paper I. In that case it is possible for the cosmic-ray heating rate, , to dominate the heating rate in the CNM. During ionization by cosmic rays, primary and secondary electrons are mainly liberated from H and He (W95). As a result, will be independent of metal abundance, hence independent of . Since we have linked , hence , to the SFR, and when cosmic rays dominate, will be independent of for a fixed , in contrast to grain photo-electric heating.
On the other hand, the X-ray heating rate could depend on metallicity, hence on , since abundant heavy elements dominate the X-ray photoionization cross-section per H atom at photon energies above the Oxygen edge at 0.53 keV (Morrison & McCammon 1983). We used the X-ray heating model of W95, which consists of two local thermal sources with 106 K and an extragalactic power-law component. Heating by the thermal sources is dominated by photoionization of H and He since their X-ray spectra cutoff below 0.53 keV. Although the power-law component extends to energies above the Oxygen edge, X-ray heating in this case will also be dominated by photoionization of H and He. The reason is that for typical velocity-component column densities, (H I) 11020 cm-2, most of the X-rays penetrating the H I gas have energies below 0.53 keV. Photoionization of H and He by these X-rays dominates photoionization of heavy elements by higher energy X-rays due to the low metallicities of most DLAs and the shape of the power-law spectrum. Thus, photoionization of heavy elements will not be the dominant source of primary electrons. Consequently, while the condition might hold in the limit of low SFRs and high X-ray luminosities, will be independent of for a fixed .
To conclude, the correlation between and is naturally explained by grain photoelectric heating. The correlation at a fixed SFR follows from the physics of grain photoelectric heating, while the scatter of at fixed reflects the frequency distribution of . Note, this correlation does not distinguish between the uniform disk and bulge models. Because the heating rate is the product of a “global” quantity, , and a “local” quantity, , clouds with larger will have higher heating rates independent of whether the incident FUV radiation arises locally or from the distant bulge. By contrast, neither the cosmic-ray nor X-ray heating rates are correlated with at fixed SFR. To explain the observed correlation, one must postulate a correlation between and (or possibly metallicity). It is difficult to understand the origins of a correlation between the “global” and the “local” dust-to-gas ratio in this case.
4.2 Is C II∗ Excitation Due to the CMB?
Our models predict that in the CNM of most DLAs the cooling rate, , equals the spontaneous emission rate of 158 m radiation, . This condition, , holds when the and fine-structure states in the ground term of C+ are populated by collisional rather than
radiative excitations. In Paper I we described how CMB radiation populates these states directly, and how the FUV radiation field, , populates them indirectly through optical pumping via higher energy states. While optical pumping is important in the WNM, it can be neglected in the CNM. Although an increase in drives up the pumping rate, it also increases the collisional excitation rate. This is because an increase in , and thus , increases the grain photoelectric heating rate, which raises the CNM density, , as shown in Figure 5 in Paper I. As a result, the ratio of collisional to optical pumping rates always exceeds unity in the CNM. 333Although the density of the WNM, , also increases with , the densities are not high enough for collisions to dominate optical pumping in most cases. This need not be true for the ratio of collisional to CMB excitation rates because the CMB does not heat the CNM gas (through Compton heating) in the redshift range of our sample DLAs. Because the value of does not rise with increasing CMB intensity, the CMB may dominate collisions as a source of excitation in DLAs with low values of and high redshifts where the CMB intensity is high.
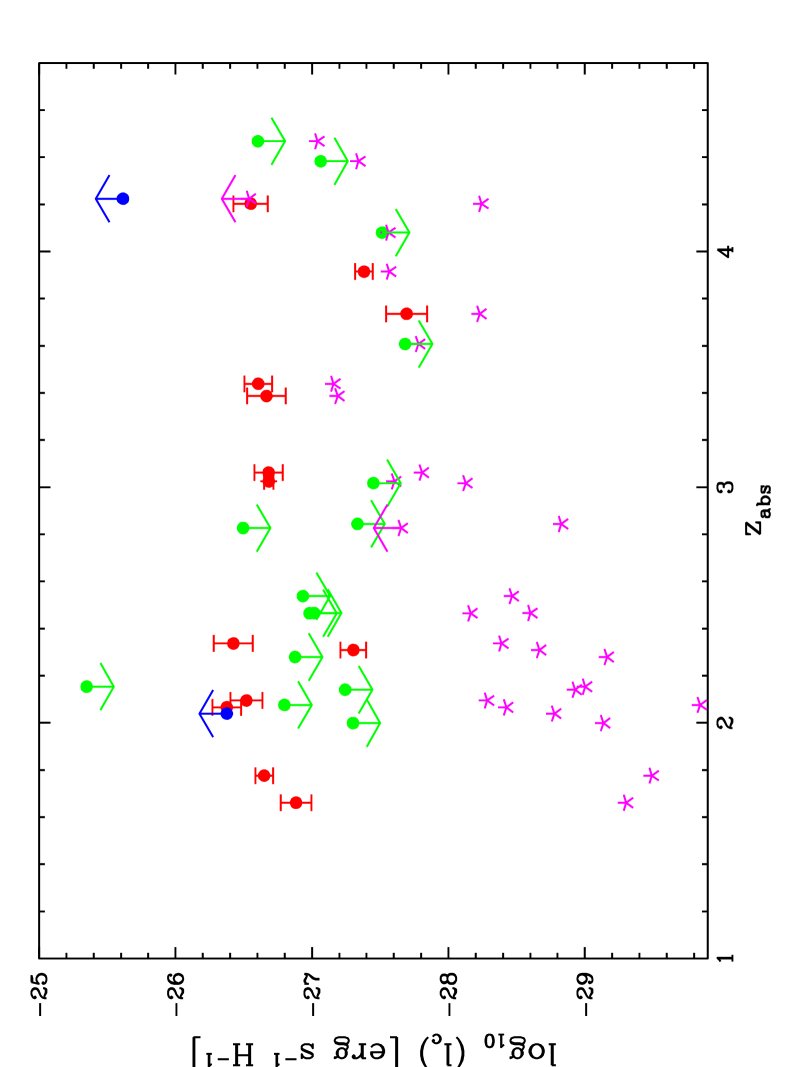
Because the balance between collisional and CMB excitations depends on various assumptions included in our models, it is important to assess their relative importance with model-independent tests. Figure 10 illustrates the results of a test relying on one free parameter, the carbon abundance, (C/H). Here we plot , inferred from measurements of (C II∗), versus redshift for a sample of 30 DLAs. For each DLA we also plot, as magenta stars, ()CMB versus redshift where ()CMB is the value assumed by when the CMB is the only source of excitation and de-excitation (in Paper I we showed that , where the present CMB temperature, =2.728 K. Twenty five of the DLAs are drawn from the minimal depletion sample. Here we calculate ()CMB by assuming [C/H]=[Si/H]0.2 to compute (C/H). The plot also shows data for 5 additional DLAs. They include the DLAs toward Q020111 and Q234412 for which we assumed maximal depletion to obtain (C/H) because [Fe/Si] 0.2 in both DLAs. We also included the DLAs toward Q095104, Q142560, and Q144327 for which we assumed [C/H]=[Si/H]0.2. These objects were excluded from the original minimal depletion sample because observational limits on [Si/H] or [Fe/H] prevented us from computing the dust-to-gas ratio, , which is not needed to compute ()CMB. The figure demonstrates that the CMB cannot explain the observed level of C II∗ excitation for the following reasons: First, despite the dispersion in carbon abundance, ()CMB should increase rapidly with increasing redshift whereas the observed values of show no dependence on redshift in the interval = [1.6, 4.5]. Second, with two exceptions, the CMB excitation rate is too low to explain the observations. This is true even at 3 where the predicted values of ()CMB merge with the observed spontaneous emission rates.
The exceptions are the DLAs at =3.608 and =4.080 toward Q110807 and Q223706, the “outliers” discussed in Paper I. In these DLAs, ()CMB comprises a significantly higher fraction ( 0.8) of than for the other DLAs. Because the ’s are upper limits, the data place lower than usual upper limits on the [C II] 158 m cooling rates. We interpreted this to mean that these sightlines pass only through WNM gas subjected to SFRs within the range determined from the CNM hypothesis. However, we cannot rule out the possibility that the gas is subjected to negligible SFRs, which lead to gas densities so low that collisional excitations are unimportant. In that event, CMB excitation alone would be responsible for the observed . To decide between these hypotheses, we need to measure and ()CMB more accurately. Though can be determined more precisely through better measurements of the C II∗ 1335.7 velocity profiles, higher signal-to-noise will not improve the accuracy of ()CMB where the only source of error is in determining (C/H). The carbon abundance is difficult to obtain directly because the principal C II transitions are always saturated (e.g. Dessauges-Zavadsky et al. 2001). Instead we compute ()CMB with the minimal depletion assumption, [C/H]=[Si/H][Fe/Si]int and [Fe/Si]int=0.2, for 28 of the 30 data points shown in Figure 11. For the remaining 2 DLAs, [Fe/Si]gas 0.2, which violates the nucleosynthetic ceiling limit in the minimal depletion model, and we thus assume [Fe/Si]int=0; i.e., maximal depletion. We favor minimal depletion for most DLAs because it leads to self-consistent determinations of ()CMB, whereas maximal depletion leads to the inconsistent condition ()CMB for the Q110807 and Q223706 DLAs. In any case the limited accuracy for determining (C/H) results in errors in ()CMB of order 0.2 dex, which is inadequate for distinguishing collisional excitation from CMB excitation.
In our treatment of CMB excitations of the C II fine-structure states we assume the CMB temperature at redshift, , , whereas most published
| Q123208 | Q034738 | |||
|---|---|---|---|---|
| Parameter | Estimatea | CNM Modelb | Estimatec | CNM Modelb |
| (cm-3) | 20335 | 714 | 414 | 36 |
| (K) | 85285 | 130188 | 950d | 130200 |
| (cm-3) | 0.02 | 0.0020.03 | … | 0.0020.014 |
| 1.7e | 6.021.5 | 1.7e | 2.711.0 | |
test this assumption by attempting to measure directly. In principle this can be done by first making independent estimates of the collisional contribution to the level populations of the and fine-structure states, and then computing the black-body temperature required to explain the observed population ratio (e.g. Molaro et al. 2001). Accurate UVES echelle spectra were acquired by the VLT for two DLAs in our sample; Q034738 (Levshakov et al. 2001; Molaro et al. 2001) and Q123208 (Srianand et al. 2000). In Table 2 we compare physical parameters obtained by these authors with predictions of our CNM models. The estimates are independent of our predictions because physical models of the DLA gas were not constructed. Rather techniques such as measuring velocity line widths to estimate the kinetic temperature or inferring from the fractional abundance of H2 were used. In some cases relative abundances of various rotational levels of H2 were used to infer the temperature, and the ratio Mg+/Mg0 was combined with and photoionization equilibrium to obtain . The results in Table 2 show, with the possible exception of , reasonable agreement between our predictions and these estimates. They are also inconsistent with the WNM hypothesis for both DLAs.
4.3 Ratios of C II∗ to Resonance-line Velocity Profiles: Probing the Two-Phase Medium
Here we discuss an observational test of the two-phase medium, a key element in our models of DLAs. We describe various aspects of the test and leave more quantitative analyses for future discussions. Note, Lane et al. (2000) provide independent evidence for a two-phase medium from their analysis of 21 cm absorption in a DLA with = 0.0912.
Suppose, by analogy with the ISM, the probabilities that the line of sight intercepts WNM and CNM clouds are comparable (Kulkarni & Heiles 1987). If velocity components (i.e., clouds) in each phase have comparable H I column densities and the same element abundances, then a random sightline through a typical DLA should encounter similar column densities of metals in each phase. This can lead to measurable differences between the velocity profiles of C II∗ 1335.7 and resonance transitions such as Si II 1808.0, as we now show.
Consider a two-phase configuration in which the
fractions and of the total (H I) are in the
CNM and WNM, where =1.
Assume the systemic cloud velocities to be and , and the
internal Gaussian velocity dispersions to be
and . In that case
the optical depths at velocity
in
C II∗ 1335.7 and Si II 1808.0 are given by:
| (11) |
where we used equation (3) in Paper I to compute
(C II∗),
the ’s
and ’s are oscillator strengths
and
transition wavelengths,
()CNM and ()WNM are in the CNM and WNM,
() is the velocity profile normalized such
that =1,
and (Si/H) is the Si abundance.
To compute ()CNM and ()WNM, we evaluate at the phase densities and . Equation (11) in Paper I shows that where is the net loss of thermal energy due to 158 m emission and ()pump and ()CMB are the spontaneous energy emission rates in the limits of pure optical pumping and CMB excitation, which are defined in equation (12) in Paper I. At the high values of , the fine-structure states are mainly populated by collisions and as a result equals the cooling rate , which equals the grain photoelectric heating rate in the CNM; i.e.,
| (12) |
But at the
low values of any one of the of the 3 terms
in the above equation for can dominate. For example
()WNM()CMB
in the =3.736 DLA toward Q134603 for the CNM solution in which
=1.95. By contrast
()WNM()pump
in the =2.039 DLA toward Q045802 for the CNM solution in which
13.5 (see Figure 5 in Paper I). Without
optical pumping,
()WNM
if the
metallicity is low and observed is high. In this case
does not equal because [C II] emission
is not the dominant coolant.
If ()WNM is governed
by optical pumping,
the ratio ()WNM/()CNM
is rather well determined because the quantities
and are both proportional
to the radiation intensity and to metallicity.
Combining the last equation with
equations (1) and (7) in Paper I
and assuming [C/H]gas=[Si/H][Fe/Si]int
we find
| (13) |
where , the optical pumping rate corresponding to the Draine (1978) radiation field, equals 1.5710-10 s-1 (Silva & Viegas 2002), and is the heating efficiency in the CNM. In deriving the last equation we assume the pumping rate corresponding to intensity is given by ()=(/1.7). Averaging over the positive detections in the “Gal” minimal depletion model we find the average ratio ()WNM/()CNM =0.0970.020 with optical pumping and ()WNM/()CNM =0.0670.011 without pumping. As a result, equation (11) implies the WNM is undetectable in C II∗ 1335.7 for any value of , but is detectable in resonance transitions such as Si II 1808.0 for 0.1. Consequently, a significant decrease in (C II∗)/(Si II) from the mean would signify the presence of the WNM.
Such variations may have been detected in the DLA toward Q034738. Though Figure 11a shows clear evidence for distinct velocity components at =8 km s-1 and =12 km s-1 in Si II 1808 and Fe II 1608, the =8 km s-1 component is not seen in C II∗ 1335.7. Rather, an asymmetric blue wing extends from =12 km s-1 to =20 kms. Because some of this absorption is due to weak C II∗ 1335.66 (/=0.11), the observed optical depth of the wing places an upper limit on (C II∗ 1335.71). Therefore, we conjecture that the =8 km s-1 component consists of WNM gas, while the =12 km s-1 component consists of CNM gas. The presence of H2 absorption only at =12 km s-1 and the lower S+/N0 ratio in this component (Levshakov et al. 2002) supports this interpretation. Notice that the relative optical depths of these two components in Fe II 1608 is different than in Si II 1808. The most likely explanation is enhanced Fe depletion in the =12 km s-1 component. This does not affect our interpretation of the C II∗ profile because enhanced depletion at =12 km s-1 cannot explain the weakness of C II∗ 1335.7 at =8 km s-1 . In any case the significant decrease in the ratio, (C II∗)/(SiII), with decreasing velocity shown in panel 4 of Figure 11a is naturally explained by the presence of WNM gas at negative velocities.
Figure 11b compares C II∗ and resonance-line profiles for the DLA toward Q010013 (PHL 957). By contrast with Figure 11a, the C II∗ profile in this case closely resembles the Si II 1808 and Ni II 1741 profiles. The only
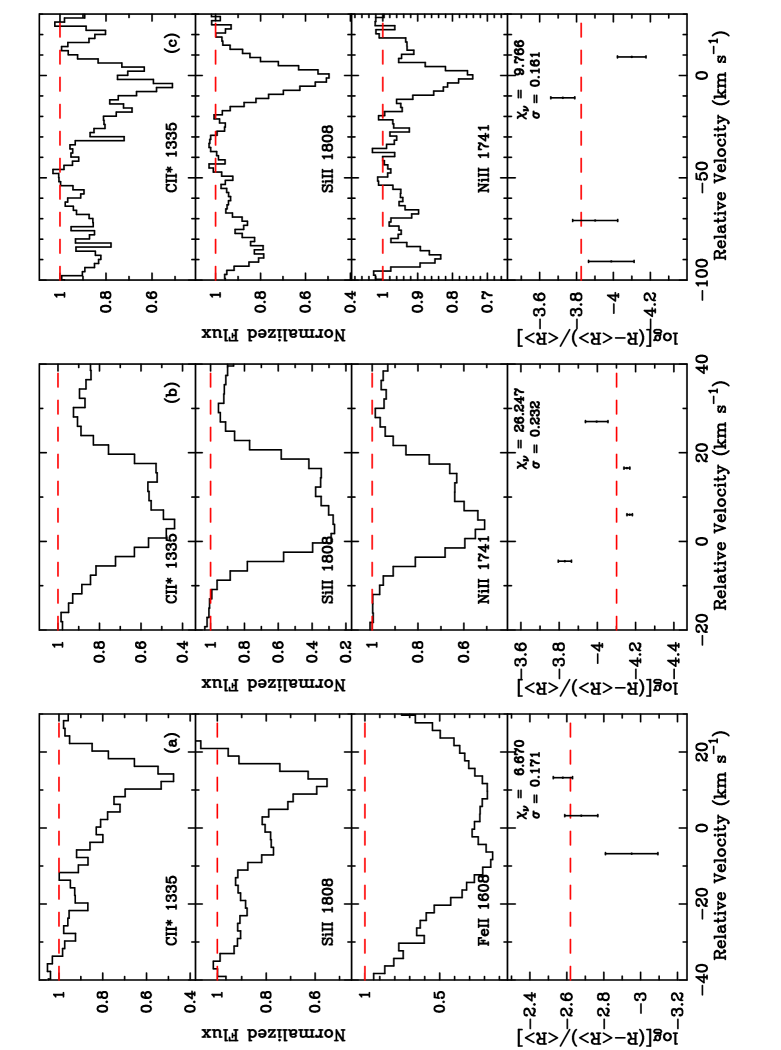
significant difference
is at 8 km s-1 where C II∗ 1335.71 exhibits a blue
asymmetric wing that is missing from Si II 1808 and Ni II 1741.
We believe this is a blend with
weak = 0 absorption in C II∗ 1335.66. Because we ignore the
increased C II∗ absorption at 30 km s-1 , which is
likely to be a blend with Ly forest absorption lines,
we find no compelling evidence for a WNM
in this DLA. However, this does not rule out the presence
of a WNM. Suppose the velocity components
at 3 km s-1 and 15 km s-1
each contain WNM and CNM gas with the same velocity dispersion. From
equation (11) we see the ratio
will not vary with . But, in a
scenario where the multi-phase structure resembles that of the ISM,
the Si II velocity profiles would be wider than
the C II∗ profile, since
2 in
the ISM (Kulkarni & Heiles 1987).
In principle this is a signature of the WNM.
But differences between the observed profiles will be diluted
by the finite resolution of HIRES (FWHM78 km s-1 ),
which is comparable to the widths of most components (i.e., they
are unresolved), and Poisson noise. A detailed evaluation
of these effects will be discussed elsewhere.
Figure 11c compares C II∗ and resonance-line profiles for the DLA
toward Q223100. Though the profiles are noisier in this case,
some effects are clear. First, the ratio does not exhibit
significant variations at 60 km s-1 .
On the other hand, there is evidence for variations of
in the component centered at = 0
km s-1 . At
10 km s-1 , is lower than , the mean
integrated over the entire profile (see panel 4 of Fig. 12c).
This is consistent with WNM gas at
10 km s-1 . At the same time, there is tentative evidence for
enhanced C II∗ absorption between 30 km s-1
and 10 km s-1
where C II∗ 1335.71 exhibits stronger absorption
than either Si II 1808
or Ni II 1741. While
weak
C II∗ 1335.66 absorption at 0 km s-1
may cause
the excess C II∗ 1335.71 absorption at 10 km s-1
it cannot explain the excess C II∗ 1335.71 absorption at
10 km s-1 .
Excess C II∗ absorption can be due to increased heating of the CNM. In the case of absorption by CNM gas alone we have
| (14) |
where we combined the definition of (equation 1 in Paper I) and equation (12). Detectable variations in in CNM gas are most likely caused by variations in and rather than in absolute element abundances. This is because
| (15) |
and the recent analysis by Prochaska (2002) showed evidence for remarkable uniformity in the relative abundances of DLAs (with the exception of the DLA toward Q034738). As a result,
| (16) |
where =[-]/, and and are the grain photoelectric heating efficiency and FUV mean intensity at velocity . Because is a function of (Bakes & Tielens 1994; Weingartner & Draine 2001a), will vary with if any one of these parameters changes with . If 5103 K1/2cm3, the grains are mainly neutral and is insensitive to variation in . Therefore, in this CNM limit, . The excess C II∗ absorption in the Q223100 DLA can then result from the incidence of a larger-than-average radiation intensity, , on the CNM gas in the velocity range = 30 to 10 km s-1 . Spatial variations in radiation intensity along the line of sight could result from (a) nearer than average displacement of OB stars from this gas, (b) differing CNM cloud distances from a centrally-located bulge source, or (c) in the case of CDM galaxy formation scenarios, passage of the line-of-sight through separate protogalactic clumps with independent SFRs (Haehnelt et al. 1998). The CDM scenario should produce standard deviations, 1, because the SFRs would be uncorrelated at the different clump locations. But in the bulge scenario, we find where is the thickness of the surrounding disk and is the sightline impact parameter. This would lead to 1, for typical values of . To discriminate between these hypotheses, larger samples of DLAs with measured are required.
5 DO H IGH- DLAs CONTAIN CNM GAS ?
In this section we discuss possible objections to the presence of CNM gas in DLAs. Recall that if C II∗ 1335.7 absorption arises in WNM gas, the inferred FUV radiation contributes more background radiation than observed. On the other hand if it arises in CNM gas, the background radiation is consistent with observations. Nonetheless, the following arguments have been made against the presence of CNM gas in high- DLAs.
5.1 C II/C I Ratios
The first of these has to do with the large values observed for the ratio, (C II)/(C I) (hereafter C II/C I). Liszt (2002) constructed two-phase models similar to ours
and computed C II/C I ratios for 5 DLAs for which observed ratios were available. While the ratios he predicted for the CNM were lower than observed, those predicted for the WNM were consistent with observed values. He concluded the observed C II/C I ratios permit no more than a few percent of the DLA gas to be in the CNM phase.
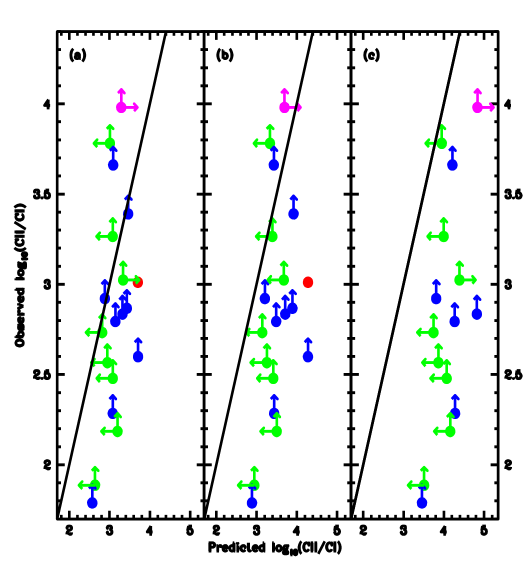
We repeated these calculations with the CNM model with “Gal” dust and minimal depletion. In Figure 12 we compare the results with C II/C I ratios deduced for 19 DLAs in our sample. With the exception of the filled red circle depicting a positive detection, the observed C II/C I ratios are lower limits, while the predicted C II/C I ratios are definite numbers if is detected (filled blue circles), and upper or lower limits if limits are placed on (filled green circles; see caption to Figure 12). Figure 12a shows results for a model incorporating many of the assumptions made by Liszt (2002). In particular, we assume the incident soft X-ray radiation is attenuated by gas with H I column density log10 = 19.3 cm-2. We are in general agreement with Liszt (2002) that this CNM model cannot account for the large values observed for C II/C I. Although the model predictions should lie to the right of the diagonal line representing equality between observed and predicted ratios, one third of the sample is on or to the left of the line. This disagreement takes on significance when it is realized that all the discrepant points are lower limits on the observed C II/C I ratio and hence the actual ratios are displaced even further from agreement with model predictions.
However, the predicted C II/C I ratios are sensitive to changes in model input parameters. This is evident in Figure 12b showing results for the same model as in Figure 12a except Nw is increased to 1020 cm-2; i.e., to the attenuating column density, which is more appropriate for DLAs and which is used in all our calculations (see discussion in Paper I). Comparison with Figure 12a reveals an increase in predicted C II/C I ratios by 0.4 dex with a consequent improvement between theory and observation. The reasons for the increase in C II/C I are as follows: The increase in results in a reduction in X-ray intensity, which in turn causes a decrease in the heating rate. This decreases the gas pressure, which brings about a decrease in the CNM density, as illustrated in Figure 5 in Paper I. For a given a decrease in causes an increase in (hence ), a decrease in , and a rise in . All three factors conspire to increase the C II/C I ratio, since it is proportional to , where , the case A recombination coefficient to C I, decreases with increasing . For many DLAs even better agreement is achieved if we retain log10 = 20 cm-2 and reduce the ratio of cosmic ray ionization rate to SFR per unit area, /, below the ratio given in equation (9) in Paper I. At these low X-ray intensities, cosmic rays still dominate the ionization rate, and as a result is reduced even further. Figure 12c shows results for / equaling 0.3 times the ratio in equation (9) in Paper I. In this case most of the predicted C II/C I ratios are in better agreement with observations than before. However, in the most metal rich DLAs the additional decrease in pressure accompanying the reduction in / results in the disappearance of the pressure maxima and minima essential for two-phase equilibria. This is why four of the DLAs in Figures 12a and 12b are missing from Figure 12c. Clearly, more realistic models might include a range in / ratios rather than assigning the same value to each DLA.
The point of this exercise is to show that the C II/C I ratio depends sensitively on the X-ray and cosmic ray ionization rates, both of which are uncertain. For these reasons, it is premature to use the C II/C I ratio to rule out CNM gas in DLAs. On the other hand, the observed C II/C I ratios are useful for placing upper limits on the / ratio. We find that / in our model CNM gas cannot be more than 2 times the value in equation (9) in Paper I. Otherwise more than one third of the points in the Figure 12 would lie above the diagonal line.
5.2 Equilibrium Gas Pressures in DLAs
The second argument against CNM gas in high- DLAs was made by Norman & Spaans (1997). They concluded that high- DLAs instead consisted of pure WNM gas with pressures . Computing two-phase equilibria in the context of CDM models for galaxy formation, they found that at 1.5 the gas equilibrium pressure, ,
exceeded the hydrostatic pressure, , in the midplanes of protogalactic disks embedded in dark-matter halos. By contrast was predicted to be less than at 1.5. They concluded that the hydrostatic pressure available in model protogalaxies is insufficient to generate two-phase media at 1.5. The ratio decreases with increasing redshift because increases due to the sharp decline of metallicity with redshift predicted by Norman & Spaans (1997; Spaans 2002).
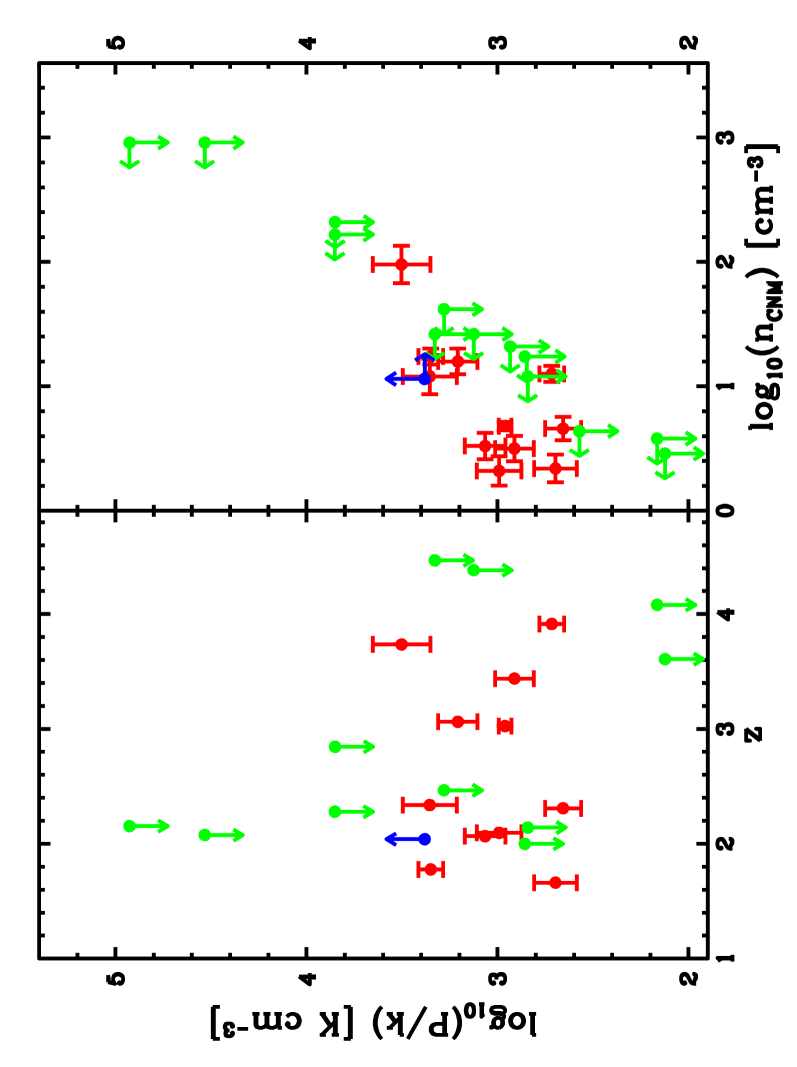
We tested these predictions using measurements of to infer . The results shown in Figure 13 were obtained with the CNM, “Gal” dust, minimal depletion model discussed above. In Figure 13a we plot versus . The average of the pressures corresponding to the positive detections is =(1.330.81)103 K cm-3. This is much lower than the gas pressures predicted by Norman & Spaans (1997), which exceed 105 K cm-3 at 1.5 (see their Figure 3), but in agreement with predicted for typical CDM models. According to the CDM models of Mo et al. (1998), 2/3 of DLAs detected in absorption at 2.5 should arise in halos with circular velocities, 100 km s-1 . Using the Norman & Spaans (1997) formalism we find the corresponding hydrostatic pressures to exceed 2103 K cm-3. Given the uncertainties, we conclude that the hydrostatic pressures available in CDM models are sufficient to generate the type of two-phase equilibria we infer for DLAs. Coincidentally, these pressures could also arise in high- DLAs if they resemble nearby massive galaxies such as the Milky Way where the gas pressures at the solar circle are 3103 K cm-3 (Wolfire et al. 2002). The analysis of Mo et al. (1998) and Norman & Spaans (1997) shows , where the Hubble parameter is an increasing function of redshift. Therefore low-mass objects at high redshift can in principle generate as much hydrostatic pressure as high-mass objects with low redshifts. As a result, pressure does not discriminate between DLA models based on CDM from the null hypothesis in which DLAs are the unevolved disks of current normal galaxies (e.g. PW97). Nor does the absence of redshift evolution evident in Figure 13a. This is an obvious prediction of the null hypothesis. In the case of CDM we note that the non-linear mass scale, (1+z)-(6/(n+3)), where is the power-spectrum index (Padmanabhan 1993), and the virial velocity, , where the Hubble parameter, for the Einstein-deSitter cosmology. Since = 2 at galactic scales, is independent of redshift. As a result, the redshift dependence of is negligible in both models.
In Figure 13b we plot versus CNM density, . The densities corresponding to positive detections (red data points) range between 2 and 100 cm-3 with an average = 16 cm-3. These resemble densities inferred for the CNM clouds in the Galaxy (W95). Because the H I column density of a typical DLA velocity component is approximately 11020 cm-2 (PW97), the volume densities imply physical dimensions on the order of a few pc. This conclusion differs from arguments that DLA clouds causing 21 cm absorption uniformly cover the cores of compact radio sources, which typically have linear sizes of 100 to 400 pc (Briggs & Wolfe 1983), and has important implications for interpreting measurements of 21 cm absorption in DLAs (see 5.3). The linear correlation evident in Figure 13b is tentative, because the Kendall test for positive detections indicates = 0.45 and the probability for the null hypothesis of no correlation, = 0.052. We find the average temperature =190130 K for this model. The temperatures are higher than diffuse clouds in the ISM due to the combination of low densities and low metallicities.
5.3 High Spin Temperatures at Large Redshifts
The third argument against CNM gas at high redshifts stems from the high spin temperatures, , deduced from 21 cm absorption observations of DLAs. Whereas spin temperatures in nearby spirals are less than 300 K (Dickey & Lockman 1990), the spin temperatures in most DLAs exceed 500 K (Chengalur & Kanekar 2001). The discrepancy is greatest at 3 where several DLAs exhibit 2000 K. Because the kinetic temperature, , equals the spin temperature in most scenarios, the high values of have been interpreted as indicators of gas in the WNM rather than CNM phase (Carilli et al. 1996; Kanekar & Chengalur 2001; Chengalur & Kanekar 2002). This poses an interesting dilemma, as C II∗ absorption, which must arise in the CNM in most DLAs, is detected in two DLAs with high inferred spin temperatures.
How do we reconcile the spin temperature limit, 4000 K (Ellison et al. 2001; Kanekar & Chengalur 2001), with the 100 K temperature predicted for the CNM in the = 3.387 DLA toward Q020111? To answer this question we consider the sizes of the CNM clouds relative to the background radio source in Q020111. Following the discussion in 5.2 we find that the linear dimensions of CNM clouds are less than 10 pc, since 6 cm-3 and we have assumed half the total H I column density of 1.8 cm-2 to be CNM gas equally distributed among 5 or more velocity components. To estimate the linear dimension subtended by the radio source at the DLA we note that VLBI observations at = 1.6 GHz show Q020111 to subtend a solid angle less than =2.55.0 mas2 (Hodges et al. 1984). The solid angle of the source must be larger than at = 323.7 MHz, the frequency of redshifted 21 cm absorption, otherwise the brightness temperature of this radiation in the rest frame of the = 3.61 QSO, (1492 MHz)=1.71012K. This exceeds the 1012K Compton limit restricting the brightness temperature of sources such as Q020111, which belongs to the class of peak spectrum objects not exhibiting relativistic beaming (Phillips & Mutel 1982). To be consistent with the Compton limit the source must subtend an effective linear diameter exceeding 40 pc at the DLA (where we assume =0.3, =0.7, and =0.7). As a result the typical CNM cloud in this DLA covers a small fraction of the background radio source. This contrasts with the conclusions of deBruyn et al. (1996) who did not consider the Compton limit.
It is now possible to understand the discrepancy between
and the temperature of the CNM. In the optically thin
limit
the apparent
21 cm optical depth (21)=
(21)
where is the area covering factor of CNM gas,
is the 21 cm optical depth of a CNM cloud,
[], and
and are the 373.3 MHz flux densities at Doppler velocity
and in the continuum respectively. Chengalur & Kanekar (2000)
placed a 1- upper limit of 0.011 on . We
shall be more conservative and assume a 95 confidence
upper limit of 0.022, which reduces the lower
limit on to 2000 K. Because
half the sample DLAs show positive evidence for
C II∗ absorption, while in 3 out of 25 DLAs there is
probable evidence for WNM gas (see Paper I),
we find 0.5 0.88.
We shall assume = 0.67 as this is in accord with
the observed relative
occurrence of multiple C II∗ velocity components in DLAs.
As a result we find
0.033.
To compute (H I),
the H I column density of the CNM cloud, we must estimate , the
Gaussian velocity dispersion of the gas, since
=
1.821018.
Assuming = 9 km s-1 , the velocity dispersion corresponding
to the velocity width to which the upper limits on (21) apply,
and 100 K,
we find 1.41020 cm-2.
This is consistent with a total CNM H I column
toward the optical continuum of
91020 cm-2 distributed among 5 or more
components, and a typical CNM HI column of
1.41020 cm-2 covering the radio source.
In other words, the inferred spin temperature for the DLA
toward Q020111 is high not because the temperature
of the absorbing gas is high, but rather because the H I column
densities of the foreground CNM clouds are low.
In fact there is evidence for a decrease
in (H I) with increasing redshift. Peroux et al. (2002)
find the mean
H I column density of DLAs,
= 3.91020 cm-2 at 3.5, while
= 8.21020 cm-2 at
= 2.43.5. Because these correspond to the total
(H I) rather than the CNM portion of the gas, it is plausible to
assume the mean H I column densities of CNM gas to be
21020 cm-2 at the DLA redshift, = 3.38.
Therefore, it is not improbable for (H I)CNM to equal
(12)1020 cm-2 in this DLA. If this interpretation
is correct, the high H I column density ((H I)
= 1.81021 cm-2) and
C II∗ detected in
absorption toward
Q020111 indicate that a larger than average
number of CNM clouds are lined up
toward the optical continuum source of this QSO.
This is supported by the excessive number of
low-ion clouds spread across a velocity interval
of 270 km s-1 (Ellison et al. 2001);
by comparison the median velocity interval of DLAs is 100 km s-1 (PW97). Note, Chengalur & Kanekar (2000) would not have
detected this configuration, since it would have an apparent
optical depth, (21) = (10pc/40pc)2
5 0.01, which is
less than the 2- upper limit of 0.022.
Ellison et al. (2001) carried out an imaging study
of the field surrounding Q020111 that provides a test
of the CNM hypothesis.
If C II∗ absorption in this DLA arises in WNM gas, the FUV
intensities (at = 1500 Å), ,
would be higher than indicated by our CNM model.
We find
()WNM=3.810-18 ergs cm-2 s-1 Hz-1 sr-1, while
()CNM=4.310-19 ergs cm-2 s-1 Hz-1 sr-1 for the
case of “Gal” dust and maximal
depletion.
Based on photometric redshifts, the leading candidate for the galaxy
responsible for DLA absorption is object G2, the high surface-brightness
region of an 25.3 galaxy
separated by = 2.9 arcsec from the QSO.
If the FUV radiation
emitted by G2 heats WNM gas responsible for C II∗ absorption, according
to the bulge
hypothesis G2 would detected in the band
with flux density, =4(/(1)3,
where . In this case the predicted AB
magnitude, = 21.3. If instead this WNM gas is heated by a uniform disk
of sources centered on G2 and extending across the QSO sightline,
the surface brightness of the disk
would be =26.4 mag arcsec-2. Both WNM scenarios are
ruled out by the Ellison et al. (2001) images. In the bulge scenario,
G2 would be 4 magnitudes brighter than observed,
while in the
uniform disk scenario the
surface brightness of the disk would be detectable
at the 4- level
in regions on the side of G2 away from the QSO.
On the other hand if G2 heats CNM gas responsible for
C II∗ absorption,
then = 23.6 in the bulge scenario, while
=28.7 mag arcsec-2
in
the uniform disk scenario.
Because of the large uncertainties in the magnitude
of G2,
the bulge scenario is only
marginally consistent with the data, while the uniform
disk scenario is definitely consistent with the data. Therefore, the
gas producing
C II∗ absorption must be a CNM if it is heated
by FUV radiation emitted
by sources associated with G2. Of course,
G2 may be incorrectly
identified and the galaxy associated with the DLA could be located
within the PSF of the QSO (Ellison et al. 2001),
in which case C II∗ absorption could arise in either phase.
This emphasizes the importance of obtaining a spectroscopic
redshift for G2.
More recently, Kanekar & Chengalur (2003) deduced a 95 confidence lower limit of 1.4104 K for the =3.062 DLA toward Q033601. By contrast we infer an equilibrium temperature of 100 K from the presence of C II∗ absorption in this DLA (see Table 1 in Paper I). In principle, we can explain the high inferred value of with low values of (H I)CNM in this object also. However, much lower CNM filling factors are required due to the higher value of . We think it more likely that the high inferred for this DLA is a byproduct of a complex radio-source structure. Though this source is observed to be compact at 5 GHz, it is likely to be extended at the much lower frequency predicted for redshifted 21 cm absorption. In fact, it is possible that the radio emission is concentrated in two equally bright components, each of which is symmetrically displaced more than 10 pc from the optical continuum (see Phillips & Mutel 1982). In that case the gas detected in optical absorption need not intercept radio-frequency radiation along the line of sight. In any case it is difficult to understand how the lower limit on can correspond to the temperature of neutral gas in any DLA, since 50 of H is collisionally ionized at 1.5104 K.
6 SUMMARY and CONCLUDING REMARKS
This paper expands on a new technique for measuring SFRs in DLAs developed in Paper I. Namely, in Paper I we showed how detections of C II∗ 1335.7 absorption could be used to infer the SFR per unit physical area, , in DLAs. We showed that a two-phase neutral medium, in which CNM gas is in pressure equilibrium with a WNM gas, is a natural byproduct of thermal equilibrium. We also found that C II∗ absorption lines detected in DLAs could arise in either phase, but that significantly higher values of were required if this absorption arose in the WNM. In this paper we use cosmological constraints to show that while the line-of-sight likely encounters both phases, C II∗ absorption arises mainly in the CNM. Our specific conclusions are as follows:
(1) We compute the SFR per unit comoving volume in DLAs, , by combining the mean SFR per unit area, , with the observed number of DLAs per unit absorption distance. We obtain statistically significant results for two redshift bins centered at = 2.15 and = 3.70; these are the first quantitative measurements of at 2. The results show (a) for the WNM model is at least 10 times higher than for the CNM model, (b) for the CNM model is in approximate agreement with independent determinations from luminosities measured for flux-limited samples of galaxies, and (c) no evidence for evolution in the redshift interval, = [1.6, 4.5]. We also compute the bolometric background intensities, , generated by the SFR histories, . In every case the WNM models predict above the observed 95 confidence upper limits. By contrast, the predicted for the CNM models are consistent with this limit. As a result, models in which C II∗ absorption arises in WNM gas are ruled out. Finally, we develop a “consensus” model, which accounts for the systematic errors arising from various model uncertainties. We also find for DLAs appears to decrease significantly with decreasing redshift at 1.6 if DLAs evolve into ordinary galaxies. To compute we average over rather than the de’Vaucouleurs radius.
(2) We consider several consequences of our work. First, we evaluate the mass of stars and metals produced by the star formation histories we derived. Though the mass in stars produced by = 0 is consistent with the masses of current stellar populations in current galaxies, the mass of metals produced by = 2.5 is significantly higher than is observed for DLAs at that redshift. Various solutions to this dilemma come to mind, including ejection of metal-enriched gas from DLA, making DLAs a transitory phase of galaxy evolution. But this results in an IGM metallicity, [M/H] = 1.2, which is a factor of 100 larger than observed in the Ly forest. Rather we favor a scenario in which star formation and metal production occur in a centrally-located bulge region displaced from the DLA gas. Second, we evaluate the bulge hypothesis and find that to within 10 accuracy the predicted agrees with that predicted by the uniform-disk model used to derive the results discussed above. From the empirical upper limit on , we find that the fraction of FUV radiation attenuated by optically thick dust in the bulge cannot exceed 0.7. Third, we search for evidence of connections between stars and gas. We find no evidence for a Kennicutt (1998) correlation between and (H I). This is naturally explained by the bulge hypothesis in which SFRs in the bulge region are unrelated to the H I column density in regions giving rise to DLA absorption. The lack of a Kennicutt relation is also consistent with the model in which star formation occurs in the same region creating DLA absorption. This is because is the SFR averaged over the entire DLA (5 kpc or more in most models), while (H I) is sampled over a transverse dimension corresponding to the linear diameter of the QSO, i.e., 1 pc. On the other hand when these quantities are averaged over the DLA sample, they are consistent with the Kennicutt relation, indicating that it may be present in a statistical sense. We also look for correlations between and metallicity, and and kinematic velocity width. Marginal evidence for correlations were found in the cases of metallicity and low-ion velocity width. Confirmation would indicate that both low-ion line width and metallicity are global parameters, which are determined by quantities such as dark-matter mass. The reasons for null correlations in the cases of and high-ion velocity width are the same as for the Kennicutt relation.
(3) We discussed tests of the ideas presented here. First, we present statistically significant evidence for a correlation between and . This is consistent with grain photoelectric heating by DLAs with a limited range of SFRs, since . We show that this correlation is not naturally explained by alternative heating mechanisms such as cosmic-ray ionization and X-ray photoionization. Second, we consider the possibility that the and fine-structure states in C+ are populated by CMB radiation rather than collisions. In that case would not equal the cooling rate as we have assumed, but would instead reflect the local temperature of the CMB. We test this hypothesis by comparing the observed with ()CMB, the spontaneous energy emission rate per H atom when CMB radiation alone populates the fine-structure states. We conclude that the CMB alone cannot explain the observed level of C II∗ excitation in 28 out of 30 DLAs. This is because the observed do not show the sharp increase with redshift predicted for ()CMB and because in all 28 cases, ()CMB. The two exceptions are DLAs with upper limits on , and in which ()CMB 0.8. The implied cooling rates are very low, and may indicate passage of the QSO sightlines through a WNM subjected to SFRs less than or equal to the mean deduced for most of our sample. In the third test, we use the ratio of C II∗ to resonance-line optical depths, = (C II∗)/(Si II), to probe the multi-phase structure of the gas. Specifically, in the WNM should be ()WNM/()CNM times in the CNM. Because ()WNM/()CNM 0.08, should decrease significantly at velocities corresponding to the WNM. Such variations may have been detected in one DLA. We also show how the WNM is easy to hide, and we discuss possible evidence for an increase in at velocities where in the CNM increases.
(4) We discuss possible objections to our picture of DLAs. The most persistent of these is the proposal that DLAs do not contain CNM gas, but rather are comprised only of WNM gas. The first argument against the CNM is related to the large C II/C I ratios detected in DLAs, since this ratio is predicted to be lower in the CNM of the Milky Way ISM. However, this conclusion is sensitive to the ratio of X-ray and cosmic-ray heating rates to the SFR per unit area. In our models the X-ray heating rate is considerably lower than in the ISM. For our model parameters we are able to construct reasonable models predicting C II/C I observations. The next argument against the CNM is that the hydrostatic pressures available in low-mass galaxy progenitors predicted for CDM theories are significantly lower than the values of predicted for two-phase models. In that case, CDM models cannot generate sufficient pressure to create a two-phase medium. We show this model is incorrect because the high values of were based on an underestimate of the DLA metallicities at large redshifts. The third argument against the CNM stems from the high spin temperatures deduced from the low 21 cm optical depth, 0.02, and high (H I) (= 21021 cm-2) of a high-redshift DLA. How does one reconcile the large inferred spin temperature ( 2000 K) with the low temperatures ( 100 K) indicated by the detection of C II∗ absorption in this DLA? This answer is related to the geometry and H I column densities, (H I)CNM, of the CNM clouds. Specifically, our models predict CNM clouds with sizes less than 10 pc, which is smaller than the diameter of the background radio source. In that case we find (H I)CNM 1020 cm-2 for typical CNM clouds covering the high- background radio source. Therefore, the inferred spin temperature is high not because the temperature of the absorbing gas is high, but rather because (H I)CNM is low. As a result, the large value of (H I) toward the optical continuum source implies a larger than average number of CNM clouds along this line of sight, which is observed.
While we have attempted to evaluate important sources of systematic error, uncertainties still remain in our analysis. For example, we cannot rule out the possibility that the grain size distribution is radically different from the MRN model used in our calculations. However, we think this is unlikely, as the MRN distribution nicely describes grain properties in local group galaxies, which are linked to high- DLAs by a similarity in the comoving density of stars in the galaxies to the comoving density of neutral gas in the DLAs. While the composition of the dust is also uncertain, sensitive searches for the 2175 Å feature will greatly reduce this source of systematic error. Secondly, though we have presented evidence for a two-phase medium in our DLA sample, in particular we described evidence for the presence of a WNM in 3 DLAs, the thermal state of the gas may differ from the equilibria envisaged in the models. Heiles (2001) has argued that warm clouds in the ISM have temperatures of 2000 K rather than the 8000 K predicted for the WNM. However, the C II∗ absorption we observe is unlikely to arise in such gas because at 1000 K the ratio of to the total cooling (i.e., heating) rates is only slightly larger than predicted for the WNM. As a result, SFRs similar to those predicted for the WNM would be required and would likely exceed the observed upper limits on the bolometric background radiation intensity. There may be other caveats we have not discussed, but they are not obvious to us at this time.
Finally, we discuss the similarity between for DLAs and LBGs. Does it mean they are the same objects? Schaye (2001) suggested they were, and that DLAs were created by the intersection between the line of sight to the QSO and gas outflow from foreground LBGs. He argued that since LBGs brighter than = 27 have comoving densities =0.016 Mpc-3, they could account for the incidence of DLAs provided their H I cross-sectional radius =19 kpc for a cosmology with (,)=(0.3,0.7). With our measurement of we can compute the SFR per DLA, , because =. From Table 1 we find =40 M for =0.7. SFRs this high are ruled out by results from H imaging surveys of DLAs (Bunker et al. 2001; Kulkarni et al. 2001). Furthermore, in a recent search for a cross-correlation between DLAs and LBGs, Adelberger et al. (2002) found tentative evidence that DLAs with 25 were more weakly clustered than LBGs with 25. As a result, current evidence suggests that DLAs and LBGs brighter than =27 are drawn from separate parent populations. But more evidence is needed before this can be accepted as a robust result. If this is confirmed, the similarity between the SFRs per unit comoving volume of LBGs and DLAs would be a coincidence.
References
- adelberger (2003) Adelberger, K. L, Steidel, C. C., Shapley, A. E. & Pettini, M. 1998, ApJ, 584, 45
- bahcallj (1969) Bahcall, J. N. & Peebles, P. J. E., 1969, ApJ, 156, L7
- bakes (1994) Bakes, E. L. O. & Tielens, A. G. G. M. 1994, ApJ, 427, 822
- barger (2000) Barger, A. J., Cowie, L. L., & Richards, E. A. 2000, ApJ, 119, 2092
- barger (2000) Bennett, C. & the WMAP team, 2003, astroph/0302208.
- briggs (1983) Briggs, F. H. & Wolfe, A. M. 1983, ApJ, 268, 76
- charlot (1993) Bruzual, A., & Charlot, 1993, ApJ, 405, 538
- carilli etal (1996) Carilli, C. L., Lane, W., De Bruyn, A. G., Braun, R., & Miley G. K. 1996, AJ, 111, 1830
- cheng (2000) Chengalur, J. N., & Kanekar, N. 2000 MNRAS, 318, 303.
- cowie (1979) Cowie, L. L., Songaila, A., & York, D. G. 1979, ApJ, 230, 469
- Dessauges-Zavadsky et al. (2001) Dessauges-Zavadsky, M., D’Odorico, S., McMahon, R. G., Molaro, P., Ledoux, C., Peroux, C., & Storrie-Lombardi, L. J., 2001, A&A, 70, 426
- deBruyn (1996) de Bruyn, A. G., O’Dea, C. P., & Baum, S. A. 1996, A&A, 305, 450
- dickey (1990) Dickey, J. M., & Lockman, F. J. 1990, ARA&A, 28, 215
- dopita (1994) Dopita, M. A., & Ryder, S. D. 1994, ApJ, 430, 163
- draine (1978) Draine, B. T. 1978, ApJS, 36, 595
- Dwek (2002) Dwek, E. 2002, private communication
- efstathiou (2000) Efstathiou, G. 2000, MNRAS, 317, 697
- Ellison et al. (2001) Ellison, S. L., Pettini, M., Steidel, C. C., & Shapley, A. E. 2001, ApJ, 549, 770
- Fukugita (1998) Fukugita, M., Hogan, C. & Peebles, P. J. E. 1998, ApJ, 503, 518
- Garnett (1997) Garnett, D. R., Shields, G. A., Skillman, E. D., Sagan, S. P., & Dufour, R. J. 1997, ApJ, 489, 63
- Ge (2002) Ge, J. & Bechtold, J. 1997, ApJ, 477, L73
- Haehnelt et al. (1998) Haehnelt, M. G., Steinmetz, M., & Rauch, M. 1998, ApJ, 495, 647
- HauserDwek (2001) Hauser, M. G. & Dwek, E. 2001, ARAA, 39,249
- Heiles (2001) Heiles, C. 2001, ApJ, 551, L105
- Hodges (1994) Hodges, M. W., Mutel, R. L., & Philips, R. B. 1984, AJ, 89, 1327
- Holland (1999) Holland, W. S. et al. 1999, MNRAS, 303, 659
- Kankek (2001) Kanekar, N., & Chengalur, J. N. 2001, A&A, 369, 42.
- Kankek (2003) Kanekar, N., & Chengalur, J. N. 2003, A&A, 399, 857.
- Kennicutt (1998) Kennicutt, R. C.,Jr. 1998, ARA&A, 36, 189
- Kulkarni (1987) Kulkarni, S. R., & Heiles, C. 1987, in Interstellar Processes, eds. D. J. Hollenbach & H. A. Thronson (Reidel: Dordrecht), p. 87
- Kulkarni etal (2001) Kulkarni, V. P., Hill, H. M., Schneider, G., Weymann, R. J., Storrie-Lombardi, L. J., Rieke, M. J., & Thompson, R. I. 2001, ApJ, 551, 37
- lane etal (2000) Lane, W. M., Briggs, F. H., & Smette, A., 2000, ApJ, 532, 146
- lanzetta etal (2002) Lanzetta, K. M., Noriaki, Y., Pascarelle, S., Chen, H.-W., & Fernandez-Soto, A., 2002, ApJ, 570, 492
- lanzetta etal (2002) Ledoux, C., Srianand, R., & Petitjean, P., A&A, 392, 781L
- leitherer (1998) Leitherer, C. 1998, in Dwarf Galaxies and Cosmology, ed. Trinh X. Thuan, C. Balkowski, V. Cavatte, & Tranh Tranh Van (Paris: Editions Frontieres), p. 42
- levshakov et al. (2002) Levshakov, S. A., Dessauges-Zavadsky, D’Odorico, S., & Molaro, P. ApJ, 2002, 565, 696
- lilly (1996) Lilly, S., Le Fevre, O., Hammer, F., & Crampton, D. 1996, ApJ, 460, L1
- Liszt (2002) Liszt, H. 2002, A&A, 389, 393, 42
- Mckee (1990) Mckee, C. F. 1990, in “Evolution of the Interstellar Medium”, ed. L. Blitz, (San Francisco: ASP), 3
- Mac Low & Ferrara (1999) Mac Low, M.-M., & Ferrara, A. 1999, ApJ, 513, 142:1
- Madau (1996) Madau, P., Ferguson, H. C., Dickinson, M. E., Giavalisco, M., Steidel, C. C., & Fruchter, A. 1996, MNRAS, 283, 1388
- Madau (2000) Madau, P., & Pozzetti, L. 2000, MNRAS, 312, L9
- Maclow (1999) Mac Low, M., & Ferrara, A. 1999, ApJ, 513, 142
- Martin (2003) Martin, C., 2003, private communication
- Mo (1998) Mo, H. J., Mao, S., & White, S. D. M. 1998, MNRAS, 295, 319
- Molaro (2002) Molaro, P., Levshakov, S. A., Dessauges-Zavadsky, M., & D’Odorico, S. 2002 A&A, 381, L64
- morrison (1983) Morrison, R., & McCammon, D. 1983, ApJ, 278, 119
- Pad (1993) Padmanabhan, T. 1993, Structure Formation in the Universe, (Cambridge University Press: Cambridge), p. 335
- Pei (1999) Pei, Y. C., Fall, S. M., & Hauser, M. G. 1999, ApJ, 522, 604
- peroux (2001) Peroux, C., McMahon, R. M., Storrie-Lombardi, L. J., & Irwin, M. J. 2001, astroph/0107045
- Pettini (1994) Petitjean, P., Srianand, L. & Ledoux, C. 2002 MNRAS, 332, 383
- Pettini (1994) Pettini, M., Smith, L. J., Hunstead, R. W., & King, D. L. 1994, ApJ, 426, 79
- Pettini (1999) Pettini, M. 1999 astro-ph 9902173
- Pettini et al. (2001) Pettini, M., Shapley A. E., Steidel, C. C., Cuby, J.-G., Dickinson, M., Moorwood, A. F. M., Adelberger, K. L., & Giavalisco, M. 2001, ApJ, 554, 981
- Phillips (1982) Phillips, R. B. & Mutel, R. L. 1982, A&A, 106, 21
- Prochaska and Wolfe (1997) Prochaska, J. X. and Wolfe, A. M. 1997, ApJ, 487, 73 (PW97)
- Prochaska and Wolfe (1998) Prochaska, J. X. and Wolfe, A. M. 1998, ApJ, 507, 113
- Prochaska and Wolfe (20020) Prochaska, J. X. and Wolfe, A. M. 2002, ApJ, 566, 68 (PW02)
- rosenberg and schneider (2003) Rosenberg , J. L. and Schneider, S. E. 2003, ApJ, 585, 256
- Savage (2001) Savage, B. D., Meade, M. R., & Sembach, K. R. 2001, ApJS, 136, 631
- Schaye (2001) Schaye, J. 2001, ApJ, 559, L1
- silva (2002) Silva, A. I., & Viegas, S. M. 2002, A&A, 329 135S
- tony (2001) Songaila, A. 2001, ApJ, 561, L153
- Srianand et al. (2000) Srianand, R., Petitjean, P., & Ledoux, C. 2000, Nature, 408, 931
- Steidel (1999) Steidel, C. C., Adelberger, K. L., Giavalisco, M., Dickinson, M., & Pettini, M. 1999, ApJ, 519, 1
- lisa (2000) Storrie-Lombardi, L. J. & Wolfe, A. M. 2000, ApJ, 543, 552
- toomre (1964) Toomre, A. 1964, ApJ, 139, 1217
- Turnshek (2002) Turnshek, D. A., Rao, S. M., & Nestor, D. B. 2002, in Extragalactic Gas at Low Redshift, ed. J. Mulcahey & J. Stocke (San Fransisco: ASP), 42
- Vazquez (2000) Vazquez-Semadeni, E., Gazol, A., & Scalo, J. 2000, ApJ, 540, 271
- Walborn (1998) Walborn, N. R., Danks, A. C., Sembach, K. R., Bohlink R. C., Jenkins, E. B., Gull, T. R., Lindler, D. J., Feggans, K., Hulbert, S. J., Linksy, J., Hutchings, J. B., & Joseph, C. L. 1998, ApJ, 492, L169
- Weingartner & Draine (2001) Weingartner, J. C. & Draine, B. T. 2001a, ApJS, 134, 263
- Wolfe (1995) Wolfe, A. M. 1995, in ESO workshop on QSO Absorption Lines, ed. G. Meylan, (Berlin: Springer), 13
- Wolfe (1985) Wolfe, A. M., Briggs, F. H., Turnshek, D. A., Davis, M. M., Smith, H. E., & Cohen, R. D. 1985, ApJ, 294, L67
- Wolfe (1986) Wolfe, A. M., Turnshek, D. A., Smith, H. E., & Cohen, R. D. 1986, ApJS, 61, 249
- Wolfe (1998) Wolfe, A. M., & Prochaska, J. X. 1998, ApJ, 494, L15
- Wolfe (1998) Wolfe, A. M., & Prochaska, J. X., & Gawiser, E., 2003, ApJ, to be published, (Paper I)
- Wolfire et al. (1995) Wolfire, M. G., Hollenbach, D., McKee, C. F., Tielens, A. G. G. M., & Bakes, E. L. O. 1995, ApJ, 443, 152 (W95)
- Wolfire et al. (2002) Wolfire, M. G., McKee, C. F., Hollenbach, D., & Tielens, A. G. G. M. 2002, astrophy/0207098
- Wyse et al. (1997) Wyse, R. F. G., Gilmore, G. & Franx, M. 1997, ARA&A, 35, 637
- Zwaan (2002) Zwaan, M., Briggs, F. H., & Verheijen, M. 2002, in Extragalactic Gas at Low Redshift, eds. J. Mulcahey & J. Stocke (San Fransisco: ASP), 169