The Extremely Red Submillimeter Galaxy SMM J04431+0210
Abstract
We report the redshift measurement for the submillimeter selected galaxy SMM J04431+0210 (N4) using the Near Infrared Spectrograph on the Keck II telescope. The data show H, [NII] 6583,6548, and [OIII] 5007 lines at a redshift of . The high nuclear [NII]/H line ratio is consistent with a LINER or Type-II AGN. The H emission is spatially resolved, suggesting the presence of significant star-forming activity outside the nucleus. From imaging with the Near Infrared Camera on the Keck I telescope, we find an extremely red near-infrared color of JK=3.2 for N4. Follow-up redshifted CO(32) observations with the Owens Valley Millimeter Array constrain the mass of molecular gas to be less than , after correcting for lensing. The CO to sub-mm flux limit, the spectroscopic line ratios, and the spectral energy distribution for N4 are all within the range of properties found in other high-redshift sub-mm sources and local ultraluminous infrared galaxies. After the correction for lensing, N4 is the weakest intrinsic sub-mm selected source with a known redshift and represents the first redshift for the mJy 850m sources which are responsible for the bulk of the emission from the sub-mm population as a whole. We argue that N4 contains either an AGN or LINER nucleus surrounded by an extended region of active star-formation.
Subject headings:
galaxies: active — galaxies: evolution — galaxies: formation — galaxies: individual (SMM J04431+0210) — galaxies: starburst1. Introduction
Since the discovery of the submillimeter population of galaxies (Smail, Ivison, & Blain 1997; Hughes et al. 1998; Barger et al. 1998; Eales et al. 1999), extensive follow-up observations across the entire electromagnetic spectrum ranging from X-ray to radio wavelengths have been obtained (see review by Blain et al. [2002]). Despite these observational efforts, fundamental questions remain about the population as a whole, foremost among these are the redshift distribution and dominant energy source heating the dust. Detailed studies of individual sub-mm galaxies are crucial in answering these questions, however, progress has been slow since many sub-mm sources are extremely faint in their observed optical bands. Several of the original potential bright optical counterparts are now suspected to be mis-identifications based on deep near-infrared observations (Smail et al. 1999; Frayer et al. 2000; Dunlop et al. 2003) and redshift estimates based on radio data (Smail et al. 2000; Webb et al. 2003).
The current data show that the sub-mm population has a mixture of AGN and starburst characteristics with properties which are roughly consistent with those of the local population of ultraluminous () infrared galaxies (ULIRGs). The molecular CO line data for the sub-mm galaxies show the presence of sufficient molecular gas to fuel high levels of star-formation activity (Frayer et al. 1998, 1999). However, the relative importance of AGN and starburst activity in powering the high luminosities of the sub-mm population is still open to debate, as is the case with local ULIRGs (e.g., Sanders & Mirabel 1996; Genzel et al. 1998; Veilleux, Kim, & Sanders 1999). In order to understand the nature of the sub-mm population, we have been carrying out multi-wavelength observations of individual systems in the SCUBA Cluster Lens Survey (Smail et al. 2002). This survey consists of 15 background sub-mm sources identified from sensitive sub-mm mapping of seven massive, lensing clusters. The advantage of this sample is that the amplification of the background sources allows for deeper source frame observations.
In this paper we report a redshift of for the sub-mm galaxy SMM J04431+0210 (N4), obtained from near-infrared observations with the NIRSPEC instrument on the Keck II telescope. The galaxy N4 at , (J2000) was previously identified as the likely sub-mm counterpart based on its extremely red IK color (Smail et al. 1999). An increasing number of sub-mm sources are now believed to be extremely red objects (EROs []) due to their high dust content (Smail et al. 1999; Gear et al. 2000; Lutz et al. 2001; Ivison et al. 2001; Wehner, Barger, & Kneib 2002). Since N4 is the brightest K-band (2.2m) ERO counterpart in the Cluster Lens Survey, it is an ideal candidate for testing whether redshifts can be obtained for the SCUBA population in the near-infrared. In addition, N4 has a 850m flux density of only 1.6 mJy, after correcting for lensing, making it one of the intrinsically weakest sub-mm sources yet identified. Studies of weak sub-mm sources such as N4 are crucial to our understanding of the population as a whole since the majority of the sub-mm background arises from sources with S(850m) mJy (Blain et al. 1999a; Cowie, Barger, & Kneib 2002). We also report on follow-up CO observations with the OVRO Millimeter Array to search for molecular gas, as well as optical spectroscopy with the ESI instrument on the Keck II telescope to search for additional rest-frame optical and ultraviolet (UV) emission lines. The observations presented in this paper are summarized in Table 1.
A cosmology of H, , and is assumed throughout this paper. We adopt the lensing amplification factor of which was derived by Smail et al. (1999) and includes both the amplification due to the foreground cluster potential and the spiral galaxy near the position of N4.
2. OBSERVATIONS AND DATA REDUCTION
2.1. Spectroscopy
N4 was observed with NIRSPEC (Near Infrared Spectrograph) on Keck II111The W. M. Keck Observatory is operated as a scientific partnership among the California Institute of Technology, the University of California, and the National Aeronautics and Space Administration. The Keck Observatory was made possible by the generous financial support of the W. M. Keck Foundation. We are most fortunate to have the opportunity to conduct observations from the summit of Mauna Kea which has a very significant cultural role within the indigenous Hawaiian community. on 2000 December 26. NIRSPEC is a spectrograph operating over 0.95 to 5.4m (McLean et al. 1998). Observations were obtained in low-resolution mode (R1500) with a (4 pixel) wide slit. The seeing was typically 0 during the spectroscopic observations. The 42 length slit was placed at a position angle of to contain both N4 and the core of the bright nearby galaxy from N4 (Fig. 1). We used the nspec7 filter to search the entire K-band and obtained 130 minutes of useful on-source integration. H emission was detected at (Sec. 3.1).
In 2002 August we followed up the K-band detection of H by searching for the [OIII] 5007, 4959 doublet and H line in H-band using NIRSPEC. We used the same slit setup as done previously for K-band. The nspec6 filter was used since it is optimized on the redward side of H-band at the wavelengths of the redshifted emission lines.
The NIRSPEC data were combined in pairs at two different positions along the slit. This provided a zeroth-order background subtraction as well as removing the dark and bias levels from the data. Pixel-to-pixel gain variations were removed by dividing by a normalized flat produced from halogen lamp images. The spectra were transformed to produce a linear spatial and wavelength scale using standard tasks in the IRAF LONGSLIT package.222IRAF is the Image Reduction and Analysis Facility sofware package written and supported by the National Optical Astronomy Observatories. Observations of a star nodded along the slit provided spatial calibration, while neon and argon arc lamp lines as well as sky lines provided wavelength calibration. A linear background was subtracted from the frames as a function of wavelength to remove time variations in the sky emission. The spectra of bright calibration stars were used to correct for variations in the detector response as a function of wavelength.
Given its proximity, residual light from the nearby galaxy is present in the extracted spectrum of N4 after standard data reduction. In order to obtain the true continuum level and spectral slope for N4, the wings of the galaxy light were subtracted from N4 as a function of wavelength. There is a natural trade-off between the signal-to-noise (S/N) ratio of the final spectrum and the wavelength resolution over which the subtraction is done. We smoothed over two resolution elements in wavelength for the galaxy subtraction, which left a slight residual narrow Paschen- emission line from the foreground galaxy () at m. The resulting continuum level of the K-band spectrum was calibrated by averaging over the emission from 2 to 2.4m and placed on the K-band magnitude scale derived from the NIRC imaging (Sec. 2.2). The absolute flux level of the H-band spectrum was calculated using the continuum levels of the bright nearby galaxy and N4 at 2.0m, where the H- and K-band spectra have overlapping wavelength coverage.
In 2002 August we also obtained follow-up spectroscopy observations with the ESI (Echellette Spectrograph and Imager) instrument (Sheinis et al. 2002) on Keck II to search for additional emission lines in the rest-frame ultraviolet and optical bands. The ESI data were taken in the high-resolution echelle mode which provided wavelength coverage from 3900Å to 1100Å at a resolution of approximately . A slit with a width of was used. The ESI optical spectra were calibrated using the spectrophotometric standard Feige 110 (Massey et al. 1988).
2.2. Near-Infrared Imaging
We observed N4 using the Near Infrared Camera (NIRC) on Keck I in 1999 October in K-band and 2001 August in J and K-band. NIRC employs a pixel InSb detector with a pixel scale of (Matthews & Soifer 1994). The standard -band filter was used instead of the bluer filter since the object is extremely red. We observed using a random dithered pattern with about between adjacent dither positions. Sixty second integrations were taken at each position. A total of 22 and 74 minutes of on-source data were obtained in the K and J filters, respectively. The seeing-disks of the stars observed throughout the exposures varied from about to (FWHM).
Sets of dark frames from each night were subtracted from each exposure to remove the dark current as well as the bias level. The dark-subtracted exposures were divided by a normalized skyflat. Frames were sky-subtracted using temporally–adjacent images. Individual exposures were aligned to the nearest pixel using common objects in the frames. The data were placed on the Vega-magnitude scale from observations of a set of near-infrared standard stars (Persson et al. 1998) taken at a range of air masses to correct for atmospheric extinction. Based on the dispersion in the zero-points derived throughout the nights, the uncertainty of the derived magnitude scale is estimated to be better than 0.06 magnitude.
2.3. Millimeter Interferometry
Based on the redshift derived from the NIRSPEC observations, N4 was observed using the Owens Valley Millimeter Array333The Owens Valley Millimeter Array is a radio telescope facility operated by the California Institute of Technology and is supported by NSF grant AST 9981546. to search for CO emission between 2001 January and April. A total of 23 hours of usable integration time on source was obtained in two configurations of six 10.4m telescopes. The array configurations yielded a synthesized beam adopting natural-weighting. We used a digital correlator configured with MHz channels centered on 98.5174 GHz to search for CO(32) emission at the corresponding H line redshift of . The spectral-line bandwidth corresponds to 1400 (), which is sufficiently large to observe the entire H line width, including the redshift uncertainty (Sec. 3.1). In addition to the CO line data, 3mm continuum data were recorded with a bandwidth of 2 GHz. The nearby quasar J0433+053 was observed every 25 minutes for gain and phase calibration. Absolute flux calibration was determined from observations of the standard calibrator 3C 273 whose flux history is monitored by observations of Uranus and Neptune. The absolute flux calibration uncertainty for the data is approximately 15%. The data were reduced using the OVRO MMA software (Scoville et al. 1983) and standard tasks in AIPS.444AIPS is the Astronomical Image Processing System sofware package written and supported by the National Radio Astronomy Observatory.
3. RESULTS
The identification of N4 as the sub-mm counterpart is fairly secure based on previous studies. As discussed by Smail et al. (1999), the nearby spiral galaxy can be reliably ruled out based on its radio/sub-mm flux density ratio and its 450m limit. The random probability of finding a bright ERO similarly as red () as N4 within the positional uncertainty of the SCUBA data is less than 0.1%, based on the observed ERO surface densities for (Thompson et al. 1999; Smith et al. 2002). If we relax the sub-mm positional uncertainty and account for lensing, the likelihood of a chance coincidence with an ERO is still less than 1%, and no other candidate red objects are nearby. The identification of N4 as the sub-mm counterpart has recently been confirmed by the detection of CO emission from N4 at the H redshift with the IRAM PdB interferometer (R. Neri et al. 2003, in preparation). The OVRO CO upper-limit presented in this paper is consistent with the more sensitive PdB observations.
3.1. Spectroscopy
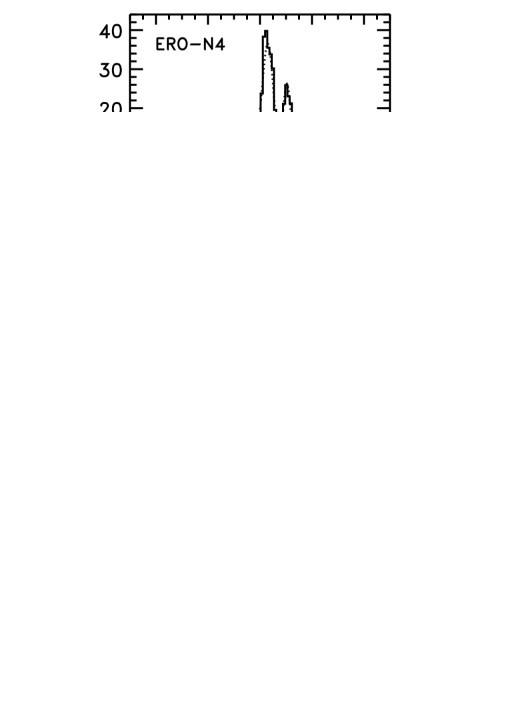
An emission-line complex is clearly detected in the K-band spectrum of N4 (Fig. 2), which is identified as H[NII] at . We also detect evidence for a weak emission line at 1.756m, which corresponds to [OIII] 5007Å at the H redshift (Fig. 3). Fits to the lines and continuum were made using the SPECFIT package in IRAF (Table 2). In fitting the H[NII] line complex, we have allowed the widths and fluxes of the H and [NII]6583Å lines to be free, while fixing the [NII]6548Å line to have a flux of 30% that of [NII]6583Å. Both [NII] lines were constrained to have the same FWHM. The continuum was fitted with a linear function. Initially the position of the [NII]6583Å line was fixed with respect to H, but this requirement was later relaxed to derive the redshift and to confirm the identification. From the fit to the total K-band spectrum, we derive a redshift of based on the H and NII 6583 lines. The redshift uncertainty includes the error from the fit and the systematic uncertainty associated with the derived wavelength scale. The intrinsic H line width is , corrected for instrumental resolution, while the [NII] lines are slightly narrower, having an intrinsic FWHM of . The [NII] 6583/H line flux ratio is found to be . No broad-line H component is readily visible in the data. The 1 upper-limit on a broad H line is about 10% of the H narrow-line flux.
The H-band data were fitted adopting the same techniques as used for the K-band data. The [OIII] line was fitted to derive the wavelength position, line width, and line flux. In deriving the H limit, we assumed the H redshift and linewidth. The observed limit on the [OIII]5007/H flux ratio is greater than 1.5 ().
The observed Balmer decrement of H/H () implies significant extinction. Assuming the standard intrinsic H/H value of 2.85 (Case-B Balmer recombination decrement for T K and N cm-3 [Osterbrock 1989]) and the Galactic reddening function parameterized by Lequeux et al. (1979), we derive an extinction at H of greater than mag and a color excess of E(B-V) mag. The high-level of extinction implied by the H/H ratio is consistent with the non-detection of Ly emission from the ESI observations (Table 2).
Figure 4 shows the two-dimensional image of the K-band spectrum. The H emission is spatially resolved, while the [NII] emission is consistent with a compact object. The size of H emission region is about 1.1 arcsec, after deconvolution with a Gaussian representing the seeing point spread function. Corrected for lensing, the intrinsic diameter of the detected H emission regions is about 2 kpc. If the observed velocity gradient is due to rotation, a rough estimate of the dynamical mass can be made based on the H line width. The H emission is spread over 750 (FWZI), and using a radius of 1.0 kpc we calculate a dynamical mass of , where the inclination () is unknown. The estimated dynamical mass of N4 is comparable with masses found in the central regions of normal galaxies in the local universe.
Figure 5 shows spectra extracted from the different regions of N4. The [NII] 6583/H line flux ratio varies measurably as a function of distance from the nucleus of N4. The off-nuclear data have a [NII] 6583/H line flux ratio of , consistent with star-forming regions, while the nuclear region has a much higher ratio of , indicative of an AGN or a LINER (Osterbrock 1989). Therefore, the data for N4 are consistent with a narrow-line AGN surrounded by an extended region of active star-formation (Baldwin, Phillips, & Terlevich 1981; Veilleux & Osterbrock 1987) or a powerful starburst with large-scale nuclear shocks driven by a nuclear superwind. (Armus, Heckman, & Miley 1989; Heckman, Armus, & Miley 1990) .
3.2. Imaging
The sensitive HST R-band (F702W filter) and Keck LRIS I-band images of N4 have been previously discussed by Smail et al. (1999). We compare these optical images with the deep J- and K-band data presented in this paper. In all bands we subtracted the nearby galaxy using the IRAF task ELLIPSE, which enabled source masking while successfully removing the wings of the galaxy emission. The images were aligned using common sources in the frames. For optimization in K-band, we adopted a diameter aperture for photometry. Although the S/N ratios from the aperture measurements in the other bands are lower than for K-band (Table 3), the emission peak was detected in each of the four bands with a S/N ratio greater than five. The errors on the measurements represent the rms of multiple aperture measurements on the sky around N4, avoiding the galaxy residuals from the central disk. We measure the colors of mag and mag for N4. The measurement presented here is slightly bluer than the original color quoted by Smail et al. (1999), which is attributed to the difference in the adopted aperture size and methods of galaxy subtraction.
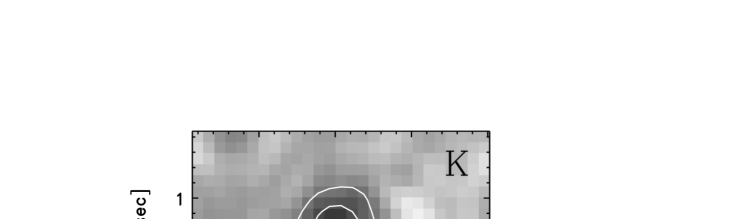
We have resolved N4 in both the R and K-band images (Fig. 6). After deconvolution of the stellar PSF, approximated by a Gaussian, we derive a FWHM size of for the K-band emission, consistent with the H source size (Sec. 3.1). The K-band image is extended in the north-south direction, along the expected direction of lensing amplification, while the R-band image appears extended east-west. The K-band peak is marginally offset along the line of R-band elongation, but its derived position is coincident with the R-band peak within the errors. Offsets between the K-band and R-band emission regions are not unexpected given the high level of extinction within N4 and given previous results for sub-mm galaxies (Ivison et al. 2001).
3.3. Dust and Molecular Gas
The OVRO CO observations yield a 3 upper-limit of 4.5 mJy/beam, averaging over the H line-width of 520 with a natural-weighted beam size of . The limit on the integrated CO(32) flux density of corresponds to a CO luminosity of , correcting for lensing. The CO to H2 conversion factor is still uncertain for the sub-mm population. Adopting a conversion factor of , which is appropriate for low redshift ULIRGs (Solomon et al. 1997; Scoville, Yun, & Bryant 1999), the observations imply M(gas) for N4. The limit on the gas mass is comparable to the total dynamical mass estimated from the H line-width (Sec. 3.1). The CO(32) luminosity limit is slightly lower than the previous CO detections for sub-mm selected galaxies (Frayer et al. 1998, 1999), after converting to the same cosmology, but is well within expectations given the lower m flux density for N4.
We failed to detect 3mm continuum emission from N4, achieving a 3 upper-limit of S(100 GHz) mJy. The 3mm continuum limit is consistent with the previous SCUBA measurements of N4 (Smail et al. 1999). The spectral energy distribution (SED) for N4 is consistent with those found for previous sub-mm galaxies (Ivison et al. 2000) and local ULIRGs. Based on its redshift and the limit on its 850m/1.4GHz flux ratio, we estimate a dust temperature of T K from the Carilli & Yun (1999) relationship plotted as a function of temperature by Blain et al. (2002). The dust temperature is consistent with both cool and warm infrared SEDs found for ULIRGs (Soifer et al. 1989).
4. DISCUSSION
As mentioned in Section 3, the rest-frame optical emission-line flux ratios of N4 imply a composite source. The relatively large nuclear [NII]/H and [OIII]/H ratios are suggestive of a non-thermal ionizing source, although we cannot rule out shock excitation from a wind. The spatially-resolved H line emission and the lower off-nuclear [NII]/H ratio suggest a change to hot stars as the dominant source of ionizing photons outside the nucleus.
The observed [NII] 6583/H and [OIII] 5007/H line ratios for N4 are consistent with the average values found in low redshift ULIRGs with L, albeit there is a large range of ratios found for local ULIRGs (Veilleux et al. 1999). The limits on the [OI] 6300 and [SII] 6716,6731 lines do not provide any additional constraints favoring one classification over another. Unfortunately, the [OI] 6300 line for N4 is redshifted to the wavelength of the Pa from the foreground galaxy. Although there is tentative evidence for [OI] 6300 emission even after careful galaxy subtraction, no robust measurement could be derived for this line. The H equilvalent width (EQW) and relatively narrow line width suggest that N4 does not contain a broad-line Type-I AGN, or that the broad-line region is heavily obscured. A higher S/N spectrum would be required to place more stringent limits on the H broad-line flux from N4.
The only X-ray data that currently exists for N4 are from ROSAT, and these data are not sensitive enough to constrain the fraction of the bolometric luminosity which may arise from an AGN. Given the unknown contribution from a possible AGN and the uncertainty in the level of extinction, the star-formation rate (SFR) is fairly uncertain for N4. We can derive upper and lower bounds on the SFR based on the H and sub-mm emission. The off-nuclear H line luminosity uncorrected for extinction provides a lower-limit on the SFR in N4. At the observed resolution, approximately 40% of the total H emission is outside the nucleus. This off-nuclear H emission corresponds to a line luminosity of L(H, corrected for lensing. Adopting a standard relationship between the H line luminosity and the SFR (Kennicutt 1983), we find that SFR in N4 is greater than , uncorrected for extinction. Unfortunately, the H limit is not sensitive enough to provide a useful estimate of the extinction level outside the nucleus. For comparison, the total H line luminosity corrected for the extinction found from the limit on the Balmer decrement would imply a total SFR of .
A upper-limit to the SFR can be derived by assuming that all the far-infrared (FIR) radiation is due to star-formation, neglecting any contribution due to a possible AGN. The FIR luminosity for N4 is derived assuming that its SED is somewhere between that of the infrared-warm ULIRG Mrk 231 and the infrared-cool ULIRG Arp 220. Placing these ULIRGs at the redshift of N4 and scaling to the de-lensed 850m flux of N4, we estimate an intrinsic FIR luminosity of L(FIR)2–5 for N4. This FIR luminosity corresponds to a SFR of massive stars of SFR(M200–500, using the relationship given by Condon (1992). Including the presence of lower mass stars with the IMF adopted by Kennicutt (1983), we obtain a total SFR800–2000. Hence, from the H and sub-mm emission, the star-formation rate of N4 is probably at least and could be as large as .
Despite the high level of obscuration inferred for the sub-mm galaxies, the recent Ly detections of radio-selected sub-mm sources by Chapman et al. (2003) suggest that significant rest-frame UV light can escape from the sub-mm sources. For N4 we failed to detect Ly emission. The sensitivity of the ESI observations would have been sufficient to detect many of the Ly sources seen by Chapman et al. (2003). However, given the fact that the Ly/H ratio can span three orders of magnitudes for ULIRGs ( – 10; HST STIS observations by Surace et al. 2003, in preparation), the observed limit of Ly/H for N4 is not particularly constraining.
N4 has a composite spectrum consisting of a narrow-line AGN/LINER nucleus surrounded by a resolved starburst. Other well-studied sub-mm galaxies have shown a wide range of characteristics. The system SMM J02399-0126 at shows an AGN spectrum (Ivison et al. 1998) which has been classified as broad absorption line QSO (Vernet & Cimatti 2001), while SMM J14011+0252 at shows no evidence of an AGN and is thought to be dominated by star formation (Barger et al. 1999; Ivison et al. 2000). The most distant know sub-mm galaxy SMM J09431+4700 () contains a narrow-line Seyfert-1 AGN (Ledlow et al. 2002), and the sub-mm galaxy N2 850.4 () is a composite source (AGN+starburst) showing strong outflows and P-Cygni profiles indicative of stellar winds (Smail et al. 2003). All of these sub-mm galaxies are significantly more luminous than N4 and can be classified as hyperluminous sources (). It may not be surprising that most these of the hyperluminous sub-mm sources contain AGN given that this is seen at lower redshifts (e.g., Evans et al. 1998). The results for N4 suggest that even the lower luminosity sub-mm sources could also be partially powered by AGN.
Although there is evidence for AGN in many sub-mm sources, the bulk of the infrared light for the high-redshift sub-mm population is still thought to be dominated by star-formation (Blain et al. 1999b, 2002). The X-ray data support this conclusion (Barger et al. 2001; Alexander et al. 2003; Almaini et al. 2003). The deepest X-ray data from Alexander et al. (2003) suggest that even though a significant faction of the bright sub-mm sources contain an AGN, the AGN typically have low luminosities and contribute negligibly to the total bolometric luminosity of the population.
In the local universe, the apparent fraction of AGN dominated ULIRGs increases at luminosities above L (Veilleux et al. 1999). It is unclear if the high-redshift sub-mm population of galaxies will follow this trend. The relative importance of AGN and star-formation activity in the sub-mm population will be constrained with future sensitive X-ray observations, SIRTF observations that will distinguish between infrared warm (AGN) versus cool (starburst) sub-mm galaxies, and high-resolution mm and CO interferometric observations that will constrain gas masses and source sizes.
5. CONCLUSIONS
We report the redshift of for the counterpart of the sub-mm galaxy N4. We have detected the H, [NII], and [OIII] lines and present upper-limits for Ly, H, and CO(32) lines. The line ratios and observed SED are consistent with the range of properties found in local ULIRGs. The data show that N4 is comprised of a nuclear region showing a LINER/Type-II AGN spectrum with an extended H component, presumably arising from an extended starburst. It is still unclear whether N4 is predominately powered by AGN or star-forming activity. Future multi-wavelength observations should provide better constraints on the source of its immense luminosity.
References
- (1)
- (2) Alexander, D. M., et al. 2003, AJ, 125, 383
- (3)
- (4) Almaini, O., et al. 2003, MNRAS, 338, 303
- (5)
- (6) Armus, L., Heckman, T. M., & Miley, G. K. 1989, ApJ, 347, 727
- (7)
- (8) Baldwin, J. A., Phillips, M. M., & Terlevich, R. 1981, PASP, 93, 5
- (9)
- (10) Barger, A. J., Cowie, L. L., Sanders, D. B., Fulton, E., Taniguchi, Y., Sato, Y., Kawara, K., & Okuda, H. 1998, Nature, 394, 248
- (11)
- (12) Barger, A. J., Cowie, L. L., Smail, I., Ivison, R. J., Blain, A. W., & Kneib, J.-P. 1999, AJ, 117, 2656
- (13)
- (14) Barger, A. J., Cowie, L. L., Steffen, A. T., Hornschemeier, A. E., Brandt, W. N., & Garmire, G. P. 2001, ApJ, 560, L23
- (15)
- (16) Blain, A. W., Kneib, J.-P., Ivison, R. J., & Smail, I. 1999a, ApJ, 512, L87
- (17)
- (18) Blain, A. W., Smail, I., Ivison, R. J., & Kneib, J.-P. 1999b, MNRAS, 302, 632
- (19)
- (20) Blain, A. W., Smail, I., Ivison, R. J., Kneib, J.-P., & Frayer, D. T. 2002, Physics Reports, 369, 111
- (21)
- (22) Carilli, C. L., & Yun, M. S. 1999, ApJ, 513, L13
- (23)
- (24) Chapman, S. C., et al. 2003, Nature, in press
- (25)
- (26) Condon, J. J. 1992, ARA&A, 30, 575
- (27)
- (28) Cowie, L. L., Barger, A. J., Kneib, J.-P, 2002, AJ, 123, 2197
- (29)
- (30) Eales, S., Lilly, S., Gear, W., Dunne, L., Bond, J. R., Hammer, F., Le Fèvre, O., & Crampton, D. 1999, ApJ, 515, 518
- (31)
- (32) Evans, A. S., Sanders, D. B., Cutri, R. M., Radford, S. J. E., Surace, J. A., Solomon, P. M., Downes, D., & Kramer, C. 1998, ApJ, 506, 205
- (33)
- (34) Dunlop, J. S., et al. 2003, MNRAS, submitted (astro-ph/0205480)
- (35)
- (36) Frayer, D. T., Smail, I., Ivison, R., J., & Scoville, N. Z. 2000, AJ, 120, 1668
- (37)
- (38) Frayer, D. T., et al. 1999, ApJ, 514, L13
- (39)
- (40) Frayer, D. T., Ivison, R., J., Scoville, N. Z., Yun, M., Evans, A. S., Smail, I., Blain, A. W., &, Kneib, J.-P. 1998, ApJ, 506, L7
- (41)
- (42) Gear, W. K., Lilly, S. J., Stevens, J. A., Clements, D. L., Webb, T. M., Eales, S. A., & Dunne, L. 2000, MNRAS, 316, L51
- (43)
- (44) Genzel, R., et al. 1998, ApJ, 498, 579
- (45)
- (46) Heckman, T. M., Armus, L., & Miley, G. K. 1990, ApJS, 74, 833
- (47)
- (48) Hughes, D., et al. 1998, Nature, 394, 241
- (49)
- (50) Ivison, R. J., Smail, I., Barger, A. J., Kneib, J.-P., Blain, A. W., Owen, F. N., Kerr, T. H., & Cowie, L. L. 2000, MNRAS, 315, 209
- (51)
- (52) Ivison, R. J., Smail, I., Frayer, D. T., Kneib, J.-P., & Blain, A. W. 2001, ApJ, 561, L45
- (53)
- (54) Ivison, R. J., Smail, I., Le Borgne, J.-F., Blain, A. W., Kneib, J.-P., Bézecourt, J., Kerr, T. H., & Davies, J. K. 1998, MNRAS, 298, 583
- (55)
- (56) Kennicutt, R., C., Jr. 1983, ApJ, 272, 54
- (57)
- (58) Ledlow, M. J., Smail, I., Owen, F. N., Keel, W. C., Ivison, R. J., & Morrison, G. E. 2002, ApJ, 577, L79
- (59)
- (60) Lequeux, J., Peimbert, M., Rayo, J. F., Serrano, A., & Torres-Peimbert, S. 1979, A&A, 80, 155
- (61)
- (62) Lutz, D., et al. 2001, A&A, 378, 70
- (63)
- (64) Massey, P., Strobel, K., Barnes, J. V., Anderson, E. & Gronwall, C. 1988, ApJ, 328, 315
- (65)
- (66) Matthews, K., & Soifer, B. T. 1994, Infrared Astronomy with Arrays: the Next Generation, ed. I. McLean (Dordrecht: Kluwer Academic Publishers), 239
- (67)
- (68) McLean, I. S., et al. 1998, Proc. SPIE, 3354, 566
- (69)
- (70) Osterbrock, D., E. 1989, Astrophysics of Gaseous Nebulae and Active Galactic Nuclei, (Mill Valley: University Science Books)
- (71)
- (72) Persson, S. E., Murphy, D. C., Krzeminski, W., Roth, M., & Rieke, M. J. 1998, AJ, 116, 2475
- (73)
- (74) Sanders, D. B., & Mirabel, I. F. 1996, ARA&A, 34, 749
- (75)
- (76) Scott, S. E., et al. 2002, MNRAS, 331, 817
- (77)
- (78) Scoville, N. Z., Yun, M. S., & Bryant, P. M. 1997, ApJ, 484, 702
- (79)
- (80) Scoville, N. Z., Carlstrom, J. E., Chandler, C. J., Phillips, J. A., Scott, S. L., Tilanus, R. P. J., & Wang, Z. 1993, PASP, 105, 1482
- (81)
- (82) Sheinis, A.I., Bolte, M., Epps, H. W., Kibrick, R. I., Miller, J. S., Radovan, M. V., Bigelow, B. C., Sutin, B. M. 2002, PASP, 114, 851
- (83)
- (84) Smail, I., Chapman, S. C., Ivison, R. J., Blain, A. W., Takata, T., Heckman, T. M., Dunlop, J. S., & Sekiguchi, K., 2003, MNRAS, submitted (astro-ph/0303128)
- (85)
- (86) Smail, I., Ivison, R. J., & Blain, A. W. 1997, ApJ, 490, L5
- (87)
- (88) Smail, I., Ivison, R. J., Blain, A. W., & Kneib, J.-P. 2002, MNRAS, 331, 495
- (89)
- (90) Smail, I., Ivison, R. J., Kneib, J.-P., Cowie, L. L., Blain, A. W., Barger, A. J., Owen, F. N., & Morrison, G. 1999, MNRAS, 308, 1061
- (91)
- (92) Smail, I., Ivison, R. J., Owen, F. N., Blain, A. W., & Kneib, J.-P. 2000, ApJ, 528, 612
- (93)
- (94) Smith, G. P., et al. 2002, MNRAS, 330, 1
- (95)
- (96) Soifer, B. T., Boehmer, L., Neugebauer, G., & Sanders, D. B. 1989, AJ, 98, 766
- (97)
- (98) Solomon, P. M., Downes, D., Radford, S. J. E., & Barrett, J. W. 1997, ApJ, 478, 144
- (99)
- (100) Thompson, D., et al. 1999, ApJ, 523, 100
- (101)
- (102) Veilleux, S., Kim, D.-C., & Sanders, D. B. 1999, ApJ, 522, 113
- (103)
- (104) Veilleux, S., & Osterbrock, D. E. 1987, ApJS, 63, 295
- (105)
- (106) Vernet, J. & Cimatti, A. 2001, A&A, 380, 409
- (107)
- (108) Webb, T. M., et al. 2003, ApJ, submitted (astro-ph/201181)
- (109)
- (110) Wehner, E. H., Barger, A. J., & Kneib, J.-P. 2002, ApJ, 577, L83
- (111)
| UT Date(s) | Telescope | Instrument | Line, Continuum | Integration Time |
|---|---|---|---|---|
| 1999 Oct 01 | Keck I | NIRC | 2.2m | 10 min |
| 2000 Dec 26 | Keck II | NIRSPEC | H | 130 min |
| 2001 Jan-May | OVRO | 3mm SIS Mixer | CO(32) , 3mm | 1380 min |
| 2001 Aug 29 | Keck I | NIRC | 2.2m | 12 min |
| 2001 Aug 29-31 | Keck I | NIRC | 1.2m | 74 min |
| 2002 Aug 08-09 | Keck II | ESI | Ly | 110 min |
| 2002 Aug 16 | Keck II | NIRSPEC | [OIII],H | 70 min |
| Line | FWHM bbIntrinsic FWHM corrected for instrumental resolution. | EQW ccRest-frame EQW. | Flux | |
|---|---|---|---|---|
| (Å) | (Årest) | ( erg s-1 cm-2) | ||
| H | 230305 | 52040 | 664 | 15.81.0 |
| [NII] 6583 | 231025 | 44060 | 324 | 7.40.9 |
| [OIII] 5007 | 175608 | 580160 | 419 | 4.00.8 |
| H | … | … | … | ddAll limits assume an intrinsic FWHM line width found for the H line. |
| L | … | … | … | ddAll limits assume an intrinsic FWHM line width found for the H line. |
| CO(32) | … | … | … | ()ddAll limits assume an intrinsic FWHM line width found for the H line. |
| Observed BandaaAll magnitudes are on the Vega scale, are measured with a 2 diameter aperture, and are uncorrected for lensing. | Measured Value | Notes |
|---|---|---|
| R | 25.750.25 | HST (F702W) |
| I | 26.50.6 | Keck LRIS |
| J | 22.560.28 | Keck NIRC |
| K | 19.410.09 | Keck NIRC |
| 850m | 7.21.7 mJy | Smail et al. (1999) |
| 450m | mJy () | Smail et al. (1999) |
| 3 mm | mJy () | OVRO |
| 20 cm | Jy () | Smail et al. (1999) |