Planetary migration in protoplanetary disks
Abstract
In the current paper, we further develop the model for the migration of planets introduced in Del Popolo et al. (2001) and extended to time-dependent planetesimal accretion discs in Del Popolo & Ekşi (2002). We use a method developed by Stepinski & Valageas (1996, 1997), that is able to simultaneously follow the evolution of gas and solid particles for up to . The disc model is coupled to the migration model introduced in Del Popolo et al. (2001) in order to obtain the migration rate of the planet in the planetesimal disc. We find that in the case of discs having total mass of , and , planets can migrate inward a large distance while if the planets remain almost in their initial position for and only in the case the planets move to a minimum value of orbital radius of . The model gives a good description of the observed distribution of planets in the period range 0-20 days.
Dipartimento di Matematica, Università Statale di Bergamo, Piazza Rosate, 2 - I 24129 Bergamo, ITALY
Feza Gürsey Institute, P.O. Box 6 Çengelköy, Istanbul, Turkey
1. Introduction
In order to study the formation of planetary systems it is necessary to study the global evolution of solid material which constitutes, together with gas, the protoplanetary discs. In the following, we introduce a time-dependent accretion disc model that shall be used in the next sections to study planets migration.
It is usually assumed that the surface density in planetesimals is proportional to that of gas (Lin & Papaloizou (1980, page 47); Murray et al. (1998)) and that the spatial structure and the time evolution of the surface density, , is such that . Although this approximation has been and is widely used in literature, a better way to proceed is to directly calculate the evolution of solids in the disc. We know that the evolution of the surface density of gas is described by a diffusive-type equation, while that of solid particles is an advection-diffusion equation:
| (1) |
where , the Schmidt number, Sc, is given by:
| (2) |
where is the relative velocity between a particle and the gas, the turbulent velocity, is the Keplerian angular velocity, the so called stopping time.
Stepinski & Valageas (1996, 1997) developed a method that, using a series of simplifying assumptions, is able to simultaneously follow the evolution of gas and solid particles due to gas-solid-coupling, coagulation, sedimentation, and evaporation/condensation for up to .
The equation of gas evolution is solved by means of an implicit scheme and the evolution of gas is computed independently from the evolution of particles. At every time step the quantities needed for evaluating the change in the mass distribution of solids are calculated and the change itself is computed from Eq. (1) using the operator splitting method. In such a method the advective term in Eq. (1) is treated by the numerical method of characteristics, whereas an implicit scheme is applied to the diffusion term. The obtained distribution of solid material is then modifed because of the existence of the evaporation radius, and the mass distribu- tion of the vapor is calculated using the implicit scheme. Finally, the new particle size distribution is calculated be- fore proceeding to the next time step.
We suppose that a single planet moves in a planetesimal disc under the influence of the gravitational force of the Sun. The equation of motion of the planet can be written as:
| (3) |
(Melita & Woolfson 1996), where the term represents the force per unit mass from the Sun, while is the dissipative force (the dynamical friction term-see Melita & Woolfson 1996).
In order to take into account dynamical friction, we need a suitable formula for a disc-like structure such as the protoplanetary disc.
We assume that the matter-distribution is disc-shaped, then we have that:
| (4) |
where and are two versors parallel and perpendicular to the disc plane and and are given in Del Popolo & Ekşi (2002).
2. Results
Our model starts with a fully formed gaseous giant planet of
at AU.
According to several evidences showing that the disc lifetimes range
from
yr to yr (Strom et al. 1993; Ruden & Pollack 1991),
we assume that the disc has a nominal effective lifetime of
years (Zuckerman et al. 1995).
We integrated the model introduced in the previous section for
several values of disc
masses: , 0.01, 0.001, 0.0001 , and several values of .
The results of the disc model are plotted in Fig.1. Fig. 1a shows the evolution of the density of the gas component of the disc in the case and (see figure). As shown in Fig. 1b, in agreement with Stepinski & Valageas (1997) and Kornet et al. (2001), the most important result of the low-mass models calculation (discs with , and angular momentum ) is that such models lead to the survival of solid material, as can be seen from the evolution of the particle size, or by the emergence of the converged, nonvanishing surface density distribution of solids.
In the successive figures (2a-2d), we plot the evolution of semi-major axis of the planet (see figure). Summarizing figures 2a-2d, according to the final distribution of planets distances, the present model predicts that, unless the disc mass is very small , planets tend to move close to the central star to distances of the order of . It is also evident that it is possible to find a planet at any distance from their locations of formation and very small distances from the parent star for peculiar values of the parameters and .
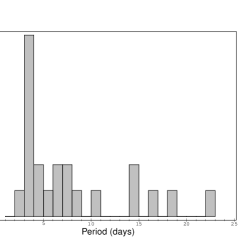
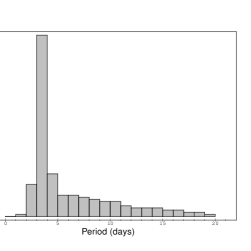
In Fig. 3a, in order to show the predictions of the model for what concerns the distribution of planets in the inner part of the disc, we plot the fraction of planets in the orbital period range 0-20 days calculated using the model of this paper. Fig. 3b, represents the same distribution obtained with the data given in www.exoplanets.org (see also Kuchner & Lecar 2002).
According to Kuchner & Lecar 2002, disc temperature determines the orbital radii of the innermost surviving planets, similarly to our model. As streseed in DP1, DP2, the model has not the drawback of Murray et al. 1998 model, namely that of requiring a too large disc mass for migration and at the same time has the advantage of Murray et al. 1998 model of having an intrinsic natural mechanism that provides halting of migration.
References
- 2001 Del Popolo, A., Gambera, M., E. N. Ercan, 2001, MNRAS, 325, 1402
- 2001 Del Popolo, A., Ekşi, Y., E. 2002, MNRAS, 332, 485
- 1 Kornet, K., Stepinski, T. F., R zyczka, M, 2001, A&A 378, 180
- 2 Kuchner, M.J., Lecar, M., 2002, astro-ph/0206232
- 3 Lin D.N.C, Papaloizou J., 1980, MNRAS, 191
- 4 Melita M.D., Woolfson M.M., 1996, MNRAS 280, 854
- 1998 Murray, N., Hansen, B., Holman, M., Tremaine, S., 1998, Science 279, 69
- 1991 Ruden, S.P, Pollack, J.B., 1991, ApJ 375, 740
- 1996 Stepinski, T.F., Valageas, P., 1996, A&A 309, 301
- 5 Stepinski, T.F., Valageas, P., 1997, A&A 319, 1007
- 1995 Zuckerman, B., Forveille, & Kastner, J.H., 1995, Nature 373, 494
(1a)
 (1b)
(1b)

(2a)
 (2b)
(2b)

(2c)
 (2d)
(2d)

(3a)
 (3b)
(3b)