CII∗ ABSORPTION IN DAMPED Ly SYSTEMS: (I) STAR FORMATION RATES IN A TWO-PHASE MEDIUM
Abstract
We describe a technique that for the first time measures star formation rates (SFRs) in damped Lyman alpha systems (DLAs) directly. We assume that massive stars form in DLAs, and that the FUV radiation they emit heats the gas by the grain photoelectric mechanism. We infer the heating rate by equating it to the cooling rate measured by the strength of CII∗ 1335.7 absorption. Since the heating rate is proportional to the product of the dust-to-gas ratio, the grain photoelectric heating efficiency, and the SFR per unit area, we can deduce the SFR per unit area for DLAs in which the cooling rate and the dust-to-gas ratio have been measured. We consider models in which the dust consists of carbonaceous grains and silicate grains. We present two phase models in which the cold neutral medium (CNM) and warm neutral medium (WNM) are in pressure equilibrium. In the CNM model the line of sight passes through CNM and WNM gas, while in the WNM model the line of sight passes only through WNM gas. Since the grain photoelectric heating efficiency is at least an order of magnitude higher in the CNM than in the WNM, most of the CII∗ absorption arises in the CNM in the CNM model. By contrast, in the WNM model all of the CII∗ absorption arises in the WNM. We use the measured CII∗ absorption lines to derive the SFR per unit area for a sample of 30 DLAs in which the dust-to-gas ratio has been inferred from element depletion patterns. We show that the inferred SFR per unit area corresponds to an average over the star forming volume of the DLA rather than to local star formation along the line of sight. We obtain the average SFR per unit area and show that it equals 10-2.2 M⊙yr-1kpc-2 for the CNM solution and 10-1.3 M⊙yr-1kpc-2 for the WNM solution. Interestingly, the SFR per unit area in the CNM solution is similar to that measured in the Milky Way ISM.
submitted to the Astrophysical Journal Nov.5,2002
1 INTRODUCTION
Star formation is a key ingredient in the formation and evolution of galaxies. The idea that the Hubble sequence is actually a sequence in present-day star formation rates (SFRs) and past star formation histories (Roberts 1963) is supported by results of population synthesis models (Tinsley 1980) and by the use of precise diagnostics of SFRs such as emission-line fluxes (Kennicutt 1983), and UV continuum luminosities. According to this interpretation, late-type Sc galaxies are characterized by low SFRs that are independent of time, while in early-type Sa galaxies an initially high SFR decreases steeply with time (Kennicutt 1998). Star formation may also influence galaxy evolution through feedback. That is, shocks generated by supernova explosions heat gas in protogalaxies, thereby delaying cooling and collapse to rotating disks. This process has been invoked in hierarchical cosmologies in order to prevent the collapse of too many baryons into low-mass dark matter halos, and to explain the angular momentum distribution of current galaxy disks (Efstathiou 2000).
A direct measurement of star formation in high redshift galaxies would provide an independent test of these ideas. Madau et al. (1996) took a crucial first step in this direction when they reconstructed star formation histories by measuring the comoving luminosity density of star-forming galaxies as a function of redshift. While the original “Madau diagrams” exhibited a peak in star formation at 12, more recent analyses, which are based on larger samples of galaxies and correct for extinction of emitted starlight by dust, show no evidence for such a peak. Rather, the SFR per unit comoving volume, , increases by a factor of 10 in the redshift interval =[0,1] and either remains constant out to the highest redshifts confirmed so far 6 (Steidel et al. 1999) or keeps increasing to even higher redshifts (Lanzetta et al. 2002). However, the galaxies from which these results are derived are unlikely to be the progenitors of the bulk of the current galaxy population. Whereas the star formation rate per unit area for the Milky Way Galaxy is given by 410-3 M (Kennicutt 1998), the comoving SFR at 3 is inferred from the Lyman Break galaxies, a highly luminous population of star forming objects in which 1 M (Pettini et al. 2001). The Galaxy was unlikely to be this bright in the past, as stellar population studies predict that at 3, 210-2 M for Sb galaxies such as the Milky Way. In fact only ellipticals are predicted to have 1 M at 3 (see Genzel et al. 2001). This is consistent with other independent lines of evidence such as strong clustering (Adelberger et al. 1998), which suggests the Lyman Break galaxies evolve into massive ellipticals in rich clusters. As a result, the published Madau diagrams need not constrain the star formation history of normal galaxies or their progenitors.
This is the first of two papers in which we present a new technique for measuring SFRs in DLAs. The idea is to infer the SFR from the rate at which neutral gas in DLAs is heated. We determine the heating rate by equating it to the cooling rate; i.e., we assume steady-state conditions (see 4). We estimate the cooling rate from [C II] 158 m emission, the dominant coolant for the Milky Way ISM (Wright et al. 1991). Specifically, we measure the cooling rate per H atom from the strength of C II∗ 1335.7 absorption. As we shall show, it is plausible to assume the heating rate is proportional to the mean intensity of far UV (FUV) radiation, which is proportional to for a plane parallel layer. The goal of this paper is to determine the mean star formation rate per unit physical area, , for a given redshift bin. In the second paper (Wolfe et al. 2003; hereafter Paper II) we combine with the incidence of DLAs per unit redshift to obtain () for our DLA sample. The advantage of our method is this: Because DLAs are not drawn from a flux limited sample of galaxies, we are able to derive values far below those determined from radiation emitted by rapidly star forming objects such as Lyman Break galaxies. Rather, we will show that our technique is sensitive to as low as 110-4 M; i.e., to SFRs per unit area below the flux thresholds of detectors on 10 m class telescopes.
A further advantage of our technique is that it probes the physical state of neutral gas at high redshifts. Specifically, from our determination of the heating rate we compute the thermal equilibrium of the neutral gas. By analogy to models for the ISM (here and throughout the paper ISM refers to the interstellar medium of the Milky Way Galaxy) our calculations predict a two-phase medium comprising a cold ( 80 K) neutral medium (CNM) and a warm ( 8000 K) neutral medium (WNM) in pressure equilibrium with each other. We consider two models: one in which the line of sight to the QSO encounters gas in both CNM and WNM phases and another in which it encounters only the WNM phase. The WNM model is considered because of recent arguments that DLAs consist only of WNM gas (Norman & Spaans 1997; Liszt 2002; and Kanekar & Chengalur 2001). We find that the technique is insensitive to the masses and sizes of individual DLAs. This has the advantage that the results are not critically dependent on model assumptions such as the mass or length scale of the dark matter mass distribution (e.g. Prochaska & Wolfe 1997; Haehnelt et al. 1998).
The paper is organized as follows. In 2 we describe the basic strategy for inferring the SFR per unit area from measurements of C II∗ 1335.7 absorption lines. We present data for 33 DLAs obtained mainly with the HIRES echelle spectrograph (Vogt et al. 1994) on the Keck I 10 m telescope in 3. 4 presents two-phase models for the neutral gas in DLAs. We explain how radiative excitations cause the [C II] 158 m emission rate to exceed the 158 m cooling rate. In 5 solutions to the transfer equation for FUV radiation are given. We use these solutions to predict heating rates as functions of and dust-to-gas ratio. For each DLA we measure by combining measurements of heating rate and dust-to-gas ratio with the solutions. We then determine for two redshift bins drawn from the full sample of 33 DLAs. The significance of these measurements is they refer to objects representative of the protogalactic mass distribution; i.e., objects likely to evolve into normal galaxies. In 6 we test the assumptions of our dust models for self consistency. A summary and concluding remarks are presented in 7.
2 THE IDEA
Our technique is based on the idea that massive stars form out of gas in DLAs. Evidence for this stems from the physical resemblance between DLAs and the neutral gas of the ISM, the presence of heavy elements in DLAs, and the fact that DLAs in the redshift interval = [2,3] contain sufficient baryons in the form of neutral gas to account for all the visible stars in current spiral galaxies (Storrie-Lombardi & Wolfe 2000). Although stars likely form out of molecular rather than atomic gas, and molecules are rarely detected in DLAs (Lu et al. 1997; Petitjean et al. 2000), the presence of heavy elements argues for the formation of massive stars in DLAs. Such stars emit FUV radiation ( eV) that illuminates dust grains known to be present in the gas (Pei & Fall 1995; Prochaska & Wolfe 2002; hereafter PW02). By analogy with the Milky Way ISM, a small fraction of the incident photon energy is transferred to photo-ejected electrons that heat the gas via Coulomb interactions with ambient electrons (e.g. Bakes & Tielens 1994; Wolfire et al. 1995 [hereafter W95]). In this case the heating rate per H atom at displacement vector is given by
| (1) |
In the last equation ()()DLA/, where ()DLA is the dust-to-gas ratio in the DLA at , and is the dust-to-gas ratio assumed for the present epoch ISM of the Galaxy (Bakes & Tielens 1994; see discussion in 4.1). The incident FUV radiation field equals 4, where is the mean intensity integrated between 6 and 13.6 eV, and is in units of Habing’s (1968) estimate of the local interstellar value (=1.610-3 ergs cm-2 s-1). The quantity is the fraction of FUV radiation absorbed by grains and converted to gas heating (i.e., the heating efficiency); is also a function of (Bakes & Tielens 1994). For a plane parallel layer, is proportional to the source luminosity density projected perpendicular to the plane; i.e., the source luminosity per unit area, which in the case of FUV radiation is proportional to ( 5.1). As a result, we can deduce provided we know , , and . Because is well determined for a wide range of physical conditions (Bakes & Tielens 1994; Weingartner & Draine 2001a), this reduces to measuring the heating rate and . Both of these are obtainable from HIRES spectroscopy since the heating rate can be inferred from C II∗ absorption and is determined from the abundance patterns and metallicity of the gas (see 4.1). Note, to derive equation (1) we assume in high- DLAs is the same as in the ISM. In other words we assume quantities determining , such as the photoelectric cross-section, photo-electric ionization yield, kinetic energy partition function, and grain size distribution (Bakes & Tielens 1994) are the same in DLAs and the ISM.
We determine the heating rate by equating it to the cooling rate; i.e, we assume steady-state conditions. This is reasonable since the cooling times are 105106 yrs which are short compared to the dynamical time scales for most model protogalaxies (see 4.3). As a result we let
| (2) |
where the total heating rate
includes other sources of heat in addition to , and
and are the gas density and cooling function.
In the ISM, cooling is dominated by [C II] 158 m
emission, i.e., , with a luminosity
([C II]) = 5107
(Wright et al. 1991). The 158 m line results
from transitions between the
and fine-structure states in the ground
22 term of C+.
Most of the emission from the Galaxy and other nearby spirals arises
in the diffuse CNM gas rather than from star-forming regions in spiral arms,
or photo-dissociation regions on the surfaces
of molecular clouds (e.g. Madden et al. 1993). The last point is
especially relevant for damped Ly systems where molecules are
rarely detected (Lu et al.
1997; Petitjean et al. 2000).
Pottasch et al. (1979) used the following expression to estimate the [C II] 158 m emission per H atom from gas detected in absorption against background sources:
| (3) |
where (C II∗) is the column density of C+ ions in the state, (H I) is the H I column density, and and are the coefficient for spontaneous photon decay and energy of the transition. In fact, is just the densityweighted average along the line of sight of the more fundamental quantity, , the rate of spontaneous emission of energy per H atom at a given displacement vector . That is
| (4) |
where
| (5) |
and are the volume densities of H I and C II∗, and is the differential path length along the line of sight. Notice that =4 where is the volume emissivity appearing in the radiative transfer equation. We can measure since (C II∗) and (H I) are measurable: (C II∗) from C II∗ 1335.7 absorption and (H I) from damped Ly 1215.7 absorption. Note also that = when cooling is dominated by [C II] 158 m emission.
3 THE DATA
| log10(H I) | log(C II∗) | [Fe/H] | [Si/H] | log10 | ||
|---|---|---|---|---|---|---|
| QSOa | (cm | (cm-2) | (ergs s-1 H-1) | |||
| (1) | (2) | (3) | (4) | (5) | (6) | (7) |
| Q001915 | 3.439 | 20.920.10 | 13.840.02 | 1.5870.108 | 1.0580.113 | 26.610.10 |
| Q010013b | 2.309 | 21.370.05 | 13.590.05 | 1.8990.090 | 1.4600.081 | 27.330.07 |
| Q014933 | 2.141 | 20.500.10 | 12.78 | 1.7700.102 | 1.4890.110 | 27.24 |
| Q020111c,h | 3.387 | 21.260.10 | 14.120.10 | 1.4100.113 | 1.2500.150 | 26.670.10 |
| Q025500 | 3.915 | 21.300.05 | 13.440.04 | 2.0500.101 | 1.7790.052 | 27.380.07 |
| Q030749d | 4.466 | 20.670.09 | 13.59 | 1.9600.220 | 1.5500.12 | 26.60 |
| Q033601 | 3.062 | 21.200.10 | 14.040.03 | 1.7950.105 | 1.4060.100 | 26.680.10 |
| Q034738 | 3.025 | 20.630.10 | 13.470.03 | 1.6230.080 | 1.1700.026 | 26.680.11 |
| Q045802 | 2.039 | 21.650.09 | 14.80 | 1.7670.102 | 1.1860.092 | 26.38 |
| Q074147 | 3.017 | 20.480.10 | 12.55 | 1.9280.100 | 1.6860.100 | 27.45 |
| Q083611 | 2.465 | 20.580.10 | 13.12 | 1.4030.101 | 1.1540.110 | 26.98 |
| Q095104g | 4.203 | 20.400.10 | 13.370.08 | 2.591 | 2.6180.104 | 26.550.13 |
| Q095201g | 4.024 | 20.550.10 | 13.550.02 | 1.8630.126 | — | 26.520.10 |
| Q110418 | 1.661 | 20.800.10 | 13.440.05 | 1.4760.102 | 1.0400.100 | 26.930.11 |
| Q110807 | 3.608 | 20.500.10 | 12.34 | 2.1160.101 | 1.7980.100 | 27.68 |
| Q120207b | 4.383 | 20.600.14 | 13.06 | 2.190.188 | 1.8090.141 | 27.06 |
| Q121533 | 1.999 | 20.950.067 | 13.17 | 1.7020.085 | 1.4810.072 | 27.30 |
| Q122317 | 2.466 | 21.500.10 | 14.01 | 1.8430.102 | 1.5930.100 | 27.02 |
| Q123208e | 2.337 | 20.900.10 | 14.000.10 | 1.7200.13 | 1.2200.15 | 26.400.14 |
| Q133117f | 1.776 | 21.180.04 | 14.050.05 | 2.0580.41 | 1.4520.041 | 26.650.07 |
| Q134603 | 3.736 | 20.720.10 | 12.550.11 | 2.6340.102 | 2.3320.100 | 27.690.15 |
| Q142560g | 2.827 | 20.300.04 | 13.33 | 1.3290.040 | 1.034 | 26.50 |
| Q144327g | 4.224 | 20.800.10 | 14.71 | 1.0960.115 | 0.926 | 25.61 |
| Q175975g | 2.625 | 20.760.10 | 12.800.05 | 1.1840.008 | 0.7860.011 | 27.520.11 |
| Q194676b | 2.844 | 20.270.06 | 12.46 | 2.5280.061 | 2.2260.060 | 27.33 |
| Q220619 | 2.076 | 20.430.06 | 13.16 | 2.6060.062 | 2.3090.069 | 26.80 |
| Q223100 | 2.066 | 20.560.10 | 13.710.04 | 1.4020.119 | 0.8750.102 | 26.380.11 |
| Q223706b | 4.080 | 20.520.11 | 12.53 | 2.1400.167 | 1.8700.112 | 27.51 |
| Q234312b,g | 2.431 | 20.340.10 | 12.770.05 | 1.1990.100 | 0.5400.101 | 27.090.11 |
| Q234412b,h | 2.538 | 20.360.10 | 12.95 | 1.8300.105 | 1.7410.101 | 26.93 |
| Q234814 | 2.279 | 20.560.08 | 13.21 | 2.2380.0770 | 1.9170.0776 | 26.88 |
| Q235902A | 2.095 | 20.700.10 | 13.700.06 | 1.6550.103 | 0.7780.102 | 26.520.12 |
| Q235902B | 2.154 | 20.300.10 | 14.48 | 1.8770.105 | 1.5830.101 | 25.34 |
We have determined for 33 DLAs. The results were obtained by measuring (C II∗) and (H I) from accurate velocity profiles. In Table 1 we show and other properties to be used in subsequent analyses. Column 1 gives the coordinate name of the background QSO, column 2 the absorption redshift of the DLA, column 3 the H I column density, column 4 the C II∗ column density, column 5 the iron abundance relative to solar (where [Fe/H]log10(Fe/H) log10(Fe/H)⊙), column 6 gives the silicon abundance, [Si/H], and is given in column 7. In cases where Fe absorption lines were not measured, we substituted proxy elements such as Ni, Cr, and Al. In cases where Si absorption was not measured, we used S or Zn as proxies (see PW02 for a full description of these procedures). The data for 30 of the entries were obtained with HIRES: 23 of these by our group (Prochaska et al. 2001), 6 by Lu et al. (1997), and one by Songaila & Cowie (2001). Data for the remaining 3 entries were acquired with the UVES spectrograph on the VLT 8 m telescope (Ellison et al. 2001; Srianand et al. 2000; Dessauges-Zavadsky et al. 2001).
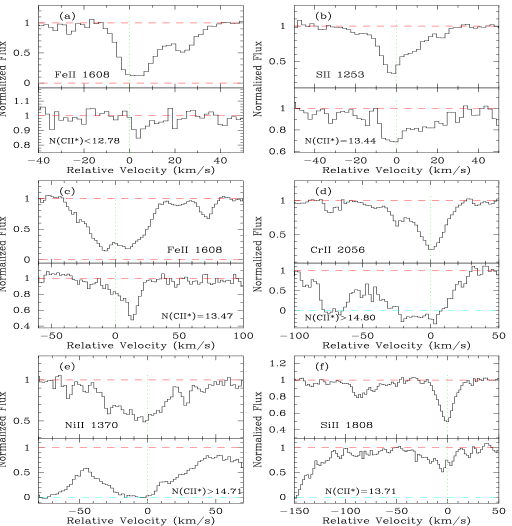
Figure 1 shows six examples of C II∗ velocity profiles used to derive (C II∗) in Table 1 along with corresponding low-ion resonance profiles. While the velocity structures of the two profiles exhibit overall similarity, statistically significant differences exist. These are evident in (1) the DLA toward Q034738 (panel c) where two strong velocity components are detected at =8 and 12 km s-1 in Fe II 1608, while only the =12km s-1 component is detected in the C II∗ 1335.7 profile even though there is sufficient signal-to-noise to detect the =8km s-1 component, and (2) the DLA toward Q223100 (panel f) where absorption in C II∗ 1335.7 between 50 km s-1 and 20 km s-1 is not detected in Si II 1808. In Paper II we show these differences to be evidence for a multi-phase gas in which varies along the line of sight.
In Figure 2 we plot versus (H I) for the DLAs.
There are
16 positive detections (red data points), 2 lower limits
(95 confidence intervals plotted as blue points), and 15 upper
limits (95 confidence intervals plotted as green data points).
One purpose of this plot is to
illustrate possible systematic effects such as correlations between and
(H I).
No such correlation
is evident in the data. However,
there is a tendency for the upper limits on to
occur at low H I column densities: 12 of the 15 upper limits
on (C II∗) occur
at log10(H I) 20.6 cm-2. This suggests that at least
some of the null detections with large upper limits
result from gas with
C II∗ column densities sufficiently low
that 1335.7 is undetectable
rather than from low
values of .
Other upper limits are caused by blending
between C II∗ 1335.7 and Ly forest lines (as for the = 2.154 DLA
toward Q235902B). However, we cannot exclude the possibility
that the remaining upper limits arise from
values substantially
below the positive detections.
The lower limits correspond to cases in which
C II∗ 1335.7 is saturated.
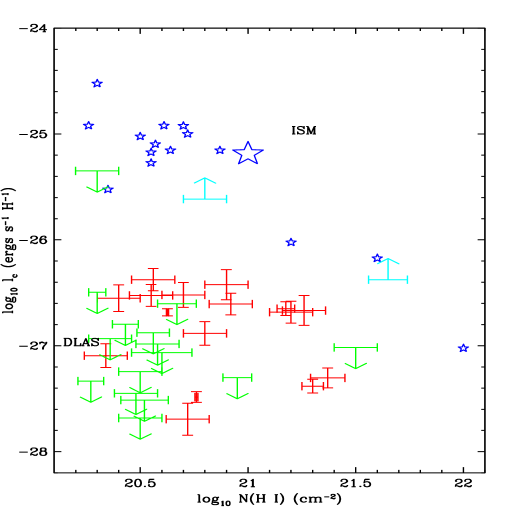
The second purpose of this plot is to compare C II∗ emission rates in DLAs and in the ISM. Thus we plot , (H I) pairs derived for representative sightlines through the ISM which are shown as small blue stars (Pottasch et al. 1979; Gry et al. 1992). While Pottasch et al. (1979) did not report measurement errors, Gry et al. (1992) report 1- errors corresponding to 0.3 dex in log10(). The large star was derived by dividing the total 158 m luminosity of the Galaxy by the H I mass of the disk (Hollenbach & Tielens 1999); the result corresponds to the density-weighted average of integrated over the disk of the Galaxy which we refer to as ISM. Comparison between the DLA and ISM data demonstrates that averaged over the DLA sample, i.e., , is about 1/30 times ISM. Because 158 m emission from DLAs has not been detected, the analogous quantity, which is the density-weighted average of over the entire H I mass distribution of the DLAs, is unknown. Nevertheless the data covering 33 sightlines through DLAs strongly suggest the C II∗ cooling rate per H atom to be much lower in DLAs than in the ISM. The heating rates are therefore correspondingly lower.
The ratio of the two heating rates is simply explained if the DLA gas is heated by the same mechanism that heats the ISM; i.e., photoejection of electrons from dust grains. If the mean intensities of FUV radiation are the same and the photoelectric efficiencies are the same, equation 1 shows that the ratio of heating rates equals the ratio of dust-to-gas ratios, . Pettini et al. (1994) set equal to the mean value in the Galaxy and estimate that 1/30 to 1/20 which approximates the DLA metallicity relative to solar and is remarkably close to the ratio of heating rates. Either this is a chance coincidence or it means that in DLAs is nearly the same as in the ISM and the paucity of grains accounts for the lower rate of heating in DLAs. Consequently we shall adopt the grain photoelectric heating mechanism.
4 MULTI-PHASE STRUCTURE OF THE DLA GAS
To further evaluate the grain photoelectric heating hypothesis, we compute the thermal equilibrium temperature as a function of density for gas subjected to photoelectric grain heating. We adopt the treatment of W95 who calculate the two-phase structure of neutral gas in the ISM. In this calculation the gas is assumed to be mainly atomic and in a state of thermal and ionization equilibrium. We also include heating and ionization due to cosmic rays, soft X-rays, and the photoionization of C I by FUV radiation (cf. W95). Cooling is assumed to arise from fine-structure and metastable transitions in ions of abundant elements, from Ly, and from radiative recombination of electrons onto grains. Rather than repeat the W95 analysis here, we summarize the important points, emphasizing how the input physics for DLAs differs from that of the ISM.
4.1 Elemental Abundances and Dust-to-Gas Ratios
Elemental abundances affect both the heating and cooling rates in DLAs in different ways. Consider the heating rate. The rate of grain photoelectric heating, , is proportional to the dust-to-gas ratio in DLAs, , which in turn depends on the fraction of extant metals in grains. More specifically, depends on the grain composition, i.e., on whether grains in DLAs are mainly carbonaceous, as in the Galaxy, or mainly silicates as in the SMC (see Weingartner & Draine 2001b). Recent evidence suggests that at 1, grains in DLAs are Galactic. The unambiguous detection of the 2175 Å graphite absorption feature and the overall shape of the reddening curves suggest that a known DLA at = 0.524 (Junkkarinen et al. 2002) and a DLA detected in a gravitationally lensed galaxy at = 0.83 (Motta et al. 2002) contain Galactic dust. On the other hand, a search for the 2175 Å feature in 5 DLAs with mean redshift 2 (Pei et al. 1991) resulted in null detections with upper limits on 2175 Å optical depth significantly below predictions based on the relative reddening of QSOs with foreground DLAs. To account for this result, Pei et al. (1991) suggested that dust in DLAs resembles SMC dust which does not exhibit the 2175 Å feature, presumably because it is composed mainly of silicates.
For these reasons we shall consider a “Gal” model in which dust in DLAs consists of carbonaceous grains and PAHs and an “SMC” model in which the dust in DLAs consists of silicate grains. The “Gal” model assumes that small (410 Å) carbonaceous dust grains dominate the heating as they do in the Galaxy, and we shall use the heating efficiency for Galactic regions rich in small carbonaceous grains computed by Bakes & Tielens (1994). We infer the abundance of carbonaceous grains (per H atom) from the relative dust-to-gas ratio, , where = and is the dust-to-gas ratio in the Galaxy. We determine from the observed depletion of Fe in each DLA (see derivation in the Appendix). Our method assumes that the number of C atoms depleted onto dust grains per depleted Fe atom is the same in DLAs as in the Galaxy; i.e.,
| (6) |
This is a reasonable assertion because Fe tracks C in metal-poor stars (Carretta et al. 2000). Indexing the C depletion to the Fe depletion is necessary because the C abundance typically cannot be measured in DLAs and Fe is the only element for which the depletion level is known (by comparison with Si). We also assume the size distribution of the carbonaceous grains containing the depleted C atoms follows that of Bakes & Tielens (1994). As a result, the grain photoelectric heating rate equals computed for pure carbonaceous grains and solar composition multiplied by (equation 1).
The “SMC” model assumes that silicate grains dominate the heating. The absence of a 2175Å bump in the typical SMC dust extinction curve and deficit of 12m emission indicate a lack of small carbonaceous grains (Sauvage & Vigroux 1991), so it is the remaining small silicate grains that dominate the heating. Therefore, we use the heating efficiency calculated by Weingartner & Draine (2001a) for regions that lack small carbonaceous grains. We infer the abundance of silicate grains from the dust-to-gas ratio determined from the observed depletion of iron analogous to the equation for carbon shown above. This assumes that the number of depleted Si atoms per depleted Fe atom is the same in DLAs as in the Galaxy, making the SMC model a hybrid of SMC and Galactic conditions. Observations of [Fe/Si] in DLAs will allow us to check this assumption against reality. In calculating the gaseous carbon abundance and using [Fe/Si] to determine , we assume that C and Si are nearly undepleted. The possible contradiction between using the heating efficiency of carbonaceous or silicate grains while assuming C and Si to be undepleted will be discussed in 6.
To estimate we compute the fraction of Fe in grains. To estimate this fraction we need to determine the intrinsic abundance of Fe and compare it to its gas-phase abundance. Although previous workers used Zn to estimate intrinsic Fe, we shall use Si because (1) the median ratio [Si/Zn]=0.030.05 for a sample of 12 DLAs indicates Si traces Zn (implying that Zn may trace -enhanced elements rather than Fe-peak elements (PW02)), (2) there is only one case of Si depletion to date (Petitjean et al. 2002), and (3) Si abundances have been measured out to = 4.5 whereas Zn is rarely measured at 3.3. In the Appendix we show that in the case of grains composed of Fe,
| (7) |
In the last equation the abundance ratios [X/Y]=loglog, and the subscripts “int” and “gas” refer to intrinsic and gas phase abundance ratios.
Since is sensitive to the level of depletion, we test two models. In the minimal depletion model we make use of abundance patterns of DLAs deduced by PW02. Though they derived the median value [Fe/Si]int = 0.3 from the abundance pattern of metal-poor DLAs which are not expected to have significant dust depletion, we shall adopt the more conservative value of 0.2. This is consistent with enhancement expected from type II supernovae which dominate nucleosynthesis at high . We then let [Fe/Si]gas equal the observed ratio and use equation (7) to derive for each DLA. Because the value of [Fe/Si]int is not yet well established, we consider a second, maximal depletion model in which we derive by assuming [Fe/Si]int=0; i.e., we assume the observed deviations of the Fe to Si ratios from the solar value are caused only by depletion. In both models we assume [Si/H]int=[Si/H]gas because of evidence that Si is nearly undepleted. In cases where only observational limits exist on [Si/H]gas or [Fe/H]gas we substitute elements such as S or Zn for Si, and Ni, Cr, or Al for Fe. One could also consider the prescription of Pei et al. (1999) who let the dust-to-gas ratio equal the observed Fe abundance, i.e., = 10, but that turns out to be intermediate between the two models considered below; the minimal depletion model yields the smallest values of and the maximal depletion model yields the largest values of .
The abundances of the elements
C, O, Si, and Fe in the gas phase affect the cooling rate since
transitions of C+, O0, Si+, and Fe+ are the major coolants.
In our models we use the following prescription to compute gas phase
abundances of these elements in each DLA. First we equate the
intrinsic abundance of Si to its measured gas-phase abundance; i.e.,
[Si/H]int=[Si/H]gas where the latter are listed in Table 1.
Oxygen resembles Silicon as it is undepleted and an
-enhanced element. As a result we assume that
[O/H]gas=[Si/H]int. While we assume that carbon is
undepleted, we are aware this poses a potential contradiction with the
“Gal” dust model in which the depletion level of C is assumed
proportional to the depletion level of Fe and we address this issue in
6. In any case C is not an -enhanced element, but
rather is likely to trace Fe since [C/Fe]0 in stars of all
metallicities (e.g. Carretta et al. 2000). Therefore we assume
[C/H]gas=[Fe/H]int where
[Fe/H]int=[Fe/Si]int[Si/H]int.
For consistency with the other model abundances we compute
[Fe/H]gas from [Fe/H]int rather than equate it to the
observed DLA Fe abundance. In this case [Fe/H]gas=[Fe/H]int
log10[1-10]. The
results are summarized in Table 2.
| Element | log10(X/H)⊙ | log10(X/H)gaslog10(X/H)⊙ |
|---|---|---|
| He | 1.00 | 0 |
| C | 3.44 | [Si/H]int[Fe/Si]int |
| O | 3.34 | [Si/H]int |
| Si | 4.45 | [Si/H]int |
| Fe | 4.45 | [Si/H]int[Fe/Si]int |
| log10[1-10] |
4.2 Heating and Cooling
In this subsection we discuss the sources of heating and cooling in DLA gas. Specifically, we consider a gas layer subjected to heating by grain photoelectric emission, cosmic ray ionization, X-ray ionization, and photoionization of C I. We also discuss cooling by important emission lines from abundant elements, and show how direct excitation by CMB photons and indirect excitation due to pumping by FUV fluorescence photons cause the spontaneous emission rate to deviate from the cooling rate. Similar discussions, that did not include optical pumping, were given by Spaans & Norman (1994) and subsequently by Liszt (2002).
4.2.1 Heating
The heating rate is given by
| (8) |
where is given by equation (1), and are the heating rates due to cosmic rays, X-rays, and photoionization of C I by the FUV radiation field, . We ignore heating due to the integrated background from galaxies and QSOs as it is negligible compared to for the range of SFRs considered in 5; i.e., log10 4.0 M. We compute by adopting expressions and parameters used by W95 to model the ISM, but where appropriate extrapolate to physical conditions pertaining to DLAs. Thus, in the case of “Gal” dust we compute by adopting the Bakes & Tielens (1994) expression for the photoelectric efficiency, since we assume that the DLAs have the same relative distribution of small grains and PAHs as the ISM. In the case of “SMC” dust we compute by adopting the Weingartner & Draine (2001a) expression for photoelectric efficiency in the case of pure silicates, black-body FUV radiation, and selective extinction =3.1. On the other hand there is no a priori reason why in DLAs should equal 1.7, the widely accepted value for the ISM (Draine 1978). As we show in 5, and the SFRs per unit area in DLAs need not equal the Milky Way rates. Moreover, the transfer of FUV radiation depends on the dust optical depth which should be lower in DLAs than in the ISM. We use the inferred optical to determine a self-consistent solution for , which reveals the SFR per unit area (see 5.2).
To compute we assume = where expressions for , the primary cosmic-ray ionization rate, and , the energy deposited for each primary electron of energy , are given by W95. These authors find = 1.810-17 s-1 in the Galaxy. We scale this result to DLAs by assuming
| (9) |
where we have used log10 = 2.4 M for the disk of the Galaxy (Kennicutt 1998).
To compute the effects of soft X-rays we use the W95 expressions for the heating rate, , and primary and total ionization rates, and . We again scale to DLAs by assuming all these quantities are proportional to . W95 assume soft X-rays (photon energies exceeding 0.2 keV) are emitted by thermal and non-thermal components. The thermal component comprises the hot ( 106 K) coronal phase of the ISM. The non-thermal component consists of extragalactic power-law radiation. These X-rays penetrate the outsides of CNM clouds, heating the gas to form the WNM (e.g. Heiles 2001). W95 assume the incident X-rays are attenuated by a WNM layer of gas with H I column density log10 = 19 cm-2. For our analysis we shall assume log10 = 20 cm-2 instead. This is because low-density ( 0.1 cm-3) WNM gas cannot remain neutral at H I column densities log10 20.3 cm-2 due to the background ionizing radiation field which is about 100 times more intense at high redshifts than at = 0 (e.g. Prochaska & Wolfe 1996). Had we assumed log10 =19.0 cm-2, the total column density of neutral plus ionized gas would exceed log=20.0 cm-2, and it is the total column density which is crucial for determining X-ray opacity. Furthermore, Vladilo et al. (2001) present strong arguments that gas in DLAs is mostly neutral. Thus our limit is conservative. Another reason for adopting the larger WNM column density is our model assumption that a significant fraction of the H I column density in each DLA consists of WNM gas. The result of these model assumptions is that cosmic rays will be a more important source of heating and ionization than X-rays.
Notice, that we have assumed that , , and are all proportional to . While unproven for and , we believe this assumption is reasonable as all three quantities are ultimately driven by the formation rate of massive stars. This is because cosmic rays are thought to be accelerated in supernova remnants, and much of the soft X-ray emission is thought to arise in hot gas located behind supernova shocks (McKee & Ostriker 1977).
4.2.2 Cooling
The cooling rate (erg cm3 s-1) is given by
| (10) |
At 3000 K, cooling is dominated by the fine-structure term, . The leading contributors are emission by the fine-structure lines [C II] 158 m, which typically dominates at 300 K, and [O I] 63 m which is comparable to 158 m emission only at 300 K. Following W95 we also include fine structure cooling from other transitions in O0 (i.e., neutral Oxygen) and from transitions in Si+ and Fe+. At 3000 K, the term becomes important. This arises from excitation of metastable transitions of C+, O0, Si+, and S+. At higher temperatures, the Ly cooling term, starts to dominate along with , the grain recombination rate. We computed by adopting the Bakes & Tielens (1994) expression for cooling due to radiative recombinations of electrons onto PAHs and grains. Note, we have not included cooling by transitions in the neutral species C0, Fe0, Mg0, and Si0 considered by W95 as their contribution to is negligible.
By definition the cooling rate of the gas equals the net loss of thermal kinetic energy per unit time. In the case of line cooling this is the product of (a) the difference between the collisional excitation and de-excitation rates, and (b) the energy of the atomic transition. The former equals the spontaneous emission rate, provided collisions are the dominant source of excitation and de-excitation. As a result = in the ISM where is the spontaneous emission rate per H atom of the transition. However, this equality can break down in DLAs since radiative excitation can be important. At high the CMB contributes significantly to the rate at which the and states are populated. Moreover, for large values of , these ground-term fine-structure states can be populated indirectly through FUV excitation of higher energy states; i.e., through optical pumping (termed “fluorescence” by Silva & Viegas 2002). When radiative excitations are important we have
| (11) |
where ()pump and ()CMB are the spontaneous energy emission rates in the limits of pure optical pumping and CMB excitation. In deriving the last equation we used the condition 1+z =33 where is the excitation energy corresponding to the transition in C II, and =2.78 K, the current temperature of the CMB. We find that
| (12) |
where (C/H) is the carbon abundance, and is the rate of spontaneous emission for the transition. The quantity is the net rate at which state pumps state (see Silva & Viegas 2002). We calculated using standard expressions for excitations due to collisions and CMB radiation. We used the Silva & Viegas (2002) code, POPRATIO, to compute the rate at which the and states are populated by optical pumping. We considered indirect excitation of the and states through transitions to 8 higher levels. For consistency we used the spectral form advocated by Draine (1978) for the FUV radiation field, normalized such that =/(1.6 ergs cm-2 s-1). However, this procedure ignores the effects of line opacity, which can effectively suppress the pumping rate when the gas is optically thick to transitions such as C II 1334.5, and CII 1036.3 (Sarazin et al. 1979; Flannery et al. 1979; 1980). Because the values of , resonance-line optical depth, and collisional excitation rates are required to evaluate the suppression of optical pumping, we shall re-evaluate our “optically thin” solutions for self-consistency in 5.2.2.
4.3 Phase Diagrams for DLAs
In this subsection we compute the two-phase structure of neutral gas in DLAs. We find that if the gas is CNM, the SFRs per unit area deduced for local disk galaxies (Kennicutt 1998) generate [C II] spontaneous emission rates similar to those observed in DLAs for typical DLA metallicities. If the gas is WNM, the required SFR per unit area must be at least a factor of 10 higher.
We solved the equations of thermal and ionization equilibrium for gas at constant density with the numerical techniques and iterative procedures outlined in W95. We checked our technique by computing solutions for ISM conditions. In that case we assumed =1.7, [Si/H]int=0, log10=[Fe/H], and the same density-dependent depletion formulae advocated by W95. The results are in good, though not exact, agreement. Most importantly, the versus curves are in excellent agreement with the W95 results except at log10 0.5 cm-3 where optical pumping effects ignored by these authors causes to deviate significantly above .
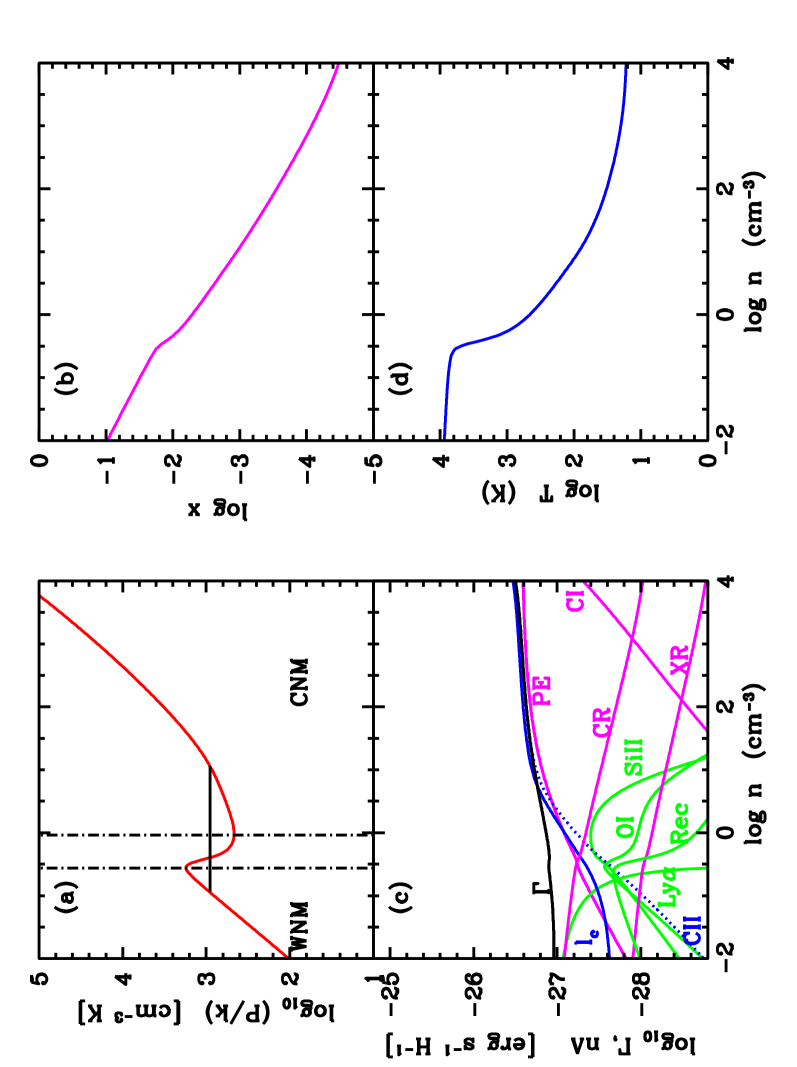
To illustrate the behavior of two-phase media with DLA conditions we let [Si/H]int = 1.3, the mean Si abundance found for DLAs (PW02). We assume the “Gal” model and use maximum depletion to find log10 = 1.5. We assume an ISM radiation field, G0 = 1.7, and adopt the mean redshift of the DLA sample, =2.8, to compute the CMB temperature. We compute the cosmic ray and X-ray heating rates from equation (9) by assuming the ISM star formation rate log10=2.4 kpc-2 yr-1. The resulting equilibrium curves shown in Figure 3 exhibit the same two-phase equilibria found by W95 for the ISM. In a plot of pressure, , versus density, , (see Fig. 3a) the regions of thermal stability occur where / 0 (in the case of constant ). Thus a two-phase medium in which a WNM can remain in pressure equilibrium with a CNM can be maintained between 460 K cm-3 and 1750 K cm-3. An example in which is shown as the horizontal line connecting the WNM and CNM. The intercepts with the curve in the WNM and CNM correspond to thermally stable states; a WNM with 7600 K and log10 1 cm-3 in presure equilibrium with a CNM with 80 K and log10 1 cm-3. Gas with densities 0.6 log 0.0 cm-3 is thermally unstable and evolves either to WNM or CNM states. Figure 3b shows the fractional ionization as a function of density.
Figure 3c plots the heating rates, (red curves), cooling rates, (green curvesand dotted blue curve in the case of C II), and the spontaneous emission rate (solid blue curve). It is evident that grain photoelectric heating dominates in the CNM while cosmic ray heating dominates in the WNM (see W95). By contrast to the ISM, cosmic rays dominate X-ray heating in DLAs for all densities, owing to the higher X-ray opacity of the H I column density assumed for DLAs. The dominant coolant in the CNM is [C II] 158 m radiation which is insensitive to density at 0.5 log 4.0 cm-3. This breaks down at log10 4.5 cm-3 (not shown) where C I photoionization dominates the heating rate and the cooling rate increases rapidly with density. On the other hand [C II] 158 m emission comprises less than 10 of the cooling in the WNM. Furthermore owing to CMB excitation and optical pumping, the population of the 2P3/2 state of C+ is larger than in the case of collisional excitations and de-excitations alone. As a result, at log 0.0 cm-3 the spontaneous emission rate, , will exceed the cooling through 158 m emission (see equation 11). Notice that is insensitive to density in the CNM where and in the WNM where ()pump (see equation 12). This reduces the uncertainty in estimating in the models discussed in 5. In any case the spontaneous emission rate in the CNM, log10 26.6 ergs s-1 H-1, is comparable to the mean for the DLA sample in Figure 1. Stated differently, the hypothesis of grain photoelectric heating can account for the mean [C II] cooling rate of DLAs provided (a) heating occurs in CNM gas with a low dust-to-gas ratio, and (b) heating is driven by an FUV radiation field comparable to that inferred for the ISM. On the other hand the observed could also arise in WNM gas (cf. Norman & Spaans 1997; Kanekar and Chengalur 2001), provided is about a factor of 30 or more higher. We will address this further in 5.
In our models the heating rates for DLAs were inferred from the cooling rates by assuming steady-state conditions. To determine whether this assumption is valid, consider the cooling time of gas in pressure equilibrium,
| (13) |
(see equation 10 in W95). We find that =310-27 ergs s-1 H-1 is required for CNM gas to match the inferred [C II] emission rate. Since 50 K, we have 3105 yrs. If the DLA gas is in the WNM phase, then =310-26 ergs s-1 H-1 is required to explain the observed . In that case 8000 K and 5106 yrs. Because these time-scales are comparable to the dynamical time-scales of individual interstellar clouds, the assumption of thermal balance may break down on the spatial scales of typical interstellar clouds. However, the measured quantity for DLAs is which is the density-weighted average of the C II∗ spontaneous emission rate, , along the sightline through a typical DLA. In this case the relevant dynamical time scale is that of a typical protogalaxy which in any scenario is large compared to 5106 yrs. Stated differently the fluctuations of heating and cooling rates integrated over the length scales of typical DLAs average out so that the mean rates are equal. As a result, the assumption of thermal and ionization balance should be an excellent approximation for DLAs.
On the other hand the assumption of pressure equilibrium is not well established empirically. Accurate Arecibo 21 cm measurements of H I spin temperatures in the ISM reveal strong evidence for CNM gas with =25 50 K, but no evidence for WNM gas with 7000 K. Rather, a significant fraction of the warm gas lies in the thermally unstable regime with =500 5000 K (Heiles 2001). While these measurements do not rule out multi-phase models for the ISM, they bring to mind alternative scenarios. Specifically, Vazquez-Semadeni et al. (2000; see also Gazol et al. 2001) compute 2D numerical simulations in which the dynamics of ISM clouds are dominated by turbulence rather than thermal instability. In this scenario the boundaries of dense CNM clouds are accretion shocks comprising thermally unstable gas rather than quiescent contact discontinuities separating disparate phases at constant pressure. Moreover the unstable gas is found to comprise a significant fraction of the ISM mass (although, higher-resolution 3D numerical simulations by Kritsuk & Norman (2002) find the fraction to be less than 15). But, as stressed by Vazquez-Semadeni et al. (2000), the cooling times in the thermally unstable gas are shorter than the dynamical time scales, and as a result the thermally unstable gas evolves quasi-statically through a sequence of thermal equilibrium states. For these reasons, the cooling curves shown in Figure 3c also apply to the “turbulence scenarios”. Although and increase as decreases from 7500 K to 1000K, both quantities are still small compared to the total heating rate, . As a result, relatively large SFRs are required for scenarios in which C II∗ absorption occurs in warm neutral gas (as discussed in Paper II), whether or not that gas is in pressure equilibrium with the CNM. And it is this property which ultimately rules out the WNM models. We conclude that the possible break down of pressure equilibrium has little effect on our results.
5 THE STAR FORMATION RATE PER UNIT AREA
We now estimate the SFR per unit area for each of our sample of DLAs. We first solve the transfer equation for the mean intensity of FUV radiation corresponding to the derived for each DLA and for a wide range of . For each DLA we assign appropriate gas-phase abundances and then combine equation (1) with the steady state assumption of equation (2) to compute . We compare the computed with the observed to deduce for each DLA in both the CNM and WNM models. As we shall show, these SFRs are global in nature as they correspond to averaged over the entire DLA.
5.1 Solutions to the Transfer Equation
Assume the gas, dust and stars comprising DLAs are uniformly distributed throughout plane-parallel disks with half-width, , and radius, . A disk is a reasonable approximation for DLAs because dissipative collapse of gas in all galaxy formation scenarios, including protogalactic clump formation predicted by CDM numerical simulations (Haehnelt et al. 1998), occurs along a preferred axis, resulting in configurations resembling plane-parallel layers. Though uniformity is a highly idealized assumption, we shall show that the results do not differ qualitatively when this assumption is relaxed (see Paper II). We compute the mean intensity, , at the center and midplane location of the uniform disk and find:
| (14) |
where we have ignored scattering of photons, and is the absorption opacity of dust at frequency . The quantity is the luminosity density of the uniform disk, =, and the extra factor of two out front comes from having run from 0 to . After integration we find that
| (15) |
Note, we obtained equation (15) by assuming the radial distance to the edge of the disk equals for /2.
To compute it is necessary to evaluate the quantities and ; i.e., the dust optical depths perpendicular and parallel to the plane of the disk. Define the optical depth, , to be that of an average line-of-sight through the disk. At an average inclination angle of 45o we find that
| (16) |
To compute , we follow Fall & Pei (1989) who derived the following expression:
| (17) |
where
= for
“Gal” dust and
=
[10] for
“SMC” dust,
and is the extinction at
wavelength =.
The [Si/H]SMC term is the silicon abundance of the
SMC and appears because is
normalized with respect to Galactic dust.
The photons
responsible for photoelectric grain heating in DLAs have energies between
= 6 eV and the Lyman limit cutoff at 13.6 eV. At the characteristic
energy = 8 eV (corresponding to =1500 Å)
we
find that
and equal 0.79 and 2.5 for the “Gal”
model, and
and equal 0.05 and 5.0 for the “SMC” model.
We determine by assigning
the appropriate for each DLA, and by using the median of our sample
distribution of H I column densities, (HI)=0.481021cm-2.
For each DLA
we use the sample median rather than the measured value of (HI) because
(HI) along a single line-of-sight is unlikely to represent the H I
column encountered by most of the FUV radiation; since
1,
the FUV radiation which heats the grains is transported across the entire
DLA.
Consequently, 0.01
for values of typifying our sample.
111We use
equation (17) to determine by adopting
the expression in equation (7) for to infer
from either or . Though the definition of these dust-to-gas ratios
differs from that used to compute , the absolute values of are used only
for evaluating . To compute , all we need is the
relative quantity, . Since we employ the same expression for
for both purposes, we are assuming that all the intrinsic properties of the
grains are the same in DLAs and in present-day objects.
These estimates of imply the condition 1 in every case. For reasonable aspect ratios, , we find that 1 in most DLAs, but in metal-rich objects the condition 1 may hold. Therefore, in the limits corresponding to most models, takes on the following simple form:
| (18) |
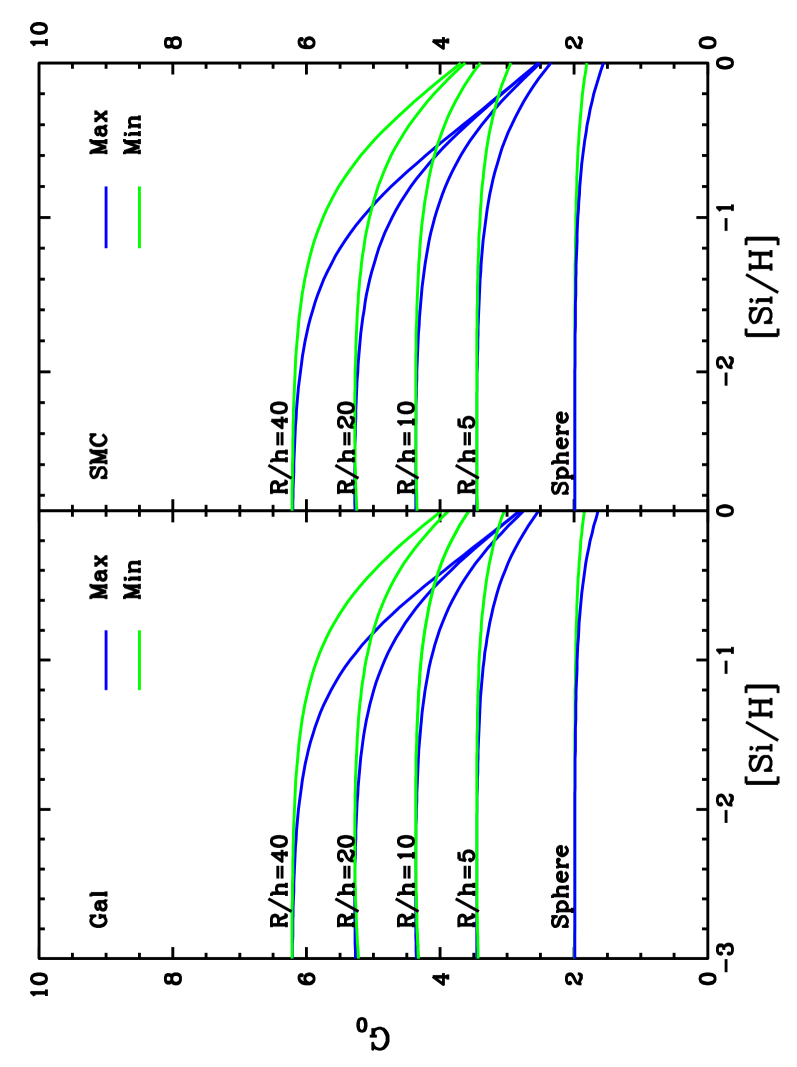
where (=2) is the luminosity density projected along the rotation axis of the disk,i.e., the luminosity per unit area, and is Euler’s constant. Equation (18) shows the mean intensity to vary linearly with the source luminosity per area, but to be weakly dependent on metallicity, reddening curve, and aspect ratio. To illustrate the parameter dependence of we solved equation (15) for (a) the “Gal” and “SMC” dust assumptions, (b) the maximal and minimal depletion models, and (c) aspect ratios in the range prediced by current models of galaxy formation. The results are shown in Figure 4 where we plot mean intensity versus [Si/H]. As expected, for fixed values of , increases with decreasing [Si/H] until the disk becomes optically thin in the radial direction. At lower values of [Si/H], equals a constant that increases with increasing . At higher values of [Si/H], decreases with increasing [Si/H], becoming insensitive to as the disk becomes optically thick: this is because / in the optically thick limit. Figure 4 also plots results for a uniform sphere which, while unrealistic, provide a lower limit to the strength of the radiation field. For our standard model we shall adopt a disk with an aspect ratio =10. From Figure 4 we see that for a measured [Si/H] the uncertainties in and dust composition cause uncertainties in for the disk models which do not exceed 30. When the spherical model is included these remain less than 50.
The grain heating rate is determined by , i.e., integrated between photon energies = 6 and 13.6 ev. Assuming the Draine (1978) UV spectrum we find that = 10-19 ergs cm-2 s-1 sr-1 Hz-1 at = 8 eV (i.e., 1500 Å) results in 4=1.610-3 ergs cm-2s-1, which equals Habing’s (1968) estimate of the UV interstellar radiation
field. Therefore, we shall assume
| (19) |
To relate to the rate of star formation we use the Madau & Pozzetti (2000) calibration. In that case
| (20) |
By combining equations (15), (19) and (20), we can convert into . To see whether our technique reproduces the ISM radiation field, we solved for assuming = 20 kpc, = 0.125 kpc, log10=0, and log10 = 2.4 M. We found that = 1.6, which is in excellent agreement with the Draine (1978) value of = 1.7.
Before changing topics we wish to emphasize several points. First, for typical metallicities the DLAs will be optically thin to FUV radiation in every direction. In the uniform disk approximation, sources at all distances contribute roughly equally to . As a result, the SFRs per unit area inferred from the C II∗ absorption profiles are representative of stars distributed throughout the entire DLA, not just in regions adjacent to the line of sight. This is in contrast to the ISM where the high dust opacity results in SFRs with only local significance. Second, we computed for midplane points displaced from the center of the disk; i.e., we computed () at cylindrical coordinates (,0). When =10 we found ()/(0,0) to slowly decrease from 1 at =0 and to equal 0.9 at the median radius /, 0.75 at , and 0.5 at ; when =100, ()/(0,0)=0.94 at =/, 0.85 at =0.9, and 0.7 at =0.98. Therefore, radiation fields computed from equation (15) result in heating rates representative of sightlines selected to have arbitrary impact parameters. Third, we computed () at distance above the midplane of the uniform disk and then averaged the result along sightlines through the disk. This is a more realistic simulation of the dependence of the heating rate on mean intensity than estimating at midplane. It is encouraging that the resulting mean intensities differed by less than 10 from the solution in equation (15) for dust-to-gas ratios, 3.0 log10 0.0. We also considered Draine’s (1978) solution for () in which the radiation sources are confined to a uniform thin sheet at = 0. The same averaging process led to results in excellent agreement with equation (15) except when log10 0.5 where the Draine expression fell significantly below our result. This occurs because Draine (1978) excluded sources within a critical radius in the disk location below the field point in order to avoid a singularity in his solution. Fourth, in realistic models of DLAs, is not constant throughout a uniform disk with constant gas density, but rather is a function of in a system in which gas density also changes with . We shall examine the implications of this in Paper II.
5.2 Determining in a DLA
5.2.1 Technique
The next step
is to infer for each DLA from determinations of and .
To do this
we need an additional assumption about the physical state of the gas since
is not a unique function of the other two variables. Indeed,
for fixed
[Si/H], , and
the computed [C II] emission rate per H atom,
, varies with density
(as shown in Figure 3c).
Therefore, to infer from observations
we need to know the density of the gas.
We address this problem by assuming the gas to be
a two-phase medium with stable CNM gas in pressure equilibrium with
stable WNM gas. In that case the gas pressure is restricted to lie
between the local minimum and maximum of the pressure field; i.e.,
(see Figure 3a).
For a given , in
the CNM is at least ten times larger than in the WNM.
Our first model, referred to as CNM, assumes
that the typical DLA sightline encounters comparable
H I column densities in the CNM and WNM.
Because the empirical quantity , is the density-weighted
average of along the line of sight
(equation 4),
will thus be dominated by contributions
from in the CNM.
As a result,
will be insensitive to density,
as can be seen in
Figure
3c which shows to
vary by less
than 0.1 dex for 1 log10 4 cm-3; i.e., in the
density range of the CNM.
This insensitivity to density is a generic trait of CNM gas, as shown in Figure 5 where and are plotted against for a grid of SFRs. The results for the Q045802 and Q134603 DLAs are shown in Figures 5a,b and 5c,d respectively. These were chosen to compare results for a low- metal-rich DLA and a high- metal poor DLA. As increases, and increase in magnitude and shift to higher densities (see W95). We shall assume that the pressure of the two-phase medium equals the geometric mean of and ; i.e., =. In principle, could assume any value between and . We were guided by Zel’dovich & Pikel’ner (1969) who used stability arguments to derive unique solutions for . Recent numerical simulations tend to support these conclusions and show that is closer to than (Kritsuk & Norman 2002) in approximate agreement with our criterion. But given all the uncertainties, we shall not pursue the stability approach here. As discussed in 3
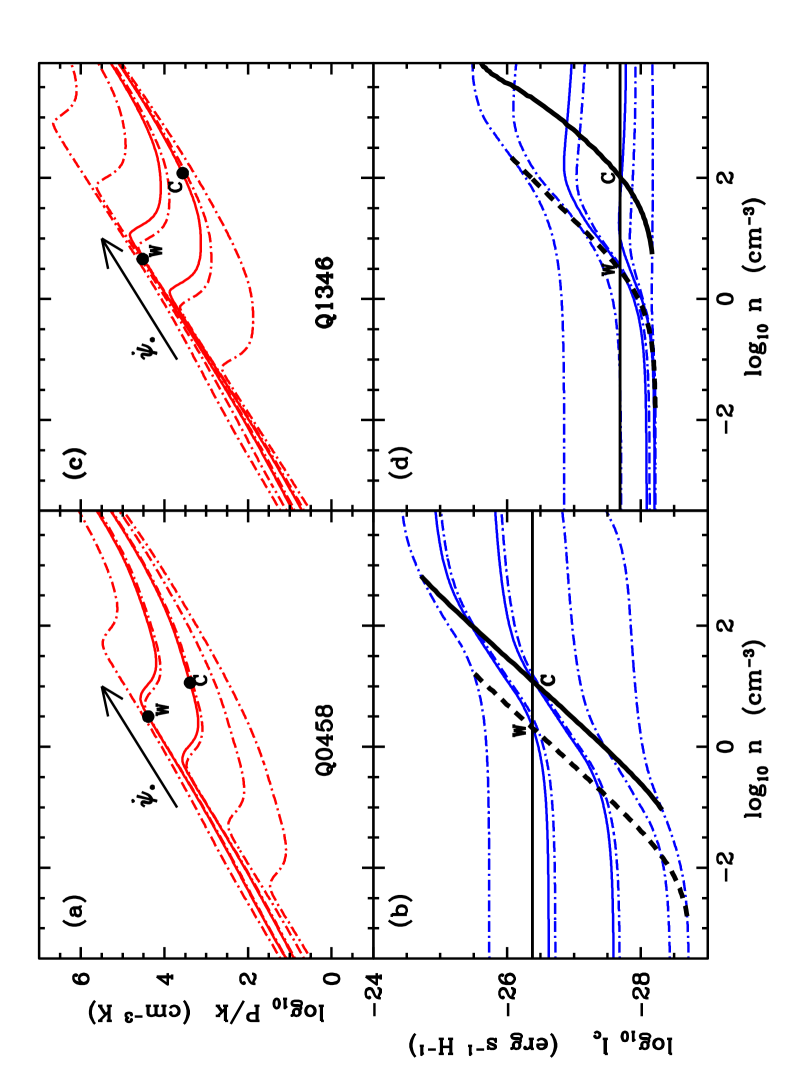
the intersection between and the equilibrium curve results in two thermally stable roots: = in the high-density CNM, and = in the low-density WNM (see also Figure 3). The steeply rising black solid curves in Figures 5b,d connect the , () pairs determined for each of the SFR grid, where () represents evaluated at the density, determined for a given . The intersections between these curves and the observed (shown as horizontal lines) determine and for each DLA. These are denoted by “C” in Figures 5b,d as are the corresponding locations in the plane. The unique () curves passing through the intersection point “C” are shown as solid blue curves, and correspond to log10 = 1.90 and 2.75 M for Q045802 and Q134603. In most cases the precise location of is unimportant as the versus curves are so flat in the CNM. Therefore, the SFRs we derive are relatively insensitive to expressions for (see discussion in Paper II). As discussed in 5.1 the heating rates averaged along the line of sight equal the heating rates at midplane to an accuracy better than 10. It follows from our steady-state assumption that the same is true for the cooling rates, and it is this which justifies the approximation, =.
Figure 5 also illustrates why Norman & Spaans (1995) suggested that all high- DLAs comprise neutral gas only in the WNM phase. Suppose for the metal-poor DLA toward Q134603 ([Si/H]=2.332) were increased to the lower limit placed on for the more metal-rich DLA toward Q045802 ([Si/H]=1.185); i.e., log10=26.38 erg s-1 H-1. In that case the SFR implied for the Q1346 DLA would be log10 = 1.2 M which is 5 times the SFR implied by the same for the Q0458 DLA. The pressure inferred for the Q134603 DLA would increase from 3103 K cm-3 to 105 K cm-3. The Norman & Spaans (1997) models required high pressures at high redshifts, since they assumed metallicity to decline rapidly with redshift. They concluded that the gravitational fields generated by low-mass galaxy progenitors in CDM models could not supply hydrostatic pressures as high as 105 K cm-3 at 3. To solve this problem these authors concluded that all the neutral gas in high-redshift DLAs must be low pressure matter in which ; i.e., the gas is a pure WNM. Though recent studies show that the metallicities of high- DLAs are not as low as assumed by Norman & Spaans (see PW02), there are other, independent arguments for DLAs comprised of pure WNM gas. Specifically, the failure to detect 21 cm absorption in high- DLAs with large H I column densities led Kanekar & Chengalur (2001) to invoke high spin temperatures as the explanation. Moreover, Liszt (2002) claimed the large CII/CI ratio detected in many DLAs as evidence for WNM gas.
For these reasons we consider the alternative hypothesis that C II∗ absorption in DLAs originates in the WNM. More specifically we suppose that all low-ion transitions in DLAs, such as Ly 1215, Si II 1527, Fe II 1608, etc., arise in low density gas with 8000 K. According to the Norman & Spaans (1997) hypothesis this occurs because ; i.e., CNM gas does not exist in high- DLAs. However, the detection of 21 cm absorption with spin temperatures, 600 K in Q045802 (Wolfe et al. 1985) and 1200 K in Q133117 (Wolfe & Davis 1979; Chengalur & Kanekar 2001) rules out a pure WNM and is consistent with the presence of CNM in some cases. As a result we retain the two-phase hypothesis, but assume the CNM covering factor is so low that many sightlines miss the CNM phase and encounter only the WNM phase. Because we assume , the density of the WNM would be given by the thermally stable root discussed above. In this case, the steeply rising dashed curves in Figure 5b,d connect the ,() pairs, and their intersections with the observed are denoted by “W”. Proceeding by analogy with the CNM model we find that log10 =0.90 and 1.75 M for the Q045802 and Q134603 DLAs respectively. Because the versus curves are flat at densities below our solution for , the precise location of is not essential in this case either. Note, the shape of the versus curves are flat in the WNM because at low densities, the FUV radiation field dominates the population of the and fine-structure states in CII through optical pumping. The increase of with is due to the increase in the pumping rate caused by the increase in FUV radiation. By contrast, the high gas densities in the CNM cause to equal the heating rate. So, in that case increases with because the heating rate rises with increasing . The effects of CMB radiative excitations should be recognizable at low , where pumping is negligible, and at high where the CMB intensity is high. They are evident in the (, ) plane for the Q134603 DLA as the sharp flat cutoff at log10 28 erg s-1 H-1. A more detailed discussion of these effects is given in Paper II.
Figures 5b,d show that the WNM solutions (points “W”) require lower densities and higher SFRs than the CNM solutions (points “C”). This generic property of WNM versus CNM solutions is a direct result of the lower fraction of total cooling due to C II∗ in the WNM models. Therefore, higher are required for () curves to intersect the observed emission rate at the lower densities characterizing the WNM. In fact, the derived for the WNM model are conservative lower limits. Had we used the criterion, the “W” intersections would occur at lower densities than indicated in Figure 5. But, there is even a more fundamental reason why higher values of are required for the WNM solutions; i.e., the absence of optical pumping.
Sarazin et al. (1979) showed that the rate of optical pumping approaches zero, if the gas is optically thick in UV transitions depopulating the ground-term fine-structure states. Optical pumping occurs when an radiative upward transition is followed by a downward radiative transition to a different state, . The net effect is to pump state . At sufficiently large optical depths pumping ceases because the lines approach detailed balance in which the pumping rates = and =. In that case the line intensities are given by the solution to the two level atom, and the level populations of the and states are determined only by the population rates among the ground terms and . In the case of C II, the ground term is a fine-structure doublet and only the resonance transitions need be optically thick for pumping to vanish. More specifically, Sarazin et al. (1979) show that pumping ceases when the quantity, = 2[()/)]1/2[1+()] is much less than 1, where and specify the optical depth and transition rates from the state to higher lying states, and specifies collisional and radiative transition rates for the transitions. The only transitions relevant for pumping are C II 1036.3 and C II 1334.5, since the remaining resonance transitions, C II 858.1, C II 903.6, and C II 904.0, have wavelengths less than 912 Å where will be negligible compared to the FUV intensities that we derive. In 5.2.2 we compute to check the WNM solutions for self-consistency.
5.2.2 Results
Using the above technique, we determined for a subset of the 33 DLAs in Table 1. The DLAs toward Q095104, Q142560, and Q144327 were omitted since in these objects only limits were placed on [Si/H] or [Fe/H]. In principle, we could have evaluated , [Si/H], and [Fe/H] at the limits we have determined. We rejected this procedure owing to the sensitivity of the inferred to and to the sensitivity of the computed versus curves to metallicity. The DLA toward Q095201 was excluded because no measurement of [Si/H] or of a relevant proxy exists. We threw out the DLAs toward Q175975 and Q234312, because of evidence that C+/C 1 and H0/H 1; i.e., the gas causing damped Ly absorption is significantly ionized (Prochaska et al. 2002a; Dessauges-Zavadsky et al. 2003). This is in contrast to most DLAs where H0/H1 (Vladilo et al. 2001). As a result, the maximal depletion subsample comprises the remaining 27 DLAs. For the minimal depletion sample we also excluded the DLAs toward Q020111 and Q234412 because the observed [Fe/Si] exceeds the assumed “nucleosynthetic ceiling” value of [Fe/Si]int= 0.2. Consequently, the minimal depletion subsample comprises the remaining 25 DLAs. The DLAs excluded from the subsamples are noted in Table 1.
| a | ||||
| M | ||||
| CNM | WNM | |||
| Dust Model | =2.15b | =3.70c | =2.15 | =3.70 |
| “Gal”d, maxe | (3.290.71)10-3 | (2.230.40)10-3 | (3.390.66)10-2 | (2.500.45)10-2 |
| “Gal”, minf | (7.931.60)10-3 | (4.521.12)10-3 | (6.471.21)10-2 | (4.380.86)10-2 |
| “SMC”g, max | (9.291.97)10-3 | (4.451.02)10-3 | (4.940.99)10-2 | (3.340.57)10-2 |
| “SMC”, min | (1.320.27)10-2 | (6.391.79)10-3 | (7.961.61)10-2 | (4.840.99)10-2 |
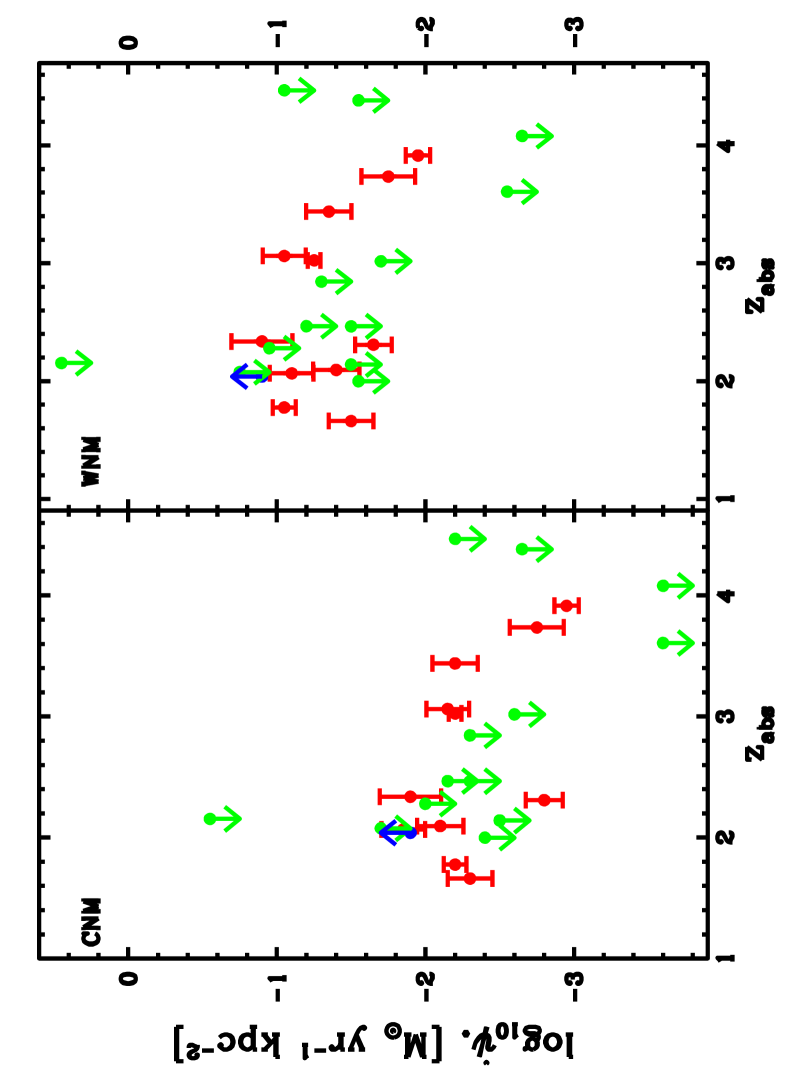
We determined for each DLA in these subsamples. Figure 6 shows the resulting plotted against redshift for both the CNM and WNM models in the case of minimal dust-to gas ratios and “Gal” dust composition. For either the CNM or WNM models the results are qualitatively similar for all four combinations of maximal or minimal dust-to-gas ratios and “Gal” or “SMC” composition. Due to the lower fraction of cooling carried by [CII] 158 m emission in the WNM, the star formation rates are at least 10 times higher for the WNM model than for the CNM model. Though the positive detections exhibit an apparent decrease in with redshift in the interval =[3,4], no statistically significant evidence for redshift evolution exists. A Kendall tau test using only positive detections shows =0.26, while the probability for the null hypothesis of no correlation, =0.26. Since there is no empirical evidence that the DLAs with limits are physically distinct from those with measured , we shall assume that all systems are drawn from the same underlying population. The lowest upper limits on at =3.608 and =4.080 are possible exceptions to this rule, as these points are outliers with systematically below the range of the main population. A self-consistent interpretation we shall explore is that the underlying population of DLAs consists of two-phase media with log10 ranging between 3 and 2 M. In most cases the sightlines pass through CNM and WNM gas. However, the sightlines through the two “outliers” (the DLAs toward Q110807 and Q223706) pass only through WNM gas in which case the SFRs fall within the range of the underlying population (see Figure 6b). If future observations reduce the upper limits on (C II∗) significantly, we would reject this hypothesis and attribute virtually all of in these two systems to excitation by the CMB (see Paper II).
Finally, we evaluated the pumping parameter, , for the 25 DLAs in the
minimal-depletion “Gal” sample. For
C II 1036.3 and C II 1334.5 we found that the WNM solutions
for resulted in 0.4 for the 11 cases of positive C II∗ detection and
that 0.2 for 8 of these. We also found 0.025 for the
DLA with a lower limit
on C II∗. Therefore, () is
likely to be lower in the WNM, and approach the cooling
rate, (shown as the dotted blue curve
in Figure 3c).
When we recomputed in the absence of optical pumping, we found that
for the WNM increased between 0.2 and 0.3 dex above the values
shown in Figure 6b. While a more realistic treatment of
optical pumping (see
Flannery et al. 1979, 1980), is necessary to compute
accurate values of in the WNM, it is obvious that the
true values for lie somewhere between the
values shown in Figure 6b and those computed in the limit
of zero pumping rates. In what follows we
adopt the “optically
thin” solutions
with pumping shown in Figure 6b. We shall re-examine
the effects of negligible pumping
in Paper II where we compute the bolometric background radiation
generated by the WNM solutions.
5.3 The Average SFR per unit area, (z)
We now determine the average star formation rate per area from our sample distribution of . This is an important statistic since as we show in Paper II the star formation rate per unit comoving volume is proportional to . Our goal is to determine in as many redshift bins as possible. This is because we wish to determine the star formation history of DLAs, and because we wish to compare our results with comoving star formation rates inferred from flux-limited samples of galaxies for multiple redshift bins (e.g. Steidel et al. 1999). We find that dividing the data into more than two redshift bins results in statistical errors in that exceed the systematic errors. As a result we split the data set at the median redshift, = 2.7, and determine in two redshift bins with redshift intervals =[1.6,2.7] and =[2.7,4.6].
While positive measurements of were inferred for many DLAs with detected , upper limits on were set for an even larger number of DLAs with upper limits on , and lower limits were set on for a single DLA with a lower limit on . The numbers for the minimal and maximal depletion subsamples are 11 and 12 positive measurements, 13 and 14 upper limits, and a single lower limit, respectively. The presence of large numbers of limits among the data sets presents a challenge in estimating . The arithmetic mean is particularly sensitive to possible large values in the system for which only a lower limit could be measured. As discussed in 5.2 we do not have empirical evidence that the systems with measured limits are physically distinct from those where the SFR has been detected. We therefore proceed from the assumption that the points with limits have been drawn from the same underlying distribution of SFRs as the detections. We use the detections to model this distribution empirically, as there is no consensus physical model for SFRs in DLAs at this redshift. We then treat the upper and lower limits as being drawn randomly from this empirical distribution truncated at the observed limit value. The mean value of the remaining probability distribution function is assigned to the data point, and the arithmetic mean of the full data set including upper and lower limits is then calculated. We have performed this calculation in two ways, using (1) the observed distribution of the detections and (2) a Gaussian in log10() fit to this observed distribution as our PDF which is then truncated by the observed limit. The second approach is designed to include a reasonable probability of high-valued outliers to which the mean is particularly sensitive, although the mean derived by this method does not differ strongly from the first method, and indeed neither mean differs strongly from the simple arithmetic mean of the detections alone. The uncertainty in the mean of our sample is then calculated using bootstrap resampling (cf. Efron & Tibshirani 1986). The bootstrap errors are larger than a nominal propagation of the errors on the individual detections because of significant scatter in the .
We computed with the two truncation approaches as well as assuming it to be the arithmetic mean of the positive detections. The results of the three techniques agree within the 1 errors indicating that is a robust statistic. As a result we henceforth assume to be given by the mean of the positive detections. Table 3 shows and the 1- errors adopted for the CNM and WNM models in the two redshift bins, for the assumptions of maximal and minimal depletion, and “Gal” and “SMC” dust composition. The errors are the quadratic sums of the bootstrap errors and errors of individual detections. Obviously the final uncertainty in is dominated by the systematic variation of the mean amongst the models. Averaging over the entries in Table 3 we find that log10=2.19 M for the CNM model, and log10=1.32 M for the WNM model. In Paper II we will reduce this systematic uncertainty by considering the consequences of cosmologically distributed DLAs with the derived SFRs.
6 CONSTRAINTS ON DUST COMPOSITION IN DLAs
Having determined the average SFRs per unit area we now examine the assumptings underlying the composition of dust to see whether they are self consistent.
The heating rate, , is proportional to , the product of the photoelectric heating efficiency of the dust grains, the FUV radiation intensity, and the abundance of the dust grains that dominate the heating. In 4.1 and the Appendix we used the dust-to-gas ratio to determine the abundance of grains that dominate the heating for both the Gal and SMC models. Our analysis implicitly assumes that the number of depleted C or Si atoms per depleted atom of Fe is the same in DLAs as in the Milky Way (see equation 6). We will now test this assumption for consistency with the lack of evidence of Si depletion in DLAs and with our assumption that Si and C are undepleted when calculating and the gaseous carbon abundance.
The depletion of Fe was determined by assuming that Si was undepleted.
In that case the depleted ratio [Fe/Si]deplete
=[Fe/Si]gas
[Fe/Si]int where the intrinsic ratio [Fe/Si]int = 0
in the case of maximal depletion and [Fe/Si]int = 0.2
in the case of minimal depletion.
Since [Fe/Si]gas typically equals 0.3, we have
[Fe/Si]deplete = 0.3
for maximal depletion, and [Fe/Si]deplete = 0.1 for
minimal depletion.
Comparison with the abundance of Zn and S implies that Si
cannot typically be depleted by more than 0.1 dex (PW02).
Over the range of
[Fe/Si] observed, this implies that measuring the relative abundance
of Fe versus a nonrefractory element with the same nucleosynthetic
history as Si such as S would generate values of [Fe/S] about
0.1 dex lower than those observed for [Fe/Si]. This implies that
our technique of using Si as an undepleted element results in
an underestimate of the dust-to-gas ratio. This is because
the ratio of based on Si to based on
S is given by
| (21) |
where we assumed [Fe/Si]int = [Fe/S]int since Si and S are both enhanced elements. Assuming [Si/S]=0.1 we find we have underestimated the dust-to-gas ratios by factors between 1.5 (maximal depletion) and 2.2 (minimal depletion), offering the possibility of reducing the SFRs by a factor of two in both the Gal and SMC models (since our estimate of , i.e., , is used to predict the dust grain abundance in both models).
For the purposes of determining the gaseous carbon abundance in DLAs, we assumed that carbon was undepleted and set [C/H]gas=[Fe/H]int. In the Gal model, however, we are relying on carbonaceous grains to dominate the heating, so carbon must be somewhat depleted. Empirical determinations of the C abundance in DLAs are not available since all detectable CII resonance lines are saturated (except in one system). In our Galaxy, it appears that at least half of the C atoms are depleted at all densities (Meyer 1999). If this is also true in DLAs it would reduce the gaseous C abundance by half and alter our thermal balance solutions such that is reduced by 0.2 dex; this is a mild change in our results that leads to no qualitative differences in our conclusions. It seems more likely that the overall carbon depletion level is lower in DLAs due to the reduced metallicity. In particular, the SMC model has a reduction in the abundance of carbonaceous grains and therefore it is likely that the vast majority of carbon is gaseous.
Without much knowledge of the composition of dust outside our own Galaxy, it is difficult to estimate the systematic uncertainty introduced by our assumption that the number of depleted Si and C atoms per depleted Fe atom is the same in DLAs as in the Milky Way. If there really is a base level of C depletion independent of density and metallicity, this implies that using underestimates the true number of depleted carbon atoms. However, this may still give a reasonable estimate of the small carbonaceous grains which dominate the heating but do not appear to be part of the base depletion in our Galaxy (Sauvage & Vigroux 1991). The uncertainty in the abundance of small carbonaceous grains is bracketed by the range of models for the size distribution of dust grains in Weingartner & Draine (2001b). The fraction of depleted C atoms in small carbonaceous grains could be a factor of two lower than implied by the extrapolated MRN size distribution used by our adopted Bakes & Tielens (1994) model, which would reduce the photoelectric heating efficiency by a factor of two and thereby increase our inferred star formation rates by a factor of two. Reducing the overall number of depleted C atoms could make the SFRs even higher, but reducing the small carbonaceous grain population by more than a factor of three makes silicate grains dominate the heating, in which case the Gal model becomes the SMC model. Alternatively, the fraction of depleted C atoms contained in small grains could be increased by up to a factor of four. If this is the case, or if indexing to Fe has underestimated the carbon depletion, small carbonaceous grains could be more abundant than our assumptions imply, leading to higher heating efficiency, reduced star formation rates, and a stronger 2175Å bump. Observational limits on the strength of the 2175Å bump in DLAs make it difficult for small carbonaceous grains to be more than a factor of a few more abundant than we have supposed (Pei et al. 1991). Tighter observational limits on (and possibly detection of) the 2175Å bump in DLAs are of the utmost importance in reducing the systematic uncertainties in the nature of dust at these redshifts.
In the SMC model, we suppose the complete absence of small carbonaceous grains as inferred from the lack of the 2175Å bump. This allows one to lower the depletion level of Si considerably and still have silicate grains dominate the heating. Since Fe is almost completely depleted in diffuse regions of the Milky Way, we are likely to overestimate the ratio of in a lower metallicity region, since our prescription for computing in the Appendix would be an underestimate. This appears to be the case for the SMC, where absorption by clouds along the lines-of-sight to Sk 108 and Sk 155 show [Si/Zn]=0, implying a lack of silicon depletion, but [Si/Fe]=0.5, indicating that iron is significantly depleted (Welty et al. 1997; 2001). In the diffuse regions of the Galaxy modeled by Weingartner & Draine (2001b), 75% of the Si atoms and 95% of the Fe atoms are depleted, but in the SMC it appears that no more than 20% of the Si atoms are depleted even though 70% of the Fe atoms are. This implies that indexing to the Fe depletion overestimates the number of depleted Si atoms by at least a factor of three if DLAs are like the SMC. This uncertainty is somewhat balanced by the uncertainty in the fraction of Si atoms contained in small ( Å ) grains. In the models of Weingartner & Draine (2001b), this varies from the fraction we have assumed up to a factor of three higher. Therefore, the abundance of small silicate grains dominating the heating is unlikely to be more than a factor of three higher than we have assumed; if it were, the DLA star formation rates for the SMC model would be less than or equal to our current Gal model results. It is possible, on the other hand, to decrease the amount of Si depletion by an arbitrary amount, which would increase the inferred DLA star formation rates. For the WNM solution, this would worsen the conflict with observational limits on the integrated background light discussed in Paper II. For both WNM and CNM solutions, it exacerbates the general problem of overproduction of metals in DLAs discussed in Paper II. For the CNM solution, doubling the SMC model star formation rates for DLAs at begins to exceed the observational limit on the background light as discussed in Paper II. Hence the integrated background light constrains the abundance of small silicate grains in DLAs to be at least half of that of the Milky Way.
7 SUMMARY
The conventional view of DLAs is they are high- neutral gas layers with low metallicities, low dust content, and quiescent velocity fields. In this paper we have developed a new technique providing a more complete picture. Using the C II∗ absorption method we find that rather than being passive objects transmitting light from background QSOs, DLAs are the sites of active star formation, and that neutral gas in DLAs is likely to be a two-phase medium. At this stage of our analysis it is unclear whether C II∗ absorption arises in the CNM or WNM phase. Our results are as follows.
(1) Our technique assumes that massive stars forming out of neutral gas in DLAs emit FUV radiation that heats the gas by ejecting photoelectrons from dust grains known to be present in the gas. We can infer the heating rate since in steady state conditions it equals the cooling rate that is directly measurable. This is because cooling is dominated by [C II] 158 m emission if the gas is a cold neutral medium (CNM), and [C II] 158 emission per H atom can be obtained by measuring C II∗ 1335.7 absorption arising from the 2P3/2 excited fine-structure state in the ground term in C+. The heating rate equals the product of the dust-to-gas ratio, the mean intensity of FUV emission, , and the grain photoelectric heating efficiency, . We can measure since the cooling rate is inferred directly from the column density (C II∗), the dust-to-gas ratio can be computed from element abundance patterns, and is well determined provided the gas is CNM. By measuring , we measure the SFR per unit area, , since in a plane parallel layer.
(2) We have measurements of C II∗ 1335.7 absorption in 33 DLAs; 16 of these are positive detections, 15 are upper limits, and 2 are lower limits. We use these data to infer the spontaneous energy emission rate per H atom, , from the ratio (C II∗)/(HI). We find that in DLAs is typically about 1/30 times measured for the ISM of the Galaxy. Because equals the cooling rate in the CNM, in our model equals the heating rate, which is proportional to , where is the dust-to-gas ratio in DLAs relative to the ISM. Since is also about 1/30, the implication is that in DLAs is similar to that in the ISM. In other words, in DLAs is similar to the local in the ISM, provided C II∗ absorption arises in a CNM.
(3) We compute thermal equilibria of gas subjected to grain photoelectric heating and standard cooling processes. Since the dust content of DLAs is not well determined, we consider a “Gal” model in which the grains are mainly carbonaceous, and heating is dominated by small ( 15 Å) grains and PAHs, and an SMC model in which heating is dominated by small silicate grains. We compute from the observed depletion of Fe in each DLA and assume that the number of C or Si atoms depleted onto grains per depleted Fe atom is the same in DLAs as in the Galaxy. We also consider models with minimal and maximal depletion to account for the uncertainties in the Fe depletion levels. We include heating and ionization due to cosmic rays and soft X-rays. When computing cooling rates we account for excitation of the C+ fine-structure levels by CMB radiation. We also account for excitation due to optical pumping by FUV radiation, but find that optical pumping may not be significant owing to the high opacity in the C II resonance lines. Equating heating and cooling rates, we find the resulting equilibrium curves of pressure versus density to exhibit a maximum pressure, , and minimum pressure, . A two-phase medium in which a dilute warm neutral medium (WNM) is in pressure equilibrium with a dense CNM is possible if the equilibrium pressure, , satisfies the constraint . Therefore, C II∗ absorption can occur in the WNM or the CNM. Because equals the cooling rate in the CNM, but is a small fraction of the cooling rate in the WNM, the SFRs implied from a measured are much higher in the WNM than the CNM.
(4) We calculate for selected subsets of our DLA sample corresponding to “Gal” or “SMC” dust, and to minimal or maximal depletion. We first solve the transfer equation for sources of FUV ( 1500 Å) radiation (OB stars) uniformly distributed throughout a plane parallel disk. Using standard reddening curves for “Gal” and “SMC” dust we find the disks to be optically thin parallel to the plane for most of our sample DLAs. As a result, the inferred from C II∗ absorption are representative of the entire DLA rather than just regions along the QSO sightline. To infer from measurements of and we assume the equilibrium pressure, =. As expected, we find two solutions; one in which C II∗ absorption occurs in the WNM, and the other in which C II∗ absorption occurs in the CNM. For the CNM solution we find 3.0 log10 2.0 M, and 2.0 log10 1.0 M for the WNM solution. Neither case shows evidence for redshift evolution in the interval = [1.6,4.5]. In Paper II we discriminate between these models by deriving cosmological constraints such as the bolometric background radiation.
(5) Our assumptions that C and Si are undepleted in determining the gaseous C abundance and the dust-to-gas ratio are reasonable and do not create serious contradictions with the heating being dominated by carbonaceous or silicate grains, because the C and Si depletion levels in DLAs appear to be quite low. Varying the size distribution of carbonaceous grains and the number of depleted C atoms per depleted Fe atom could make the SFRs reported for the Gal model as high as those of the SMC model, but one cannot lower the SFRs too far since the 2175Å bump has not been observed in high redshift DLAs. Varying the number of depleted Si atoms per depleted Fe atom could make the SFRs reported for the SMC model as high as allowed by the integrated background limits, and varying the size distribution of silicate grains could make the SFRs a factor of three lower.
Appendix A DUST TO GAS RATIO
Consider a box containing iron atoms. If atoms are in the gas phase and atoms are locked up in grains, then
| (A1) |
Because we cannot measure due to depletion of Fe atoms onto grains, we shall use Si as a proxy as Si is essentially undepleted in DLAs (see PW02). Therefore, we assume = where , the total number of Si atoms also equals the number of gas-phase Si atoms, and is the intrinsic (i.e., undepleted) ratio of Si to Fe. Let the dust-to-gas ratio /. As a result
| (A2) |
where is the number of H atoms. Since , where is the dust-to-gas ratio of the current Milky Way Galaxy, and assuming that =(Fe/H)⊙, since Fe is almost entirely depleted, we find
| (A3) |
Factoring Fe/H=(Fe/Si)(Si/H) we find
| (A4) |
As a result
| (A5) |
where we assume [Si/H]=[Si/H]int.
References
- adelberger (1998) Adelberger, K. L, Steidel, C. C., Giavalisco, M., Dickinson, M. E. & Pettini, M. 1998, ApJ, 505, 18
- bakes (1994) Bakes, E. L. O. & Tielens, A. G. G. M. 1994, ApJ, 427, 822
- carretta etal (2000) Carretta, E., Gratton, R. G., & Sneden, C. 2000, A&A, 356 238
- cheng (2000) Chengalur, J. N., & Kanekar, N. 2000 MNRAS, 318, 303.
- Dessauges-Zavadsky et al. (2001) Dessauges-Zavadsky, M., D’Odorico, S., McMahon, R. G., Molaro, P., Ledoux, C., Peroux, C., & Storrie-Lombardi, L. J., 2001, A&A, 70, 426
- draine (1978) Draine, B. T. 1978, ApJS, 36, 595
- Efron & Tibshirani (1986) Efron, B. & Tibshirani, R. J. 1993, An Introduction to the Bootstrap, (New York: Chapman & Hall)
- efstathiou (2000) Efstathiou, G. 2000, MNRAS, 317, 697
- Ellison et al. (2001) Ellison, S. L., Pettini, M., Steidel, C. C., & Shapley, A. E. 2001, ApJ, 549, 770
- Fall (1989) Fall, S. M., & Pei, Y. C. 1989, ApJ, 337, 7
- Flannery (1979) Flannery, B. P., Rybicki, G. G., & Sarazin, C. L., 1979, ApJ, 229, 1057
- Flannery (1980) Flannery, B. P., Rybicki, G. G., & Sarazin, C. L., 1980, ApJS, 44, 539
- Gazol (2001) Gazol, A., Vazquez-Semadeni, E., Sanchez-Salcedo, F. J., & Scalo, J. 2001, ApJ, 557, L121
- Gry etal (1992) Gry, C., Lequex, J., & Boulanger, F. 1992, A&A, 266, 457
- habing (1968) Habing, H. J. 1968, Bull. Astr. Netherlands, 19, 421
- Haehnelt et al. (1998) Haehnelt, M. G., Steinmetz, M., & Rauch, M. 1998, ApJ, 495, 647
- Heiles (2001) Heiles, C. 2001, ApJ, 551, L105
- hollenbach (1999) Hollenbach, D. J., & Tielens, A. G. G. M. 1999, Rev. Mod. Phys., 71, 173
- Junkk etal (2002) Junkkarinen, V. T., Cohen, R. D., Beaver, E. A., Burbidge, E. M., Lyons R. W., & Madejski, G. 2002, ApJ, submitted
- Kankek (2001) Kanekar, N., & Chengalur, J. N. 2001, A&A, 369, 42.
- Kennicutt (1998) Kennicutt, R. C.,Jr. 1983, ApJ, 272, 54
- Kennicutt (1998) Kennicutt, R. C.,Jr. 1998, ARA&A, 36, 189
- Kritsuk (2002) Kritsuk, A. G., & Norman, M. L. 2002, ApJ, 569, L127
- lanzetta etal (2002) Lanzetta, K. M., Noriaki, Y., Pascarelle, S., Chen, H.-W., & Fernandez-Soto, A., 2002, ApJ, 570, 492
- Liszt (2002) Liszt, H. 2002, A&A, 389, 393, 42
- Lu et al. (1997) Lu, L., Sargent, W.L.W., & Barlow, T.A. 1997, astroph/ 9711298
- Mckee (1990) Mckee, C. F. 1990, in “Evolution of the Interstellar Medium”, ed. L. Blitz, (San Francisco: ASP), 3
- Madau (1996) Madau, P., Ferguson, H. C., Dickinson, M. E., Giavalisco, M., Steidel, C. C., & Fruchter, A. 1996, MNRAS, 283, 1388
- Madau (2000) Madau, P., & Pozzetti, L. 2000, MNRAS, 312, L9
- Madden (1993) Madden, S. C., Geis, N., Genzel, R., Herrmann, F., Jackson, J., Poglitsch, A., Stacey, G. J., & Townes, C. H. 1993, ApJ, 407, 579
- Mckee (1977) McKee, C. G., & Ostriker, J. P. 1977, ApJ, 218, 148
- Meyer (1999) Meyer, D.M., 1999, in Chemical Evolution from Zero to High Redshift, (SpringerVerlag: Berlin), 44
- Motta (2002) Motta, V., Mediavilla, J. A., Munoz, J. A., Falco, E., Kochanek, C. S., Arribas, S., Garcia-Lorenzo, G., Oscoz, A., & Serra-Ricart, M., 2002, astroph-ph/0204130
- Pei (1991) Pei, Y. C., Fall, S. M., & Bechtold, J. 1991, ApJ, 378, 6
- Pei (1995) Pei, Y. C., & Fall, S. M. 1995, ApJ, 454, 69
- Pei (1999) Pei, Y. C., Fall, S. M., & Hauser, M. G. 1999, ApJ, 522, 604
- Petit (2000) Petitjean, P., Srianand, R., & Ledoux, C. 2000, A&A, 364, L26
- Petit (2000) Petitjean, P., Srianand, R., & Ledoux, C. 2003, MNRAS, 332, 383
- Peebles (1993) Peebles, P. J. E. 1993, in Principles of Physical Cosmology, (Princeton University Press: Princeton), p. 562
- Pettini (1994) Pettini, M., Smith, L. J., Hunstead, R. W., & King, D. L. 1994, ApJ, 426, 79
- Pettini (1999) Pettini, M. 1999 astro-ph 9902173
- Pettini et al. (2001) Pettini, M., Shapley A. E., Steidel, C. C., Cuby, J.-G., Dickinson, M., Moorwood, A. F. M., Adelberger, K. L., & Giavalisco, M. 2001, ApJ, 554, 981
- Pottasch (1979) Pottasch, S. R., Wesselius, P. R., & van Duinen, R. J. 1979, A&A, 77, 189
- Prochaska and Wolfe (1996) Prochaska, J. X. and Wolfe, A. M. 1996, ApJ, 470, 403
- Prochaska and Wolfe (1997) Prochaska, J. X. and Wolfe, A. M. 1997, ApJ, 487, 73 (PW97)
- Prochaska et al. (2001) Prochaska, J. X., Wolfe, A. M., Tytler, D., Burles, S., Cooke, J., Gawiser, E., Kirkman, D., O’Meara, J., & Storrie-Lombardi, L. J. 2001, ApJS, 137, 21
- Prochaska et al. (2002) Prochaska, J. X., Howk, J. C., O’Meara, J., Tytler, D., Wolfe, A. M., Kirkman, Lubin, D., & Suzuki, N. 2002, ApJ, 571, 693
- Prochaska (2002) Prochaska, J. X. 2002, astroph/ 0209193
- Prochaska and Wolfe (2002) Prochaska, J. X. and Wolfe, A. M. 2002, ApJ, 566, 68 (PW02)
- Roberts (1963) Roberts, M. S. 1963, ARA&A, 1, 149
- Sauvage (1991) Sauvage, M. & Vigroux, L. 1991, in The Magellanic Clouds: Proceedings of the148th Symposium of the IAU (Kluwer; Dordrecht), 407
- silva (2002) Silva, A. I., & Viegas, S. M. 2002, A&A, 329 135S
- song (2001) Songaila, A. & Cowie, L. 2001, private communication
- Srianand et al. (2000) Srianand, R., Petitjean, P., & Ledoux, C. 2000, Nature, 408, 931
- Steidel (1999) Steidel, C. C., Adelberger, K. L., Giavalisco, M., Dickinson, M., & Pettini, M. 1999, ApJ, 519, 1
- lisa (2000) Storrie-Lombardi, L. J. & Wolfe, A. M. 2000, ApJ, 543, 552
- Tinsley (1980) Tinsley, B. M. 1980, Fund. Cos. Phys., 5, 287
- Vazquez (2000) Vazquez-Semadeni, E., Gazol, A., & Scalo, J. 2000, ApJ, 540, 271
- Vogt (1994) Vogt, S. S., Allen, S. L., Bigelow, B. C., Bresee, L., Brown, B., Cantrall, T., Conrad, A., Couture, M., Delaney, C., Epps, H. W., Hilyard, D. F., Horn, E., Jern, N., Kanto, Dl, Keane, M. J., Kibrick, R. I., Lewis, J. W., Osborne, J. Pardeilhan, G. H., Pfister, T., Ricketts, T., Robinson, L. B., Stover, R. J., Tucker, D., Ward, J., & Wei. M. Z. 1994, SPIE, 2198, 362
- Weingartner & Draine (2001) Weingartner, J. C. & Draine, B. T. 2001a, ApJS, 134, 263
- Weingartner & Draine (2001) Weingartner, J. C. & Draine, B. T. 2001b, ApJ, 548, 296
- Welty (1997) Welty, D.E. et al., 1997, ApJ, 489, 676
- Welty (2001) Welty, D.E., Lauroesch, J. T., Blades, J. C., Lewis, M., & York, D. G. 2001, ApJ, 554, 75
- Wolfe (1979) Wolfe, A. M., & Davis, M. M., 1979, AJ, 84, 699
- Wolfe (1985) Wolfe, A. M., Briggs, F. H., Turnshek, D. A., Davis, M. M., Smith, H. E., & Cohen, R. D. 1985, ApJ, 294, L67
- Wolfe (1979) Wolfe, A. M., Gawiser, E., & Prochaska, J. X. 2003, ApJ, to be published (Paper II)
- Wolfire et al. (1995) Wolfire, M. G., Hollenbach, D., McKee, C. F., Tielens, A. G. G. M., & Bakes, E. L. O. 1995, ApJ, 443, 152 (W95)
- Wolfire et al. (2002) Wolfire, M. G., McKee, C. F., Hollenbach, D., & Tielens, A. G. G. M. 2002, astrophy/0207098
- Wright (1991) Wright, E. L., Mather, J. C., Bennett, C. L., Cheng, E. S., Shafer, R. A., Fixsen, D. J., Eplee, R. E., Isaacman, R. B., Read, S. M., Boggess, N. W., Gulkis, S., Hauser, M. G., Janssen, M., Kelsall, T., Lubin, P. M., Meyer, S. S., Moseley, S. H., Murdock, T. L., Silverberg, R. F., Smoot, G. G., Weiss, R., & Wilkinson, D. T. 1991, ApJ, 381, 200
- zelpik (1969) Zel’dovich, Y. B., & Pikel’ner, S. B. 1969, JETP, 29, 170