The fate of star clusters near the Galactic center I: Analytic considerations
Abstract
A star cluster in a galactic nucleus sinks toward the galactic center due to dynamical friction. As it spirals inward, the cluster loses mass due to stellar evolution, relaxation driven evaporation, and tidal stripping, eventually dissolving in the galactic tidal field. We model the inspiral of dense young star clusters near the center of our Galaxy to study the extent of the region of parameter space in which the cluster can reach the inner parsec of the Galaxy within a few million years. Since we neglect changes in cluster structure due to internal evolution, the present study is most applicable to star clusters less than about one initial relaxation time old. We find that only star clusters with initial masses can reach the Galactic center from an initial distance of pc within one initial relaxation time or a few million years, whichever is smaller.
1 Department of Physics,
Drexel University,
Philadelphia, PA 19104, USA
2 Astronomical Institute ‘Anton Pannekoek’,
University of Amsterdam, Kruislaan 403
2 Institute for Computer science,
University of Amsterdam, Kruislaan 403
⋆ SPZ is a KNAW Fellow
1 Introduction
The innermost pc of the Milky Way Galaxy contains a number of intriguing objects. These include the central black hole (Genzel et al. 2000; Ghez et al. 2000), a cluster containing at least 15 massive young stars (Tabmley & Rieke 1993; Krabbe et al. 1995), a much larger population of older stars (Alexander 1999), and at least two young dense star clusters—the Arches and the Quintuplet systems (Nagata et al. 1995; Nagata et al. 1990; Okuda et al. 1990).
Krabbe et al. (1995) found bright He I emission line stars in the Galactic center. They are part of the co-moving 7–8 Myr old association known as IRS 16 (Tamblyn & Rieke 1993; Krabbe 1995), and are accompanied by many less luminous stars of spectral types O and B (Genzel et al. 2000). Detailed spectroscopic analysis of the Galactic center region (Najarro et al. 1994) indicate that these emission-line stars are evolved, with a high surface ratio of helium to hydrogen to 1.67. Allen et al. (1990) classify them as Ofpe/WN9 stars, while Najarro et al. (1997) identify them as 60–100 Luminous Blue Variables (LBVs), the late evolutionary stages of very massive stars (Langer et al. 1994). Depending on the interpretation of the data, the age of IRS 16 therefore lies in the range 3–7 Myr, the lower figure corresponding to the LBV identification.
One possible explanation for these stars is a recent starburst (Krabbe et al. 1995). However, this model is problematic, as the formation of stars within a parsec of the Galactic center is difficult; the Galactic tidal field is sufficient to unbind gas clouds with densities cm-3 (Güsten & Downes 1980). Gerhard (2001) has proposed that a million-solar-mass star cluster formed at a distance of pc from the Galactic center could have reached the Galactic center via dynamical friction before being disrupted by the Galactic tidal field or by internal dynamical evolution. This qualitative argument solves the problem of the presence of young, very massive stars in the Galactic center. Gerhard’s dynamical friction time scale assumed that the stellar density in the vicinity of the Galactic center is described by an isothermal sphere; in addition, he ignored stellar mass loss and the internal dynamical evolution of the cluster. In this paper we present a more quantitative approach to the problem.
This is the first in a series of papers in which we consider the time scale on which a star cluster sinks to the Galactic center and is disrupted by the Galactic tidal field. In the semi-analytic calculations presented here, we study the inspiral of three quite different cluster models. We begin with the simplifying approximation that the inspiraling object has constant mass. Later, we relax that assumption and allow the cluster to lose mass, first by tidal stripping, then also by stellar evolution and relaxation. For definiteness, and for purposes of illustration, we adopt a simple analytic prescription for mass loss from the evolving cluster, and investigate its consequences. In a future paper we will incorporate more realistic treatments of cluster dynamics.
The organization of this paper is as follows. In §2 we first consider the orbital decay of a unevolving point mass. In §3 we expand our study to include clusters of nonzero radii, allowing their masses to evolve in time as material is stripped by the Galactic tidal field. The introduction of physical parameters into our models then allows us to incorporate simple treatments stellar mass loss and evaporation within our simple model. In §4 we apply the model to star clusters near the Galactic center, to determine the region of parameter space in which clusters can transport a considerable fraction of their initial mass to within a few parsecs of the Galactic center before disruption. We discuss our results and conclude in §5.
2 Inspiral with constant mass
We begin our study with the simplifying assumption that the mass of the inspiraling object is constant. This idealization may be appropriate for a single massive black hole or a very compact star cluster which is much smaller than its Jacobi radius, the limiting radius of a cluster in the tidal field of the Galaxy. In the latter case, however, for the constant-mass approximation to hold, internal dynamical evolution of the cluster should also be negligible on the time scale on which the cluster sinks to the Galactic center. In practice, especially for small clusters, this will not be the case, as we discuss in §5.
2.1 Dynamical friction
We characterize the mass within a sphere with radius centered on the Galactic center as a power law:
| (1) |
where and are constants, with of interest here. The density at distance then is
| (2) |
and we can write down expressions for the orbital acceleration at distance from the Galactic center
| (3) |
the potential
| (4) |
the circular velocity
| (5) |
and the total energy of a circular orbit
| (6) |
The object’s acceleration due to dynamical friction is (Binney & Tremaine 1987, p. 425)
| (7) |
Here, is the mass of the object, is its velocity vector (in a circular orbit around the Galactic center), is the Coulomb logarithm (where is the object’s characteristic radius—roughly the half-mass radius in the case of a cluster), is the gravitational constant, and
| (8) |
where and is the local one-dimensional velocity dispersion, assumed isotropic.
2.2 Orbital decay
We can now derive the inspiral time scale for a star cluster with constant mass in a power-law density profile given by Eq. (1). The time derivative of Eq. (6) is
| (11) | |||||
where the second equation expresses the work done by dynamical friction (Eq. 9). Hereafter, should be interpreted as , the distance from the cluster in question to the Galactic center. Substitution of Eqs. (2) and (5) leads to
| (12) |
whence
| (13) |
where
| (14) |
3 Clusters with variable mass
We now consider the possibility that the mass of the cluster varies with time: . Most mass loss from the cluster is the result of tidal stripping as the cluster sinks toward the Galactic center. We begin by determining the Jacobi (tidal) radius of the cluster in the tidal field of the Galaxy.
3.1 Mass of a tidally limited cluster
The differential acceleration at distance from the center of the cluster is obtained from Eq. (3):
| (18) |
or, relative to the internal cluster acceleration at ,
| (19) |
Here and , the cluster mass within radius (still to be determined), will henceforth be identified as the cluster mass. Setting , we find
| (20) |
This may be conveniently (and conventionally) expressed in terms of average densities and , as
| (21) |
To proceed further, we must make a connection between and . Two particularly simple cluster density profiles lend themselves easily to analytic development:
-
1.
A homogeneous sphere of mass , radius , and uniform density
(22) - 2.
Note that, in each case we assume fixed parameters and —that is, we neglect structural changes in the cluster due to dynamical evolution or stellar mass loss. This assumption greatly simplifies the calculation, but clearly is of questionable validity when the internal dynamical time scales are comparable to the inspiral time (see §5). In the next subsection we expand our model to allow for the effects of mass loss due to stellar evolution and escaping stars. A more complete treatment of the cluster’s structural evolution will be the subject of a future paper.
For the homogeneous sphere (case 1), the desired relation between and is simple:
| (24) |
No solution to Eq. (21) exists for , and the cluster is destroyed at Galactocentric radius
| (25) |
Outside , and . Inside, .
For the Plummer model (case 2),
| (26) |
and again, no solution exists for . Outside , satisfies
| (27) |
The mass of the cluster is then given by Eq. (21):
| (28) |
We use this model as the basis for our discussion in the remainder of the paper.
3.2 Mass loss from stellar evolution
Many clusters dissolve so quickly that stellar evolution barely affects their mass. However, if the cluster survives for more than a few million years, mass loss from the most massive stars may become important (see McMillan 2003 for a recent review). Recent detailed N-body simulations by Portegies Zwart et al. (2001) have quantified the expansion of a tidally-limited cluster as its mass decreases. The expansion drives more rapid disruption, while the mass loss slows the inspiral.
We include stellar mass loss in our model as follows. First we rewrite Eq. (28) as , where (R) is the number of stars within the Jacobi radius and is the mean stellar mass, which is now a function of time due to stellar evolution. We assume that the mass functions of the cluster and of the escaping stars are identical. (Again, this is equivalent to the neglect of internal dynamical evolution.) We parametrize the cluster’s expansion in response to stellar mass loss by
| (29) |
which is equivalent to the assumption that the cluster loses mass adiabatically, as found by Portegies Zwart et al. (2001).
The mean mass in the cluster can be computed from the initial mass function. For clarity we assume that all the mass in stars having masses above the cluster’s turn-off mass is simply lost from the cluster. So long as the turn-off mass exceeds this assumption is justified by the high-velocity kick imparted to compact objects by the supernovae in which they form, allowing them to escape from the cluster. For older clusters this assumption breaks down as lower-mass stars turn into white dwarfs, which do not receive high velocities at formation, although such clusters are not of direct interest in the present paper. Integrating the initial mass function, we find
| (30) |
Here is the exponent for the (assumed) power-law mass function (Salpeter: ), is the cluster turn-off mass, and is the lower mass limit. We determine the turn-off mass using fits to the stellar evolution models of Eggleton, Fitchet & Tout (1998).
3.3 Mass loss due to relaxation
A tidally limited star cluster in the tidal field of the Galaxy will also lose mass due to internal relaxation as occasional interactions between cluster members result in velocities high enough for stars to escape the cluster potential. Portegies Zwart & McMillan (2002) have simulated star clusters near the Galactic center; they derive the following approximate expression for relaxation-driven cluster mass loss:
| (31) |
Here is the relaxation time at the cluster tidal radius,
| (32) |
where is the number of stars contained within the Jacobi radius.
The clusters in the study of Portegies Zwart & McMillan (2002) did not spiral in to the Galactic center, so the relaxation time at the tidal radius remained constant over the lifetime of the cluster. In our case, where clusters sink toward the Galactic center, the relaxation time at the tidal radius changes with time. We therefore recast Eq. (31), as follows. Differentiating Eq. (31) with respect to time, identifying with and with the instantaneous relaxation time at , and including the radial dependence of the relaxation time, assuming a tidally limited cluster, we obtain
| (33) |
For the purposes of this paper, we draw a distinction between the processes of tidal stripping, in which stars outside the Jacobi radius are removed by the Galactic tidal field as the cluster sinks toward the Galactic center and the Jacobi radius shrinks, and evaporation, in which stars are driven across the instantaneous Jacobi radius by internal two-body relaxation. All models discussed in the following section include tidal stripping; models discussed in §4.2 and subsequently also include both evaporation-driven and stellar-evolution mass loss.
4 Results
From §2.2, the distance from the cluster to the Galactic center satisfies
| (34) |
(Eqs. 13 and 14), with at . Transforming to dimensionless variables and , and substituting Eq. (14), we rewrite this equation in the form
| (35) |
For a Plummer model, the cluster mass varies as a function of and therefore via Eq. (28). We solve Eq. (35) numerically, as it admits no simple analytic solution. For all models we adopt and (Sanders & Lowinger 1972, Mezger et al. 1999).
For simplicity we assume that for the remainder of this section, unless indicated otherwise. A value of or 1.3 is probably more appropriate (Binney & Tremaine 1987; Spinnato, Fellhauer & Portegies Zwart 2003). The dynamical friction time scale is inversely proportional to (see Eq. 16), so the effects of different choices can be easily estimated.
4.1 Solutions without stellar evolution
For systems without significant stellar mass loss or evaporation, the evolution may be conveniently parametrized by the dimensionless quantities
| (36) |
The contours and gray shades in Fig. 1 present the dissolution time () of the cluster as a function of and .
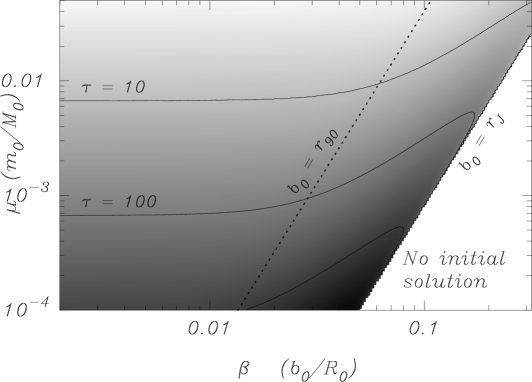
Fig. 1 shows that compact, massive clusters have the shortest lifetimes, that the lifetime decreases with increasing mass at fixed initial cluster radius (), increases with increasing radius at fixed mass, and is largely independent of the radius for small radii. This last point simply means that clusters initially well inside their Jacobi radii () experience significant stripping only near the end of the inspiral process. There is no initial solution when , i.e. when .
Since the stellar density diverges toward the Galactic center, no extended cluster can actually reach (although a black hole can). Fig. 2 shows the cluster’s distance to the Galactic center as a function of time (again in units of the initial orbital period of the cluster around the Galactic center) for several selected values of and . Not surprisingly, more massive clusters (larger values of ) spiral in more quickly, and physically larger clusters (larger ) dissolve at larger distances from the Galactic center.

The long lifetimes of clusters with (see Fig. 1) and small values of are due to the weak effect of dynamical friction in those cases. Since we ignore stellar mass loss and internal dynamical evolution (specifically, evaporation) in this simple model, such clusters survive for unrealistically long times. In practice, these systems will be strongly affected by stellar evolution and evaporation, as we now demonstrate.
4.2 Evolution with stellar mass loss and relaxation
By selecting the Galactic center as representative nucleus we can attach physical units to the selected values of and . The advantage of introducing physical parameters is that the numbers become more intuitive, but of course we lose the scale-free solution from previous section. Another advantage of fixing the scaling is that we can take stellar evolution and internal relaxation into account. Stellar mass loss (via Eq. 30) and evaporation (via Eq. 33) are included by solving Eq. (35). For most calculations we adopted a Salpeter initial mass function between 0.1 and 100 . The effect of relaxing this assumption is illustrated in Fig. 5 below.
Fig. 3 shows distances to the Galactic center as functions of time of model clusters having initial masses of 64,000 (a) and 256,000 (b). For each selected initial distance ( pc, 4 pc, 8 pc and 16 pc) we choose a range of initial values for the cluster scale pc, 0.4, and 0.8 pc. The choice of , pc, and pc corresponds to the “standard” model indicated in Fig. 2. These models were computed taking both stellar mass loss and evaporation into account. Models with (point mass case, without stellar mass loss or evaporation) are also included for comparison; they are identical to the calculations presented in Fig. 2.
(a) (b)
(b)
Due to the extra mass-loss channels (stellar evolution and evaporation) and the resultant reduction in the inspiral (and hence tidal stripping) rate, the lifetimes of the clusters shown in Fig. 3 may be either longer or shorter than those of clusters in which stellar evolution is neglected (as in Fig. 2). This is illustrated in Fig. 4 for models having and , 0.025 (the “standard” model) and 0.0125. Dimensionless times are converted to megayears using an orbital period of 0.30 Myr, appropriate to a cluster at an initial distance of 8 pc from the Galactic center. The dotted curves show the evolution of the dimensionless models in which only tidal stripping is included. The solid, dashed and dash-3-dotted curves present the same models with stellar evolution and evaporation taken into account. At a distance of 8 pc from the Galactic center, the values of , 0.025, and 0.0125 correspond to pc, 0.2 and pc, respectively.
Compact clusters ( pc) are relatively unaffected by tidal stripping. As a result, the primary effect of stellar mass loss is simply to decrease the inspiral rate, increasing the cluster lifetime. However, in larger clusters ( pc) the expansion caused by stellar mass loss greatly increases the stripping rate, significantly decreasing the lifetime despite the slower inspiral. For very low-mass, or very large, clusters relaxation and evaporation may dominate. However for the cases studied here the effect is almost negligible. This is illustrated by the first few million years of evolution of clusters with large , such as the dash-3-dotted curve in Fig. 4. The small deviation of the pc curve from the dotted curve during the first Myr is the result of relaxation.

Fig. 5 illustrates how varying the cluster initial mass function alters the time evolution of its Galactocentric radius and mass. The dotted curve (Fig. 5a only) shows the constant point-mass case for . The solid curve shows the evolution of the standard model with , scaling times to megayears assuming an initial Galactocentric distance of 8 pc. The dashed curves give the results when stellar mass loss and evaporation are taken into account, assuming lower mass limits for the initial mass function of 0.1 , 0.2 , 0.4 and 0.8 .
(a) (b)
(b)
Increasing the low-mass cutoff in the mass function increases the effective stellar evolution mass-loss rate, and reduces the cluster lifetime. A similar effect can be achieved by increasing the power-law slope of the mass function. The models are therefore degenerate in the – plane. For example, a model with a Salpeter initial mass function () and a low-mass cutoff at 0.2 evolves almost identically to a model with and or with and .
4.3 Comparison with Kim et al. (2000)
Kim (2000) used GADGET, the tree code developed by Springel, Yoshida & White (2000), to compute the dynamical friction of dense star clusters near the Galactic center. In these calculations, the inner part of the Galaxy was represented by 2 million point particles distributed as a truncated softened power-law similar to our Eq. (2), except that the overall density was 2.5 times smaller than ours. The black hole in the Galactic center was represented as a single particle. The star cluster was modeled as a Plummer sphere with pc, using point particles having a total mass of . Initially, the cluster was placed in a circular orbit at a distance of pc from the Galactic center. The simulations ignored mass loss by stellar evolution and evaporation.
The time-dependence of the cluster’s Galactocentric distance, as determined by Kim (2000), is shown in Fig. 6. His cluster orbits become slightly eccentric during the evolution, but this seems to have little effect on the dynamical friction timescale. For clarity we do not show the actual results reported by Kim, but instead match his initial conditions, which are plotted in Fig. 6 as the rightmost dashed curve. This model is computed without stellar evolution or evaporation, as in Kim’s simulations. Our model closely reproduces Kim’s results when we adopt , which is close to the value used by Kim. For reference, we also plot the evolution of a constant point-mass model (dotted curve), and a model in which stellar evolution and evaporation are taken into account (solid curve). To guide the eye we also plot the same series of runs with .

5 Discussion
In this section we discuss some consequences of our semi-analytical calculations. In particular, we consider Gerhard’s (2002) conjecture, discussed in §1, that IRS 16 and the associated young stars observed in the Galactic center may have been deposited there by the inspiral and disruption of a much more massive system. We take the two known Galactic center clusters—the Arches and Quintuplet—as templates.
Table. 1 presents the observed parameters for the Arches and Quintuplet systems. The final columns give the clusters’ half-mass relaxation time and the time required to reach the Galactic center, according to Eq. (32). (The half mass relaxation time is computed by substituting for in that equation.) It is clear that neither cluster will reach the Galactic center within the next few megayears, and that both were probably born at roughly their present distance from the Galactic center. For these calculations we have again adopted .
| Name | ref. | Rgc | Age | M | Rhm | |||
|---|---|---|---|---|---|---|---|---|
| [pc] | [Myr] | [] | [pc] | — Myr — | [Gyr] | |||
| Arches | a | 30 | 2–4 | 12–50 | 0.2 | 12 | 60 | 0.3–1.9 |
| Quintuplet | b | 35 | 3–5 | 10–16 | 0.5 | 12 | 60 | 5.5–9.6 |
References: a) Figer et al. (1999a); b) Glass, Catchpole & Whitelock (1987); Nagata et al. (1990); Figer, Mclean & Morris (1999b).
(a)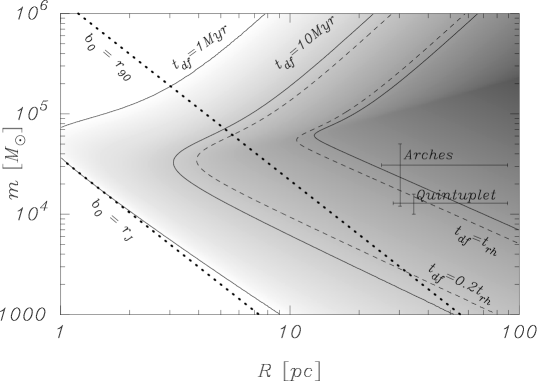 (b)
(b)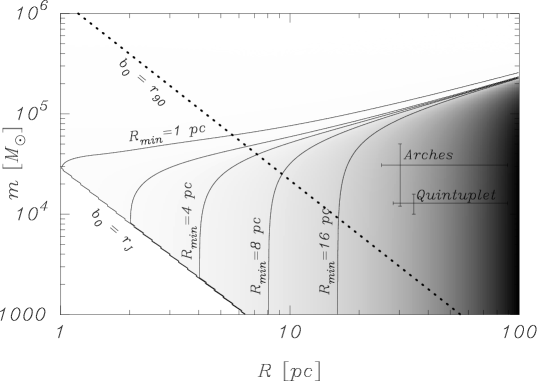
Fig. 7 presents, as a function of initial cluster mass and galactocentric radius, the time taken for a star cluster with pc to reach the Galactic center (a), and the distance from the Galactic center at which the cluster dissolves (b). Contours and greyscale represent inspiral time in (a) and dissolution distance in (b). The cluster is deemed to have dissolved when it comes within 1 pc of the Galactic center, or when it has lost 99% of its initial mass. The dotted lines have the same meanings is in Fig. 1.
The rightmost dashed line in Fig. 7 marks initial conditions for which the inspiral time scale equals the initial relaxation time. To the right of this curve, the cluster will experience significant internal dynamical evolution before disrupting. Our simple description of the cluster’s internal structure is therefore unreliable to the right of this curve, but our expression for the evaporation rate is still valid. The left dashed curve corresponds to an inspiral time scale of 0.2 , where is the initial relaxation time at the half-mass radius. This is roughly the core-collapse time for a system with a realistic initial mass function in which stellar evolution is relatively unimportant (see Portegies Zwart & McMillan 2002). Clusters with initial conditions to the left of the left dashed curve are thus expected to dissolve in the Galactic tidal field before experiencing core collapse.
During and after core collapse (to the right of the left dashed curve in Fig. 7a) the structure of the cluster changes considerably, and our simple prescription for cluster disruption is unlikely to hold. We expect that the structural changes in these clusters will cause their dense cores to survive for longer, and that they will sink slightly closer to the Galactic center than indicated in Fig. 7(b) (see Gerhard 2002 and Portegies Zwart et al 2003 for further discussion). The change in disruption radius is not expected to be great, however, as the residual core masses are small and their inspiral correspondingly slow at late times.
Fig. 7 clearly indicates that the two known nuclear star clusters, the Arches and Quintuplet, will not reach the Galactic center. Their survival times are determined by internal relaxation rather than by dynamical friction (see also Tab. 1). The inspiral time scale for these clusters is of the order of 1 Gyr, compared to their predicted lifetime of 100 Myr, based on N-body simulations (Portegies Zwart et al., 2001). Fig. 7(b) indicates that clusters with barely evolve in Galactocentric radius on this time scale, but instead dissolve in situ, due to the combined effects of evaporation and stellar mass loss.
(a)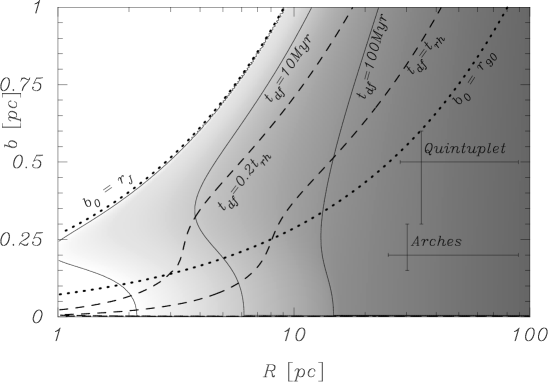 (b)
(b)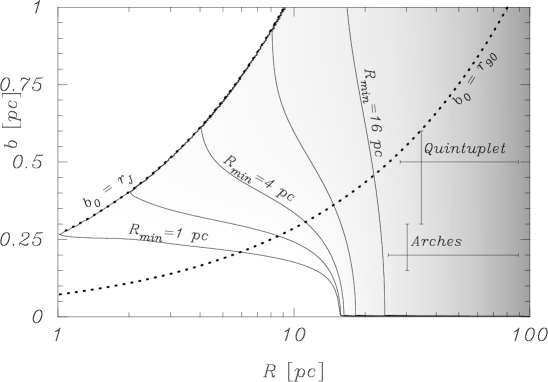
Fig. 8 gives the time taken for a star cluster with to reach the Galactic center and the Galactocentric distance at which the cluster dissolves. In Fig. 7 the initial cluster mass was varied at constant . Now we vary keeping constant, thereby providing a second slice through the same parameter space as in Fig. 7. As in Fig. 7, the approximate locations of the Arches and Quintuplet clusters are indicated. It is clear that small shifts in either figure will not alter the basic conclusion that both clusters will dissolve at large distances from the Galactic center.
From Figs. 7 and 8 it is clear that only massive ( ) star clusters can transport a significant fraction of their mass to the vicinity of the Galactic center within a few megayears. Also, even a million solar mass star cluster will require several tens of megayears to reach the Galactic center from an initial distance of pc. The most promising candidates to reach the central parsec of the Galaxy within 10 Myr, but after significant mass segregation has occurred, are star clusters with masses , born within about 20 pc of the Galactic center, with half mass radii of –0.4 pc. Less massive clusters, clusters farther from the Galactic center, or smaller (larger) clusters have greater difficulty reaching the Galactic center before disruption (core collapse).
We therefore conclude that, if they originated in a massive star cluster, the stars in IRS 16 were born in a cluster at a Galactocentric distance of pc. The cluster deposited about of material within pc of the Galactic center. Since such a cluster would have experienced core collapse on about the same time scale, the most massive stars had already segregated to the cluster core. The deposited (core) material was therefore rich in massive stars. These findings are contrary to the results reported by Kim et al. (2002).
More detailed studies are underway to qualify and quantify these statements (Portegies Zwart, McMillan & Gerhard 2003). Preliminary results indicate that the inspiral times derived here are in good agreement with N-body calculations using the GRAPE-6 special-purpose computer (Makino et al 2002), with the same description of dynamical friction as presented here. More sophisticated calibration of the dynamical friction parameters themselves, obtained by modeling the Galactic background as individual stars, will be the subject of a future paper.
References
- Alexander (1999) Alexander, T. 1999, ApJ, 527, 835
- Allen et al. (1990) Allen, D. A., Hyland, A. R., Hillier, D. J. 1990, MNRAS, 244, 706
- Eggleton et al. (1989) Eggleton, P. P., Tout, C. A., Fitchett, M. J. 1989, ApJ, 347, 998
- Figer et al. (1999a) Figer, D. F., Kim, S. S., Morris, M., Serabyn, E., Rich, R. M., McLean, I. S. 1999a, ApJ, 525, 750
- Figer et al. (1999b) Figer, D. F., McLean, I. S., Morris, M. 1999b, ApJ, 514, 202
- Genzel et al. (2000) Genzel, R., Pichon, C., Eckart, A., Gerhard, O. E., Ott, T. 2000, MNRAS, 317, 348
- (7) Gerhard, O. 2001, ApJ, 546, L39
- Ghez et al. (2000) Ghez, A. M., Morris, M., Becklin, E. E., Tanner, A., Kremenek, T. 2000, Nature, 407, 349
- Glass et al. (1987) Glass, I. S., Catchpole, R. M., Whitelock, P. A. 1987, MNRAS, 227, 373
- (10) Güsten, R. & Downes, D. 1980, A & A, 87, 6
- Kim (2000) Kim, S. S. 2000, American Astronomical Society Meeting, 197, 409
- Krabbe et al. (1995) Krabbe, A., Genzel, R., Eckart, A., Najarro, F., Lutz, D., Cameron, M., Kroker, H., Tacconi-Garman, L. E., Thatte, N., Weitzel, L., Drapatz, S., Geballe, T., Sternberg, A., Kudritzki, R. 1995, ApJ, 447, L95
- Langer et al. (1994) Langer, N., Hamann, W.-R., Lennon, M., Najarro, F., Pauldrach, A. W. A., Puls, J. 1994, A&A, 290, 819
- (14) McMillan, S.L.W. 2003, in proceedings of IAU Symposium 208, Astrophysical Supercomputing using Particle Simulations, J. Makino & P. Hut eds. (ASP: San Francisco) (astro-ph/0203045)
- Mezger et al. (1999) Mezger, P. G., Zylka, R., Philipp, S., Launhardt, R. 1999, A&A, 348, 457
- Nagata et al. (1995) Nagata, T., Woodward, C. E., Shure, M., Kobayashi, N. 1995, AJ, 109, 1676
- Nagata et al. (1990) Nagata, T., Woodward, C. E., Shure, M., Pipher, J. L., Okuda, H. 1990, ApJ, 351, 83
- Najarro et al. (1997) Najarro, F., Krabbe, A., Genzel, R., Lutz, D., Kudritzki, R. P., Hillier, D. J. 1997, A&A, 325, 700
- Okuda et al. (1990) Okuda, H., Shibai, H., Nakagawa, T., Matsuhara, H., Kobayashi, Y., Kaifu, N., Nagata, T., Gatley, I., Geballe, T. R. 1990, ApJ, 351, 89
- Plummer (1911) Plummer, H. C. 1911, MNRAS, 71, 460
- Portegies Zwart et al. (2001) Portegies Zwart, S. F., Makino, J., McMillan, S. L. W., Hut, P. 2001, ApJ, 546, L101
- Portegies Zwart et al. (2002) Portegies Zwart, S. F., Makino, J., McMillan, S. L. W., Hut, P. 2002, ApJ, 565, 265
- Portegies Zwart & McMillan (2002) Portegies Zwart, S. F., McMillan, S. L. W. 2002, ApJ, 576, 899
- (24) Portegies Zwart, S.F., McMillan, S.L.W. & Gerhard. O., 2003, ApJ in press
- Sanders & Lowinger (1972) Sanders, R. H., Lowinger, T. 1972, AJ, 77, 292
- (26) Spinnato, P., Fellhauer, M. & Portegies Zwart, S.F., 2003, submitted to MNRAS (astro-ph/0212494)
- Tamblyn & Rieke (1993) Tamblyn, P., Rieke, G. H. 1993, ApJ, 414, 573
Appendix A
The argument in the dynamical friction relation (Eq. 7) of Sec. 2.1 may be evaluated as follows for inspiral through a sequence of nearly circular orbits.
Following Binney & Tremaine (1987, Eq. 4-30), we write the equation of dynamical equilibrium (the radial Jeans equation) for stars near the Galactic center as
| (37) |
where we assume an isotropic velocity distribution. In the power-law region, (Eq. 1), we further assume that . It then follows that , so
| (38) |
Substitution in Eq. (37) then yields . We note that, as , this reduces to the correct expression for an isothermal sphere (see Binney & Tremaine, p. 230).