The First CO Map of a Low Surface Brightness Galaxy
Abstract
Using the Owens Valley Radio Observatory Millimeter-Wavelength Array (OVRO) we have obtained the first CO map of a low surface brightness (LSB) galaxy. The studied galaxy, UGC 01922, was chosen for these observations because both of its previous CO detection with the IRAM 30m telescope and its classification as a Malin 1 ‘cousin’ – an LSB galaxy with MHI 1010 M⊙. The OVRO map detected approximately 65% of the CO(10) flux found earlier with the single dish measurements, giving a detected gas mass equivalent to M⊙. The integrated gas peak lies at the center of the galaxy and coincides with both the optical and 1.4 GHz continuum emission peaks. The molecular gas extends well beyond the OVRO beam size (4′′ or 3 kpc), covering 25% of the optical bulge. In all, perhaps the most remarkable aspect of this map is its unexceptional appearance. Given that it took over ten years to successfully detect molecular gas in any low surface brightness system, it is surprising that the appearance and distribution of UGC 01922’s CO is similar to what would be expected for a high surface brightness galaxy in the same morphological class.
Subject headings:
galaxies : AGN – galaxies : individual : UGC 01922 – galaxies : molecular gas1. Introduction
Low surface brightness (LSB) galaxies are typically defined as those galaxies with observed central surface brightnesses of 23.0 mag arcsec-2. Their global properties show LSB systems to be under-evolved when compared to their high surface brightness (HSB) counterparts, having high H I gas mass-to-luminosity ratios, blue colors, and typically low metallicities (Z 0.3 Z⊙) (de Blok, van der Hulst, & Bothun, 1995; McGaugh, 1994; O’Neil, Hofner, & Schinnerer, 2000; O’Neil, Bothun, & Cornell, 1997; O’Neil, et al., 1997). It is likely that the slow stellar evolution in these galaxies is due, at least in part, to the extreme environments within most LSB galaxies, such as gas densities typically below the Toomre criteria for star formation (O’Neil, Verheijen, & McGaugh, 2000; de Blok, McGaugh, & van der Hulst, 1996) and extremely high dark matter content even in the galaxies’ inner radii (de Blok, McGaugh, & Ruben, 2001).
After ten years of searching, molecular gas (in its CO emission) has finally been detected in LSB galaxies (O’Neil, Schinnerer, & Hofner, 2003; O’Neil, Hofner, & Schinnerer, 2000). Taking advantage of these discoveries, we have used the Owens Valley Radio Observatory Millimeter Array (OVRO) to obtain the first CO map of an LSB system. To date, it is only the massive LSB galaxies which have had CO detections (O’Neil, Schinnerer, & Hofner, 2003). As a result, the observed galaxy, UGC 01922, was chosen both because of its previous CO detection with the IRAM 30m telescope and because it lies within the class of massive LSB galaxies similar to the prototypical massive LSB galaxy Malin 1. This paper contains both a description of the OVRO data as well as a discussion as to the implications of our findings.
A Hubble constant of 70 km s-1 Mpc-1 was assumed throughout this paper. Additionally, a heliocentric velocity of 10,894 km s-1 was assumed for UGC 01922, equating to a distance of 156 Mpc and a scale of 0.75 kpc/′′ (assuming an infall velocity to the Virgo cluster of 300 km s-1).
2. Observations
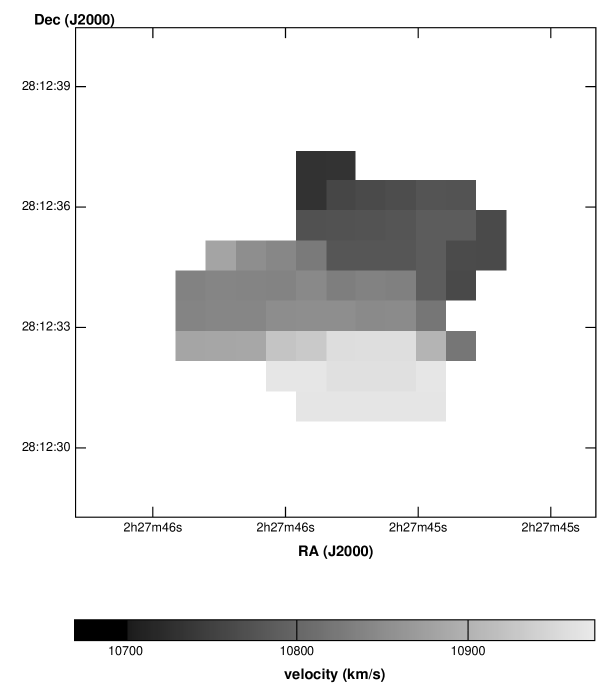
UGC 01922 was observed in its CO(10) line in 2002 March and April using the six-element Owens Valley Radio Observatory (OVRO) millimeter interferometer in its E and C configurations. The resulting baselines range from 20m to 120m providing a spatial resolution of 4.5′′ 3.3′′ (PA 88∘) using natural weighting within the primary beam of 65′′ at the observed frequency. The quasars 3C84, 3C111, and 3C345 served as passband calibrators and J0237+288 was observed every 20 minutes for phase calibration. The average single sideband temperature was around 400 K at the observed line frequency of 111.23 GHz. The resulting noise per 30 km s-1 channel is 4 mJy beam-1 in the combined data of 3 tracks. The data were calibrated, mapped, and analyzed using the software packages MMA (Scoville et al., 1993), MIRIAD (Sault, Teuben, & Wright, 1995), and GIPSY (van der Hulst, et al., 1992), respectively. The intensity and iso-velocity maps contain all emission above the clipping level in the velocity interval between 255 km s-1 and +165 km s-1 relative to the observed line velocity of vLSR=10896 km s-1 (Figure 1 & Figure 2).
| ….02:27:46.011 | ….28:12:30.31 |
|---|---|
| -19.83 | 6.6 |
| 2.9 | |
| 184 | 594 |
| 108852 |
References. — 1O’Neil, Schinnerer, & Hofner (2003); 2Giovanelli & Haynes (1985); 3NASA Extragalactic Database; 4Obtained from fitting isophotes to the Digital Sky Survey image of UGC 01922; 5Nilson (1973); 6Infrared Science Archive (IRSA) Two Micron All Sky Survey (2MASS) data; 7Condon, et al. (1998).
3. Known Properties of UGC 01922
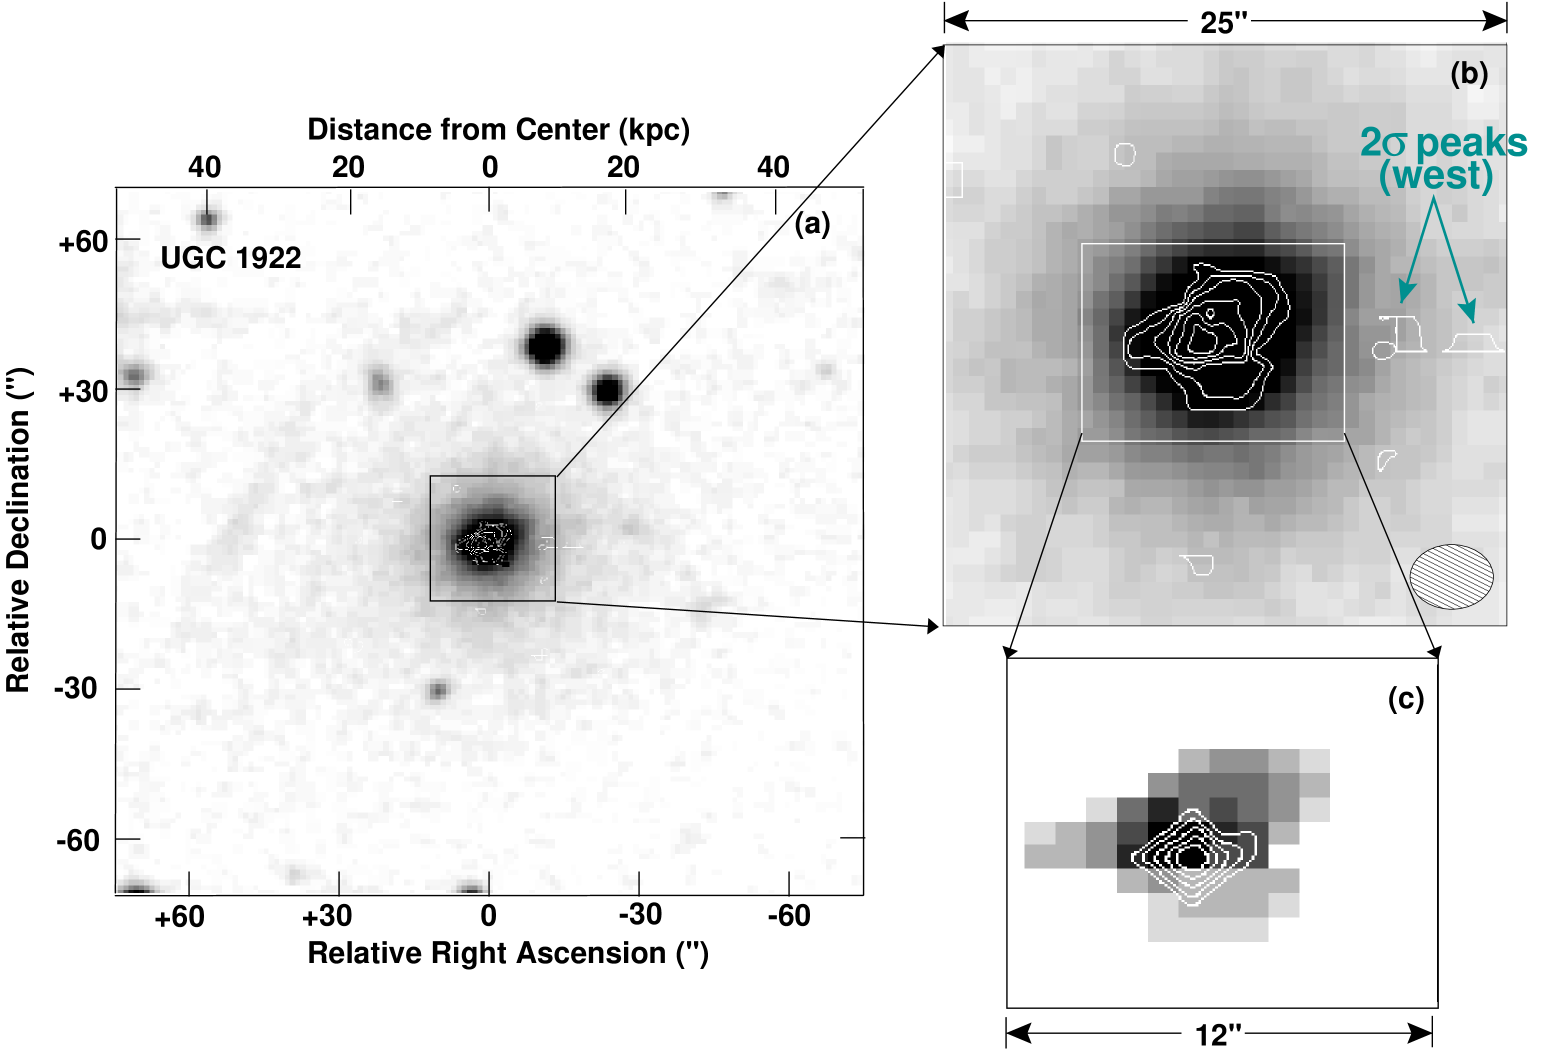
Classified as an Sb-Sd galaxy (Giovanelli & Haynes, 1985), UGC 01922 consists of a bright central core (bulge) surrounded by a very faint LSB disk (Figure 1). From the Digitized Palomar Sky Survey II (DPOSS-II)111The Digitized Sky Surveys were produced at the Space Telescope Science Institute under U.S. Government grant NAG W-2166. The images of these surveys are based on photographic data obtained using the Oschin Schmidt Telescope on Palomar Mountain and the UK Schmidt Telescope. The plates were processed into the present compressed digital form with the permission of these institutions. image of UGC 01922, we find the bulge effective radius to be approximately 19 kpc (25′′), while the LSB disk extends at least to a radius of 60 kpc (80′′) and it may extend considerably farther. (The DPOSS-II images lack the surface brightness sensitivity to determine the full extent of the galaxy’s LSB disk.) In contrast with the common belief that LSB galaxies are pure disk systems, LSB galaxies like UGC 01922 with H I masses in the range M⊙ are often found to have prominent bulges (Kenezk, 1999). In fact, the overall appearance of UGC 01922 is remarkably reminiscent of the morphology of Malin I, the archetypal massive LSB system (Impey & Bothun, 1989). The previously measured properties of UGC 01922 are summarized in Table 2 and a comparison between UGC 01922’s properties and that of other galaxies is given in Table 3.
In addition to having a strong presence in the optical images of UGC 01922, the galaxy’s central bulge shows up both as an extended source in all bands of the 2MASS222The Two Micron All Sky Survey (2MASS) is a joint project of the University of Massachusetts and the Infrared Processing and Analysis Center/California Institute of Technology, funded by the National Aeronautics and Space Administration and the National Science Foundation. survey data and as a strong 1400 MHz continuum emitter in the NRAO VLA Sky Survey (NVSS) (Condon, et al., 1998). The 2MASS data show emission in the central 49′′ (37 kpc), roughly the same size as the central bulge as defined by the DPOSS-II image, with colors of , and = 11.600.02 (similar to the colors found in the inner regions of most HSB disk galaxies – Hunt, et al. 1997). No 2MASS emission is seen outside the galaxy’s optically defined bulge. Similarly, the NVSS emission extends across the size of the optical bulge, having a deconvolved diameter (from the NVSS catalog) of 40′′ (30 kpc) and a total flux of 36.5 mJy. Both the 2MASS and NVSS catalogs list a position angle of the emission as 68∘ (W of N).
Recent optical spectra taken across the nucleus of UGC 01922 show N II/H 1, with accompanying strong S II [ 6717,6731] lines and a visible O I [ 6300], all of which are indicators of AGN or LINER emission within a galaxy. (The optical spectra is shown in Figures 3 & 4 of O’Neil, Schinnerer, & Hofner 2003.) This is not exceptionally surprising. Schombert (1998) found that approximately 50% of the massive LSB systems he studied have AGN/LINER nuclei, while Impey, Burkholder, & Sprayberry (2001) found 20% of the massive LSB galaxies in their study have LINER/AGN characteristics. It is interesting to note that the underlying shape of UGC 01922’s optical spectra contains a strong ’bump’ at 4700Å similar to the Fe III bump found in late-type Type Ia supernovae (Ruiz-Lapuente, et al., 1995; Mazzali, et al., 1998). This spectral shape is likely the result of the supernova SN1989S which exploded within the galaxy more than 10 years ago (Mueller, Gunn, & Oke, 1989), and should not have any effect on the measurement of the relevant galaxy emission lines.
In all, UGC 01922 appears to be a fairly ‘typical’ massive LSB galaxy with AGN/LINER characteristics and a bulge which is similar to those found in many HSB spiral galaxies.
4. Molecular Gas in UGC 01922
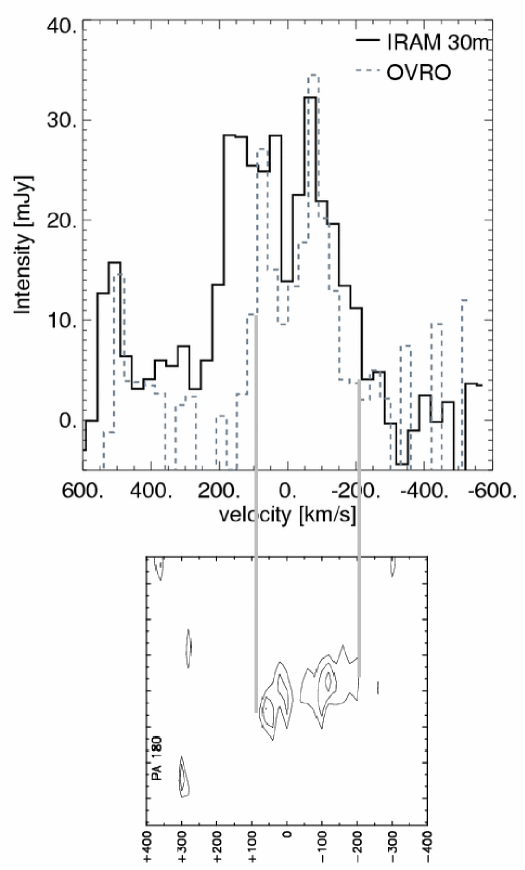
Figure 1 shows the integrated CO(10) emission for our OVRO observations. The rms noise of the (summed) intensity map is 0.39 Jy/beam km s-1, while the peak of the CO emission lies at the 2.94 Jy/beam km s-1 level, making our observations a clean 7 detection. The total flux detected in the central 30′′ of the map is 3.6 Jy km s-1, or approximately 55% of the total flux as found with the IRAM 30m telescope (6.6 Jy km s-1 – O’Neil, Schinnerer, & Hofner 2003). Including the tentative 2 peak seen at the western edge of the map adds an additional 0.8 Jy km s-1, bringing the total flux seen with the OVRO map to 65% of the IRAM flux. As can be seen in Figure 3, the majority of the unrecovered flux appears to lie in the wings of the line profile, and so it is likely to have too low signal-to-noise to be reliably detected in the OVRO data. The detected mass is equivalent to M⊙, assuming a standard CO-to-H2 conversion factor of N(H2)/=3.61020 cm-2 (K km s-1)-1. The central surface density, measured with one beam, is 6.31021 cm-2, or 50 M⊙ pc-2 using the same CO-to-H2 conversion factor.
Examining Figure 1 more closely we can see that all the detected CO emission in UGC 01922 is contained within the galaxy’s bright central bulge, with the CO radius being approximately 25% the bulge effective radius. Figure 1 also shows the integrated CO emission to be centered on the optical center of the galaxy, and coincident with both the 1400MHz continuum emission found by the NVSS and the 2MASS near-IR emission. Looking at a position-velocity diagram along the kinematic major axis of the CO gas shows a spatial offset between the integrated peak emission of the red and blue channels of 2 – 3′′ (1.5 – 2.3 kpc – Figure 3), indicating the CO gas lies in a ring around the galaxy’s core. As we do not have the resolution available at the other wavelengths (1400 MHz, H I, etc.), we cannot say whether this ring-like distribution is unique to the CO distribution or if it is also present at other wavelengths.
The largest velocity gradient of the CO emission is along the north-south axis which is not along the apparent elongation of the CO emission (Figure 2). The uncorrected rotational velocity is 100 km s-1, assuming the rotational velocity is equal to half the difference between the maximum and minimum velocities (Figure 2). Assuming an inclination of 40∘ (Nilson, 1973), at a radius of 1.5 kpc (the edge of the centralized molecular gas in the OVRO map) this gives an enclosed dynamical mass of 8.4109M⊙. Using the above numbers, the detected molecular gas mass-to-dynamical mass ratio for UGC 01922 is 0.13 for the central 3 kpc, a value similar to that typically found in HSB systems (e.g. Sakamoto, et al. (1999) found = 0.1 for the inner 1 kpc of 20 CO-luminous nearby spiral galaxies).
5. Discussion
CO is often considered to be a reliable tracer of the molecular gas within a galaxy. As molecular gas and molecular cloud complexes are directly associated with star formation within galaxies, CO can also be considered a tracer of a galaxy’s star formation potential. Consequently, our understanding of the star formation processes within LSB galaxies can be considerably increased by knowing the general distribution of CO gas within these systems.
The properties of UGC 01922’s central bulge, including the strong near-IR and radio continuum emission and the characteristic AGN/LINER spectra, indicate that unlike the disks of most LSB galaxies, the density of baryons within the central few kpc of UGC 01922 must be quite high. This is in contrast with both the LSB disk of UGC 01922 and the gas density of most LSB galaxies, which is often below the Toomre cut-off for star formation () (O’Neil, Verheijen, & McGaugh, 2000; de Blok & van der Hulst, 1998; Pickering, et al., 1997; van Zee, et al., 1997).
O’Neil, Schinnerer, & Hofner (2003) compared all single dish observations of LSB galaxies with the CO and H2 properties of a representative HSB galaxy sample. They conclude that it is primarily the low baryonic density inherent in LSB disks which inhibits high CO production. Consequently, CO will only readily be found in LSB galaxies which contain regions of high baryonic density. UGC 01922, with its low density LSB disk surrounding a bright, high density nucleus, is an excellent test case for the theory laid out in O’Neil, Schinnerer, & Hofner (2003). In agreement with their theory, the only CO seen within UGC 01922 is in the higher density bulge, with no CO seen in the galaxy’s low density disk. The two exceptions to this idea – Malin 1 and UGC 06968 – are massive LSB galaxies with properties similar to those of UGC 01922, yet which do not have CO detections to fairly low limits. In both of these cases it is likely that the gas and dust is quite cold, which would lower the galaxies’ CO-to-M conversion factor. A detailed discussion of this is given in O’Neil, Schinnerer, & Hofner (2003).
As mentioned in the last section, the maximum observed velocity reached by the CO gas is about 200 km s-1. A spatial offset of approximately 2 kpc is found between the red and blue sides. An offset of this size is seen for circumnuclear star forming rings within galaxies (i.e. Regan, Sheth, & Vogel 1999; Planesas, Colina, & Pérez-Olea 1997). Combes (1991) shows that circumnuclear star forming rings are expected to form as a result of the increased gas density associated with stellar bars. The ring might host H II regions (regions of active star formation) which can change the radiation field and metallicity of the area, resulting in our CO emission detection. However, no evidence of a large-scale bar can be found in UGC 01922, in either the DPOSS-II image (Figure 1) or a recently obtained R-band image using the Lowell observatory’s 1.8m telescope (O’Neil, Oey, & Bothun, in prep.).
Within the HSB galaxy realm, a difference in the distribution of molecular gas with galaxy type is often seen (e.g. Casoli, et al. 1998). In particular, the earlier-type disk galaxies typically have molecular gas concentrations in their central bulge while the molecular gas of the later-type galaxies is often spread throughout the galaxies’ disks. If one assumes that previous non-detections of molecular gas in LSB galaxies which do not contain any central bulge are due to the gas being both low in column density and distributed throughout the disk, it seems likely that LSB galaxies have a similar CO distribution/morphology trend as the HSB galaxies. The difference is simply in the density and possibly the total amount of molecular gas, with less gas being detected within the environment of low surface brightness galaxies (O’Neil, Schinnerer, & Hofner, 2003). As a result, it seems as if the CO now being detected within LSB galaxies has the distribution and appearance which would be expected for any galaxy, LSB or HSB, of its morphological type.
References
- de Blok, McGaugh, & Ruben (2001) de Blok, W.J.G., McGaugh, S., & Ruben, V. 2001 AJ 122, 2381
- de Blok & van der Hulst (1998) de Blok, W.J.G. & van der Hulst, J.M. 1998 A&A 336 49
- de Blok, McGaugh, & van der Hulst (1996) de Blok, W.J.G., McGaugh, S., & van der Hulst, J.M. 1996 MNRAS 283, 18
- de Blok, van der Hulst, & Bothun (1995) de Blok, W.J.G., van der Hulst, J.M., & Bothun, G.D. 1995 MNRAS 274, 235
- Bothun, et al. (1990) Bothun, G.D., Schombert, J., Impey, C. & Schneider, S. 1990 ApJ 360, 427
- Broeils (1992) Broeils, A. 1992 Ph.D. thesis (Rijksuniversiteit: Groningen)
- Combes (1991) Combes, F. 1991 Dynamics of Galaxies and Their Molecular Cloud Distribution, ed. F. Combes & F. Casoli, p. 225, Kluwer
- Casoli, et al. (1998) Casoli, F., et.al 1998 A&A 331, 451
- Condon, et al. (1998) Condon J. J., Cotton, W. D., Greisen, E. W., Yin, Q. F., Perley, R. A., Taylor, G. B., & Broderick, J. 1998, AJ, 115, 1693
- Giovanelli & Haynes (1985) Giovanelli, R. & Haynes, M. 1985 AJ 90, 2445
- Hunt, et al. (1997) Hunt, L. K., Malkan, M. A., Salvati, M., Palazzi, E., Mandolesi, N., & Wade, R. 1997 ApJS 108, 229
- Impey, Burkholder, & Sprayberry (2001) Impey, C., Burkholder, V., & Sprayberry, D. 2001 AJ 122, 2341
- Impey & Bothun (1989) Impey, C., & Bothun, G. 1989 ApJ 341, 89
- Kenezk (1999) Knezek, P. 1999 in The Low Surface Brightness Universe, IAU Colloquium 171 J.I. Davies, C. Impey, & S. Phillipps, eds. (PASP:San Francisco)
- Mazzali, et al. (1998) Mazzali, P. A., Cappellaro, E., Danziger, I. J., Turatto, M., & Benetti, S. 1998 ApJ 499, 49
- McGaugh (1994) McGaugh, S. 1994 ApJ 426, 135
- Mueller, Gunn, & Oke (1989) Mueller J., Gunn J., & Oke, J. 1989 IAU Circulars 4888, 1
- Nilson (1973) Nilson, P. 1973 Uppsala General Catalogue of Galaxies (Uppsala: Astronomiska Observatorium)
- O’Neil, Schinnerer, & Hofner (2003) O’Neil, K., Schinnerer, E., & Hofner, P. 2003, ApJ, accepted
- O’Neil, Verheijen, & McGaugh (2000) O’Neil, K., Verheijen, M., & McGaugh, S. 2000 AJ 119, 2194
- O’Neil, Hofner, & Schinnerer (2000) O’Neil, K., Hofner, P., & Schinnerer, E. 2000 ApJ 545, L99
- O’Neil, et al. (1997) O’Neil, K., Bothun, G.D., Schombert, J., Cornell, M., & Impey, C. 1997 AJ 114, 2448
- O’Neil, Bothun, & Cornell (1997) O’Neil, K., Bothun, G.D., & Cornell, M. 1997 AJ 113, 1212
- Pickering, et al. (1997) Pickering, T. E.; Impey, C. D.; van Gorkom, J. H.; Bothun, G. D. 1997 AJ 114, 1858
- Planesas, Colina, & Pérez-Olea (1997) Planesas, P., Colina, L., & Pérez-Olea, D. 1997 A&A 325, 81
- Regan, Sheth, & Vogel (1999) Regan, M., Sheth, K., & Vogel, S. 1999 ApJ 526, 97
- Ruiz-Lapuente, et al. (1995) Ruiz-Lapuente, P., Kirshner, R. P., Phillips, M. M., Challis, P. M., Schmidt, B. P., Filippenko, A. V., & Wheeler, J. C. 1995 ApJ 439, 60
- Sakamoto, et al. (1999) Sakamoto, K., Okumura, S., Ishizuki, S., & Scoville, N. 1999 ApJ 525, 691
- Sault, Teuben, & Wright (1995) Sault, R.J., Teuben, P. J., & Wright, M. C. H. 1995 Astronomical Data Analysis Software and Systems, Volume IV (PASP:San Francisco)
- Schombert (1998) Schombert, J. 1998 AJ 116, 1650
- Scoville et al. (1993) Scoville, N., et. al 1993 PASP 105, 1482
- van der Hulst, et al. (1992) van der Hulst J. M., Terlou, J. P., Begeman, K. G., Zwitser, W., & Roelfsema, P. R. 1992 Astronomical Data Analysis Software and Systems, Volume I (PASP:San Francisco)
- van Zee, et al. (1997) van Zee, L., Haynes, M., Salzer, J., Broeils, A. 1997 AJ 113, 1618