X-rays from Clusters of Galaxies
Abstract
The X-ray emission from clusters of galaxies enables them to be used as good cosmological probes and as an example for massive galaxy formation. The gas mass fraction in clusters should be a universal standard which by means of Chandra observations enables to be determined to better than 15 per cent accuracy. Future observations of its apparent variation with redshift will enable to be measured. The interplay of radiative cooling and heating in cluster cores may reveal the dominant processes acting during the formation of the baryonic part of massive galaxies.
1 Introduction
Clusters of galaxies are luminous X-ray sources, with X-ray luminosities ranging from . The emission is predominantly thermal bremsstrahlung from hydrogen and helium in the intracluster medium. Line emission, particularly from iron, is also present showing that most of the gas has a mean metallicity of about 0.3 Solar. The total mass of the intracluster medium is about one tenth of the total cluster mass, and about 6 times that of all the stars in the member galaxies. Most of the mass of a cluster is due to dark matter.
Clusters are the most massive bound objects in the Universe and therefore make good cosmological probes. They are the extreme tail of the mass distribution. The number density of clusters in a given mass range is a sensitive measure of the amplitude of the cosmic power spectrum on cluster scales, . The gas fraction in clusters, , enables the matter density parameter, , to be determined and is a standard measure which should be invariant with redshift. This means that it has a strong potential to be a valuable, independent diagnostic of dark energy, .
The X-ray emission in the cores of many clusters is sharply peaked. The radiative cooling time of the gas within 50 kpc of the centre is shorter than the likely age of the cluster. The temperature drops smoothly there by a factor of two to three from that of the outer gas. Although it might seem that a cooling flow should be operating there with gas cooling out of the intracluster medium, spectra from the new generation of X-ray space observatories show that radiative cooling is much reduced and some form of distributed heating is taking place.
This last point is of considerable importance for understanding the gaseous part of galaxy formation, most of which proceeds by radiative cooling of hot gas in dark matter potential wells. The cooling in galaxies predominately occurs in the extreme and far UV and so is not readily observable, but is directly observable in clusters. Whatever is stemming the cooling in clusters may be determining the upper mass cutoff for galaxies.
We review these properties of clusters here with an emphasis on our own recent results.
2 Cosmological parameters from clusters
\psfigfigure=montage_press_release.ps,width=0.99 angle=0
The equation of hydrostatic equilibrium , where and are the particle density, temperature, pressure, mass density and local gravitational acceleration (), can be rewritten as
| (1) |
The quantities on the right can be measured from X-ray spectral images yielding the gas mass profile , the total mass profile and the gas fraction . Where possible, can be checked against gravitational lensing data (Fig. 1). is then determined using the baryon mass density by [50]
| (2) |
\psfigfigure=swallen_fig1a.ps,width=0.46angle=270 \psfigfigure=swallen_fig1b.ps,width=0.46 angle=270
A good example is shown by our analysis of the Chandra data on the most luminous cluster known RXJ1347-1145 [6]. The X-ray emission is sharply peaked on the dominant cluster galaxy. Excluding one quadrant which is hotter due to a merging subcluster, we find that the X-ray surface brightness and deprojected temperature profiles are well fit by a hydrostatic model assuming a Navarro-Frenk-White [31] mass profile (Fig. 2). This also agrees with the redshifts of the strong lensing arcs and with weak lensing results. Repeating this for several other massive relaxed clusters shows that the mass profiles are reliably obtained from the X-ray data.
We have measured for 9 massive, relaxed clusters out to the radius where the mean enclosed density is 2500 times the critical mass density of the Universe at the cluster redshift (Fig. 3; [5]). This leads to
| (3) |
where the numerator involves the determination of from deuterium abundance measurements in quasar intergalactic absorption spectra [33] and the Hubble constant [24]. The second small factor in the denominator accounts for the baryons in stars.
\psfigfigure=fgas_r2500.ps,width=0.47 angle=270 \psfigfigure=fgas_z.ps,width=0.49 angle=270
Numerical simulations of clusters show that should be independent of redshift. A small amount of gas may be lost during the assembly of a cluster (remaining fraction ; [8]) but should basically be a universal ‘standard measure’. We can therefore use this fact to determine the correct cosmological model [42, 34], i.e. adjust the cosmological parameters until we find to be independent of redshift. We find a best fit with , The method essentially involves the determination of the angular diameter distance of the cluster ().
The constraints on are competitive with all other methods. Those on show the potential for now. With another 10 clusters probing the redshift range 0.3–0.8, measurements promise to exceed the precision for obtained so far by distant supernovae. The importance of clusters is that they complement supernovae and sample the redshift range over which is most effective.
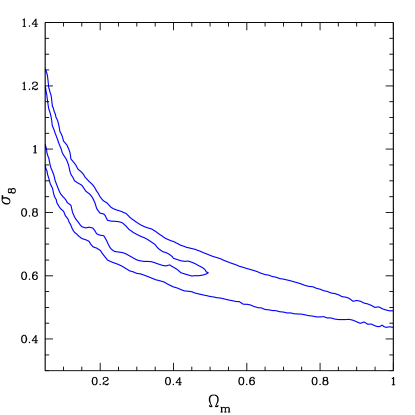
We have also determined the mass–luminosity relation from 17 massive clusters from Chandra observations and weak lensing measurements. In detail the relation is of and (0.1–2.4 keV), the latter quantity matching the ROSAT band for which there are now excellent X-ray luminosity functions from the ROSAT All Sky Survey (the eBCS and REFLEX studies). We then use the combined luminosity function for the 120 clusters with (0.1–2.4) to obtain the cluster mass function. This is then compared with the predicted mass function from the Hubble Volume simulations [18] to yield , the rms variation of the present day, linearly evolved, density field, smoothed by a top-hat window function of size .
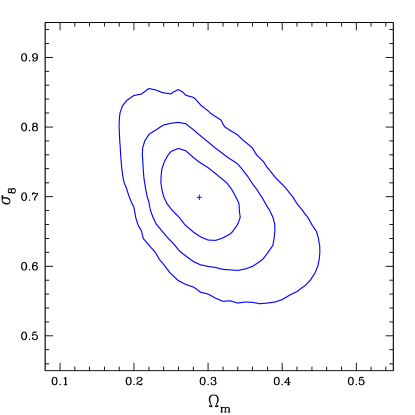
The resulting constraint on is a function of (Fig. 4). If we now include the data the degeneracy between and is broken and we obtain [7].
Other important and complementary X-ray cluster work on is by Schuecker et al [44] who have also measured the cosmic power spectral shape from the distribution of the REFLEX clusters on the sky, and by Borgani et al [12] who studied the evolution of the cluster luminosity function.
3 Cluster cores
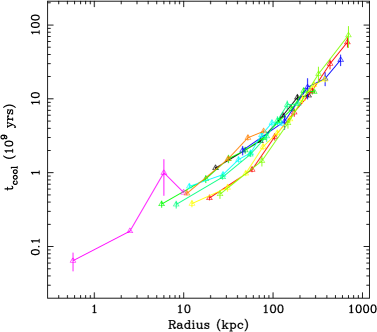
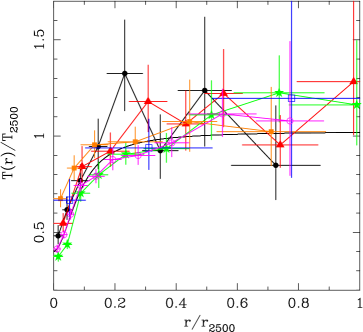
The radiative cooling time within the inner 100 kpc of most cluster cores is less than . The gas temperature also drops there by a factor of two to three (Fig. 5). If there is no heating of the gas it should cool out at a rate given by (see [19] for a review)
| (4) |
As the gas cools below 1 keV it emits strong Fe L line emission (e.g. FeXV emission at 15 and 19 A). A major result from the Reflection Grating Spectrometer (RGS) on XMM-Newton was to show that little such emission is seen ([35, 36, 46] Fig. 6). These studies show that the mass cooling rate below about one half to one third of the bulk cluster temperature is less than one fifth to one tenth of that deduced from the above simple formula. Chandra data are also in agreement with this result.
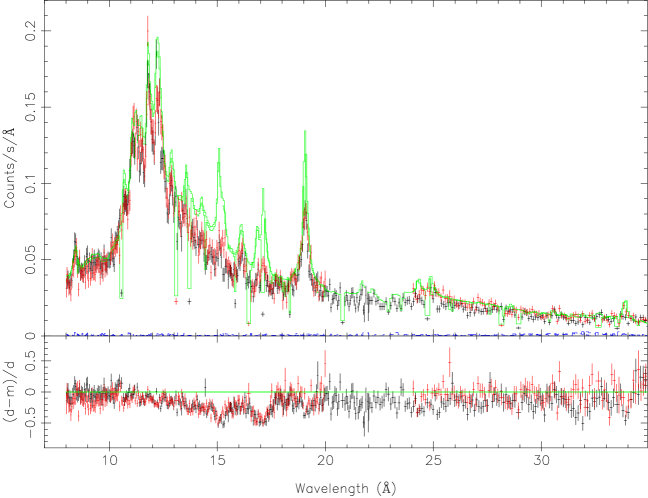
This result was present in previous ASCA and ROSAT studies [2] but the lack of emission had been attributed to intrinsic absorption. Although some absorption has not been completely ruled out, the improved new spectra show that it is not dominant.
It is most likely that some heating is taking place, for which there are two plausible candidates. These are heating by a central active nucleus and heating by conduction from the hot outer gas.
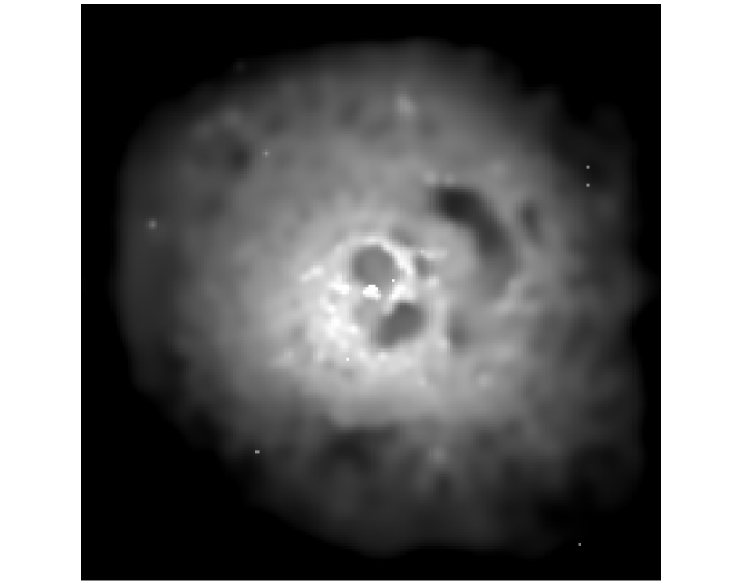
All of the relevant cooling flow clusters peak on a central galaxy which is expected to host a massive black hole. Many of these galaxies have radio sources, some of which are obviously blowing bubbles of relativistic plasma in the central regions (Perseus, [20], Fig. 7; A2052, [10]).The energy flux from the radio source can be high (). The difficulties are however that the X-ray coldest observed gas lies around the bubbles, not all clusters host powerful enough radio sources and that the mechanism for heat transfer from bubbles to the surrounding gas are unclear, despite several impressive computational studies (e.g. [13, 38, 37]).
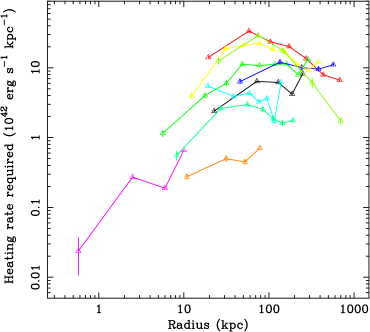
The heat must be distributed ([21, 26] Fig. 8) and cannot just heat the innermost, coolest gas (Fig. 8; [26]). Some [9, 45] have argued that radio source activity may be sporadic, which explains why there is little correlation between the present radio source activity and the heating requirement. However that makes very strong demands on the power of the source when it is switched on, particularly in the high luminosity clusters (Fig. 9). There it must exceed which will hardly be contained in simple bubbles.

Note that strong abundance gradients are found in many clusters ([25, 16]), often peaking at radii ([41] Fig. 10; [26]), limiting the degree of large scale disturbance which can take place in the central regions.
\psfigfigure=centaurus_LR.eps,width=0.46angle=0 \psfigfigure=cent_fr.ps,width=0.46rheight=0.55angle=0
Thermal conduction has long been considered to be suppressed in clusters because of the observed central temperature drops. Conductive energy flow increases strongly with temperature, unlike radiative cooling which decreases (at constant pressure), so one might assume that it either operates, so making the core isothermal, or is suppressed and radiative cooling dominates. Narayan & Medvedev [30] have however revived the concept and noted that conduction may account for the observed temperature gradients. This has been explored in more detail by [48, 23, Fig. 11] and [51]. These last authors found some clusters where conduction appears to be insufficient. A major issue here is whether the effective conductivity can be as high as the Spitzer value, or whether magnetic fields suppress it heavily (Narayan & Medvedev [30] argue that it may operate at close to the Spitzer rate). Faraday rotation indicates the presence of magnetic fields in the intracluster medium ([47] Fig. 10).
Ruszkowski & Begelman [39] have incorporated both distributed heating by a radio source with conduction to obtain stable solutions. This still leaves the method by which the heat is distributed as unsolved.
It is unlikely that either radio source heating or conduction can suppress radiative cooling within such a large region completely. Indeed, this is unnecessary, for significant rates of massive star formation [1, 15] and masses of cold gas [17] are found in the central parts. It is probable that
| (5) |
where is the cooling rate derived simply from the X-ray data on the assumption of no heating.
In summary there are plausible heat sources at the centre and beyond radii of 100 kpc. The main problem is to distribute the energy within 100 kpc without either disrupting the metallicity profiles or exceeding some observational constraint. Beyond any bubbles and plumes, and an occasional cold front (all of which occupy only a small fraction of the volume of the cooler gas) the distribution of surface brightness, temperature, metallicity and entropy of the gas all vary very smoothly.
Further possibilities remain in which cooling dominates but the situation is more complicated so that gas cooling below say 2 keV less observable. This can result if the metals are not uniformly mixed in the hot gas [21, 29] or if the cooler gas mixes with cold gas [22]. The missing soft X-ray luminosity from a simple cooling flow is similar to that in the optical/UV/IR nebulosity at the centre. One reason to continue to consider such models is the detection of strong OVI emission in some clusters [32].
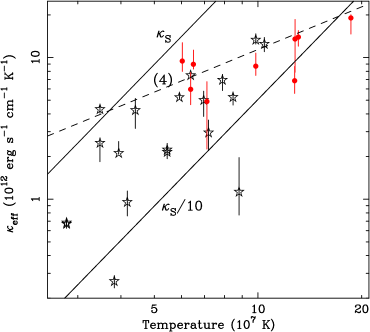

The cooling flow problem, as it has become known, has wider relevance than just to cluster cores. The visible parts of galaxies are due to gas cooling in dark matter potential wells [49, 28] and the cores of clusters are a directly observable example of this process. If it does not operate in cluster cores why does it work in galaxies? It is possible that whatever is stemming cooling in clusters does so in galaxies but operates in such a way as to dominate only in massive systems, so determining the upper mass limit of visible galaxies. A process like conduction, which is more effective in hotter, massive objects, has the right property to allow gas to cool in normal galaxies but not in more massive systems ([23] Fig. 11).
Although cluster cores are complex regions the superb spatial resolution of Chandra means that it can be separated from the bulk of the cluster and need not affect the cosmological determinations outlined earlier.
4 Acknowledgements
We thank Robert Schmidt and Jeremy Sanders for help and collaboration with these projects.
References
- [1] Allen S.W., 1995, MNRAS, 276, 947
- [2] Allen S.W., Fabian A.C., Johnstone R.M., Arnaud K.A., Nulsen P.E.J., 2001, MNRAS, 322, 589
- [3] Allen, S.W., Ettori S., Fabian, A.C. 2001, MNRAS, 324, 877
- [4] Allen, S.W., Schmidt, R.W., Fabian, A.C. 2001, MNRAS, 328, L37
- [5] Allen, S.W., Schmidt, R.W., Fabian, A.C. 2002a, MNRAS, 334, L11
- [6] Allen, S.W., Schmidt, R.W., Fabian, A.C. 2002b, MNRAS, 335, 256
- [7] Allen, S.W., Schmidt, R.W., Fabian, A.C., Ebeling H., 2002c, MNRAS, submitted (astro-ph/0208394)
- [8] Bialek J.J., Evrard A.E., Mohr J.J., 2002, 578, L9
- [9] Binney J., Tabor G., 1995, MNRAS, 276, 663
- [10] Blanton E.L., Sarazin C.L., McNamara B.R., Wise M.W., 2001, ApJ,
- [11] Böhringer H., Matsushita K., Churazov E., Ikebe Y., Chen Y., 2002, A&A, 382, 804
- [12] Borgani S. et al., 2001, ApJ, 561, 13
- [13] Brüggen M., Kaiser C.R., 2002, Nature, 418, 301
- [14] Churazov E., Brüggen M., Kaiser C.R., Böhringer H., Forman W., 2001, ApJ, 554, 261
- [15] Crawford C.S., Allen S.W., Ebeling H., Edge A.C., Fabian A.C., 1999, MNRAS, 306, 875
- [16] De Grandi S., Molendi S., 2001, ApJ, 551, 153
- [17] Edge A. C., 2001, MNRAS, 328, 762
- [18] Evrard A.E. et al., 2002, ApJ, 573, 7
- [19] Fabian A.C., 1994, ARAA, 32, 277
- [20] Fabian A. C. et al., 2000, MNRAS, 318, L65
- [21] Fabian A.C., Mushotzky R.F., Nulsen P.E.J., Peterson J., 2001, MNRAS, 321, L20
- [22] Fabian A.C., Allen, S.W., Crawford, C.S., Johnstone R.M., Morris, R.G., Sanders J.S., Schmidt R.W., 2002, MNRAS, 332, L50
- [23] Fabian A.C., Voigt L., Morris R.G., 2002, MNRAS, 335, L71
- [24] Freedman W. et al., 2001, ApJ, 553, 47
- [25] Fukazawa Y. et al., 1994, PASJ, 46, L55 224, 75
- [26] Johnstone R. M., Allen S.W., Fabian A. C., Sanders J.S., 2002, MNRAS, 336, 299
- [27] Freedman W. et al., 2001, ApJ, 553, 47
- [28] Kauffmann G., Colberg J.M., Diaferio A., White S.D.M. 1999, MNRAS, 303,188
- [29] Morris R.G., Fabian A.C., 2003, MNRAS, 338, 824
- [30] Narayan R., Medvedev M. V., 2001, ApJ, 562, L129
- [31] Navarro J. F., Frenk C. S., White S. D. M., 1997, ApJ, 490, 493
- [32] Oegerle W.R., et al 2001, ApJ, 560, 187
- [33] O’Meara J.M. et al., 2001, ApJ, 552, 718
- [34] Pen, U. 1997, New Ast., 2, 309
- [35] Peterson J. R. et al., 2001, A&A, 365, L104
- [36] Peterson J.A. et al, 2002, astro-ph/0202108
- [37] Quilis V., Bower R.G., Balogh M.G., 2001, MNRAS, 328, 1091
- [38] Reynolds C. S., Heinz S., Begelman M. C., 2002, MNRAS, 332, 271
- [39] Ruszkowski M., Begelman M.C., 2002, ApJ, 581, 223
- [40] Sakelliou, I., et al 2002, A&A, 391, 903
- [41] Sanders J. S., Fabian A. C., 2002, MNRAS, 331, 273
- [42] Sasaki, S. 1996, PASJ, 48, L119
- [43] Schmidt R.W., Allen S.W., Fabian A.C., 2001, MNRAS, 327, 1057
- [44] Schuecker P., Böhringer H., Collins C.A., Guzzo L., 2003, A&A, 398, 867
- [45] Soker N., Blanton E.L., Sarazin C.L., 2002, ApJ, 573, 533
- [46] Tamura T. et al., 2001, A&A, 365, L87
- [47] Taylor G.B., Fabian A.C., Allen S.W., 2002, MNRAS, 334, 769
- [48] Voigt L. M., Schmidt R. W., Fabian A. C., Allen S. W., Johnstone R. M., 2002, MNRAS, 335, L7
- [49] White S.D.M., Rees M.J., 1978, MNRAS, 183, 341
- [50] White, S.D.M., Navarro J.F., Evrard A.E., Frenk C.S., 1993, Nature, 366, 429
- [51] Zakamska N.L., Narayan R., 2003, ApJ, 582, 162