Numerical Modeling of Gamma Radiation from Galaxy Clusters
Abstract
We investigate the spatial and spectral properties of non-thermal emission from clusters of galaxies at -ray energies. We estimate the radiation flux between 10 keV and 10 TeV due to inverse-Compton (IC) emission, -decay and non-thermal bremsstrahlung (NTB) from cosmic-ray (CR) ions and electrons accelerated at cosmic shocks as well as secondary e± generated in inelastic p-p collisions. We identify two main region of production of non-thermal radiation, namely the core (also bright in thermal X-ray) and the outskirts region where accretion shocks occur. We find that IC emission from shock accelerated CR electrons dominate the emission at the outer regions of galaxy clusters, provided that at least a fraction of a percent of the shock ram pressure is converted into CR electrons. A clear detection of this component and of its spatial distribution will allow us direct probing of cosmic accretion shocks. In the cluster core, -ray emission above 100 MeV is dominated by -decay mechanism. At lower energies, IC emission from secondary e± takes over. However, IC emission from shock accelerated electrons projected onto the cluster core will not be negligible. We emphasize the importance of separating the aforementioned emission components for a correct interpretation of the experimental data and outline a strategy for that purpose. Failure in addressing this issue will produce unsound estimates of the intra-cluster magnetic field strength and CR ion content. According to our estimate future space borne and ground based -ray facilities should be able to measure the whole non-thermal spectrum both in the cluster core and at its outskirts. The importance of such measurements in advancing our understanding of non-thermal processes in the intra-cluster medium is discussed.
keywords:
acceleration of particles — galaxies: clusters: general — gamma rays: theory — methods: numerical — radiation mechanism: non-thermal — shock waves1 Introduction
The structure and evolution of the large scale universe is a fundamental tool of cosmological investigation. Clusters of galaxies in particular, being the largest bound objects in the universe, have been studied extensively in order to “weight” the cosmos and to probe its structure. In the currently favored cold dark matter (CDM) hierarchical scenarios structure formation originates from the collapse of primordial density perturbations seeded at an inflationary epoch (Peebles, 1993). In this depiction, rich clusters of galaxies correspond to linear perturbations on scales of order Mpc comoving and, therefore, their potential wells are expected to accommodate a representative fraction of the actual mass content of the universe (White et al., 1993). By the same token, the environment there should be the end result of physical processes that occurred below or at that length scale. And, in fact, observational evidence tells us that with respect to its pristine conditions the intra-cluster medium (ICM) gas has been metal enriched by star formation processes, magnetized in some fashion and shock heated.
Perhaps spurred by observational progress, in recent years the subject of non-thermal process in, and their impact on, the ICM has attracted much attention. In this regard, Völk et al. (1996) pointed out that metal enrichment by galactic winds is likely accompanied by inter-galactic termination shocks where cosmic-ray (CR) acceleration might take place. In addition, Enßlin et al. (1997) studied the case of CR protons escaping from of radio jets into the ICM and Kronberg et al. (2001) that of black hole magnetic energy injection into the inter-galactic medium (IGM). The issue of CR ions produced at cosmic shocks (Miniati et al., 2000) and their possible dynamical role was addressed by Miniati et al. (2001b) by means of a cosmological simulation of structure formation which included direct treatment of acceleration, transport and energy losses of a CR component. They found that if shock acceleration takes place with some efficiency, CR ions, due to their long lifetime against energy losses and to their efficient confinement by magnetic irregularities (Völk et al., 1996; Berezinsky et al., 1997), may accumulate inside forming structures and store a significant fraction of the total pressure there (Miniati, 2000; Miniati et al., 2001b).
In order to assess the level of non-thermal activity in groups and clusters direct observations of the associated non-thermal emission is required. In particular, the integrated -ray photon flux above 100 MeV produced in the decay of neutral -mesons generated in p-p inelastic collisions, allows direct determination of the CR ion content and the pressure support that they provide. For the sources of CRs mentioned in the previous paragraph, the authors that investigated them estimated a -ray flux above 100 MeV that should be measurable by future targeted observations (Völk et al., 1996; Berezinsky et al., 1997; Enßlin et al., 1997; Blasi, 1999; Atoyan & Völk, 2000; Miniati et al., 2001b). However, in a recent paper Miniati (2002b) computed the inverse Compton (IC) -ray emission from shock accelerated CR electrons scattering off Cosmic Microwave Background (CMB) photons and for typical clusters of galaxies found it comparable to the -ray emission associated to -decay. The importance of the former process was recently pointed out by Loeb & Waxman (2000) in the context of the unexplained cosmic -ray background (see also Miniati, 2002b; Keshet et al., 2003). According to results of Miniati (2002b), the -ray flux from the leptonic component scales with the group/cluster temperature less strongly than its hadronic counterpart (Miniati et al., 2001b). This means that it should dominate the -ray emission of small structures. In addition, as we shall see in the ensuing sections, for conventional acceleration parameter values -ray from IC emission and -decay can be of the same order even for a Coma-like cluster. Thus, the aimed detection of -ray emission from clusters may not necessarily reflect the CR hadronic component and this should be borne in mind for a correct interpretation of the observational results.
With the objective of a correct diagnostic of future -ray observational results, in this paper we compute the radiation spectrum and spatial distribution of non-thermal emission from groups/clusters of galaxies. We inspect the case of CR ions and electrons accelerated at structure shocks as well as secondary electron-positrons (). However, we neglect the CRs that might originate at galactic wind termination shocks (Völk et al., 1996) and radio galaxies. The computed spectrum extends from hard X-ray (HXR) at 10 keV up to extreme -ray at 10 TeV. We examine the following emission processes: IC and non-thermal bremsstrahlung (NTB) from shock accelerated electrons, IC emission from e± and -rays from -decay produced by CR ions. We find that NTB emission is negligible throughout the spectrum. IC emission from shock accelerated electrons should dominate at HXR energies and be comparable to the flux from -decay at -ray energies. Finally, IC emission from e± is typically below these two components at all photon energies. However, we show that all of these three emission components (i.e., , e± and ) can potentially be individually measured by future -ray detectors with imaging capability by taking into account their peculiar spatial distribution and spectral properties. In particular we find that IC emission from shock accelerated CR electrons dominates the emission at the outer regions of galaxy clusters, provided that at least a fraction of a percent of the shock ram pressure is converted into CR electrons. Therefore, a clear detection of this component and of its spatial distribution will allow us direct probing of cosmic accretion shocks.
2 The Numerical Model
The objective of this study is to investigate the spatial and spectral properties of nonthermal -ray emission from CR electrons and ions accelerated at large scale structure shocks surrounding clusters/groups of galaxies. The task at hand requires accurate modeling of: (1) the large scale structure shocks where CR acceleration occurs; (2) the distribution within galaxy clusters of the baryonic gas which provides the CR targets for production of and secondary ; and (3) the spatial propagation and energy losses of the CRs. Furthermore, for a consistent description of the CR ions it is important to account for (the acceleration due to) all the shocks that have processed the gas that ends up within the GCs themselves. That is because CR ions with momenta above 1 GeV/c and up to eV/c have a lifetime against energy losses longer than a Hubble time.
This suggests that the formation of clusters and groups of galaxies be followed ab initio. Furthermore in order to reproduce meaningfully the shocks where the CR acceleration occurs, this should be done within the “natural” framework of cosmological structure formation. For this reason we have carried out a numerical simulations of structure formation which follows the evolution of both the gas and dark matter in the universe starting from fully cosmological initial conditions. Details on the cosmological simulation are given below in §2.1. In addition, with the numerical techniques described in the following sections (§2.2) we were also able to include the evolution of CR ions, electrons and secondary e± by accounting explicitly for the effects of CR injection (at shocks and through p-p inelastic collisions), diffusive shock acceleration, energy losses and spatial propagation. Thus in addition to the gas distribution the simulation will also provide us with the information about both the spatial and momentum distribution for each CR components. In particular this information will be used in the §3 to compute the spatial and spectral distribution of nonthermal -ray emission within gravitationally collapsed structures. Some of these results were already preliminarily presented in Miniati (2002a, c). Also, the simulation upon which the study is based, has been used by the author to study the contribution of -ray emission from CRs in the diffuse intergalactic medium to the cosmic -ray background (Miniati, 2002b).
In the following subsections we describe in further detail the salient features of the employed numerical techniques. These are basically the same as those used in previous related studies (Miniati et al., 2001b, a; Miniati, 2002b, c), and the reader familiar with them can skip directly to the result section in §3.
2.1 Large Scale Structure
The formation and evolution of the large scale structure is computed by means of an Eulerian, grid based Total-Variation-Diminishing hydro+N-body code (Ryu et al., 1993). We adopt a canonical, flat CDM cosmological model with a total mass density and a vacuum energy density . We assume a normalized Hubble constant km s-1 Mpc-1 = 0.67 (Freedman, 2000) and a baryonic mass density, . The simulation is started at redshift . The initial density field is homogeneous except for perturbations generated as a Gaussian random field and characterized by a power spectrum with a spectral index and “cluster-normalization” . The initial velocity field is then computed accordingly through the Zel’dovich approximation.
The choice of the computational box size is a compromise between the need of a cosmological volume large enough to contain a satisfactory sample of collapsed objects and numerical resolution requirements. Ideally one would like to be able to produce rich clusters of galaxies of the size of Coma cluster because they can be compared more easily with observations. However, in order for such massive objects to develop out of the initial conditions described above, the size of the computational box should be at least a few hundred Mpc in size. Although this could be achieved with Adaptive Mesh Refinement techniques, with the available computational resources and the code employed here the above box size would impose an unacceptably coarse spatial resolution. Therefore the size of the computational box is set to Mpc. Given the relatively small box size the dimensions of the largest collapsed objects, with a core temperature keV, are modest. Therefore, when in §3.4 and §3.5 we make predictions for a Coma-size cluster (with keV) the computed simulation results will be rescaled appropriately. The details of the rescaling procedure will be described in those sections.
Finally, the dark matter component is described by 2563 particles whereas the gas component is evolved on a comoving grid of 5123 zones. Thus each numerical cell measures about 100 kpc (comoving) and each dark matter particle corresponds to M⊙.
2.2 Cosmic-rays
In addition to the baryonic gas and dark matter, the simulation also follows the evolution of three CR components, namely CR ions and electrons injected at shocks and secondary e± generated in p-p inelastic collisions of the CR ions with the gas nuclei. This is achieved through the code COSMOCR fully described in Miniati (2001, 2002b).
The dynamics of each of these CR component consist of the following processes: injection, diffusive shock acceleration, energy losses/gains and spatial propagation. In this section we describe how each of these processes is modeled numerically and how it is implemented in the simulation. We notice from the outset that CRs are treated as passive quantities, meaning that their dynamical role is completely neglected both on the shock structure (test particle limit) and the gas dynamics.
2.2.1 Injection and acceleration at shocks
The first step in order to compute CR injection and acceleration at shocks, is to detect the shocks themselves. Here, as in previous studies, shocks are identified as converging flows () experiencing a pressure jump above a threshold corresponding to a Mach number M=1.5. For the identified shocks both mass flux and Mach number are computed. This is simply done by evaluating the jump conditions experienced by the flow as reproduced in the numerical simulation (e.g., Landau & Lifshitz, 1987). Shocks are found both around filaments and groups/clusters. In the latter case they show a rather complex structure (see §3.1 and Miniati et al., 2000, for a detailed description of cosmic shocks). An example of gas density distribution, velocity field and shock structure within a collapsed object is provided in Fig. 1, which illustrates the dominance of asymmetry in the accretion flows and the existence of strong accretion shocks at the outskirts region followed by weaker ones in the inner regions. A detailed description of Fig. 1 is delayed until §3.1 and we shall now focus on the description of the adopted CR injection/acceleration scheme.
As we shall see in the following, the mass flux through the shock and the shock Mach number determine two important quantities: respectively the CR injection rate and the shape of the accelerated distribution function. Injection and diffusive acceleration at shocks take place on spatial scales of the order of the particles diffusion length which is
| (1) |
where is the particle energy, is the magnetic field strength, the shock speed and we have assumed for simplicity Bohm diffusion. As discussed in Miniati (2001, see also ) to properly follow injection and acceleration at shocks one should at least resolve not only scales but also the shock structure including the subshock. Because such small scales can not be reproduced in the current simulation, injection and diffusive acceleration are not directly simulated but simply modeled. In particular, given the mass flux across a shock, the assumed injection model determines the fraction of particles that are converted into CRs. Then, the acceleration model determines how the injected CRs should end up distributed in momentum space.
For the injection of CR ions we follow the thermal leakage prescription (Ellison & Eichler, 1984; Quest, 1988; Kang & Jones, 1995). That is, the post-shock gas is assumed to thermalize to a quasi-Maxwellian distribution function characterized by a temperature . The ions/protons in the high energy tail of such distribution are assumed to be able to leak back upstream and undergo the acceleration mechanism. The momentum threshold for such injection is set to , where is the proton mass and is a control parameter (Kang & Jones, 1995). We adopt which implies that a fraction of the particles crossing the shock be injected in the acceleration mechanism. In terms of shock ram pressure, the pressure borne by the CR ions is a small fraction for weak shocks () and reaches 30 % for moderately strong shocks (). Given our simplified injection prescription for very strong shocks () this fraction can approach unity or so. Therefore, for consistency in these cases the fraction of injected particles is renormalized so that the CR pressure is always limited below 40% of the shock ram pressure.
As for electrons (primary ), we simply assume that the ratio between injected CR electrons and ions at relativistic energies be given by a parameter . The introduction of this parameter simplifies the treatment of this process, which is quite complex and yet to be fully understood (see, e.g., Ellison et al., 2000, for a discussion on this issue). Observationally, for Galactic CRs this ratio appears to be in the range (Müller & Tang, 1987; Müller & et al., 1995; Allen et al., 2001). Also, based on EGRET observational upper limits on the -ray flux from nearby clusters (Sreekumar et al., 1996; Reimer, 1999; Reimer et al., 2003), for a CR ion injection efficiency as assumed here Miniati (2002b) constrained . Therefore, in the following we set and all of our results concerning primary are based on this assumption.
CR ions and electrons injected as described above, are quickly accelerated to energies much higher then the thermal average through the diffusive shock acceleration mechanism. As already pointed out, given the prohibitively short length scales over which the acceleration process takes place, its direct inclusion in the simulation is not possible. In addition, for a typical shock with compression ratio close to four the acceleration time scale
| (2) |
is much shorter than the simulation dynamical time (computational time-step). Thus, as in previous studies, we assume that the injected CRs are accelerated instantly and distribute them in momentum according to a power-law distribution extending from injection up maximum energy, i.e.,
| (3) |
For CR ions is determined through the aforementioned thermal leackage injection model and for CR electrons it is such that at relativistic ( GeV) energies their ratio to accelerated protons is . According to the test particle limit adopted here, the log-slope of the distribution function is related to the shock Mach number, , as for . This implies relatively flatter distribution functions for stronger shocks.
Based on cluster/group properties, we found it appropriate to follow CR ions between momenta GeV/c and GeV/c. In fact, CR ions below quickly loose energy due to Coulomb losses and beyond GeV/c their confinement within cosmic structures becomes difficult (Völk et al., 1996; Colafrancesco & Blasi, 1998). CR electrons are followed between MeV and TeV. The latter is a reasonable value for the maximum energy to which CR electrons are shock accelerated, provided a magnetic field of order G.
2.2.2 Secondary Electrons and Positrons
In addition to ions and electrons injected and accelerated at shocks, CR electrons and positrons are also produced in hadronic collisions of CR ions with the nuclei of the intra-cluster gas. The parent CR ions are those computed in the simulation. Secondary are generated in the decay of charged muons according to
| (4) |
which in turn are produced in the following reactions
| (5) | |||||
| (7) | |||||
Additional e± are produced in cascades analogous to these by the following interactions: He, H and He. These are included by assuming a helium number fraction of 7.3% for the background gas and a ratio at fixed energy-per-nucleon for the CRs (Meyer et al., 1997). The distributions of the e± thus generated are obviously related to those of the parent CR ions. In particular, if the latter are distributed according to a power law, so are also the former.
2.2.3 Energy losses and spatial propagation
The numerical treatment of the CR dynamics is completed by accounting for both spatial transport and energy losses/gains as described by the diffusion-convection equation (e.g., Skilling, 1975a, b). In order to compute a numerical solution to this equation, we define a grid in momentum space by dividing it in logarithmically equidistant intervals (momentum bins). For each mesh point of the spatial grid, , the CR distribution function is then described by the following piecewise power-law (Jones et al., 1999; Miniati, 2001)
| (8) |
where are the bins’ extrema. Spatial propagation and energy losses of the accelerated CRs are then followed by solving numerically a diffusion-convection equation that has been multiplied by ‘’ and integrated over each momentum bin. Written in the comoving coordinates system adopted for the other simulated hydrodynamic quantities, such equation reads (Miniati, 2001)
| (9) |
Here is the comoving number density of CR in the i-th momentum bin and is a comoving source term, , describing either shock injection or e± generated in p-p collision and integrated also over the i-th momentum bin. In addition, is the cosmological expansion factor, is the Hubble parameter defining the cosmic expansion rate. Thus the first part of the second term in eq. (9) describes adiabatic losses/gains. Finally, represents energy losses due to Coulomb collision, bremsstrahlung, IC and synchrotron emission for electrons and ; and Coulomb and p-p inelastic collision for ions. All of them are fully described in Miniati (2001). In eq. (9) is the velocity field of the baryonic gas to which the CRs are assumed to be coupled through a background magnetic field. Thus once accelerated the CRs are passively advected with the gas flow. Notice that eq. (9) does not include the diffusion term present in the ordinary diffusion-convection equation. This is because, as pointed out in Miniati (2001, see also ) for typical flows in the simulation with a few 100 km diffusion over spatial scales 100 kpc is much slower than advection and can be neglected away from shocks. This is true for values of the diffusion coefficients typically assumed in the literature (see, e.g., Völk et al., 1996; Berezinsky et al., 1997). The value inferred for these diffusion coefficients is based on the assumption that the magnetic field fluctuations are described by a turbulent spectrum and that the total magnetic field energy density is that characteristic of G strong magnetic fields.
Integrating eq. (9) is sufficient for an accurate treatment of the ionic component. In this case, after advancing the solution to eq. (9) one time-step, both and defining the CR distribution function in eq. (8) are computed based on the updated values of and by assuming that is continuous at each bin interface.
For CR electrons, however, severe energy losses and distribution cutoffs render their numerical treatment much more delicate. For this reason for this component in addition to we also follow the correspondent bin kinetic energy . Here is the particle kinetic energy and is the Lorentz factor. The equation describing the evolution of is obtained in analogy to eq. (9), by integrating over the i-th momentum bin the same diffusion-convection equation (more properly a kinetic equation) that has been multiplied by . In comoving units this reads (Miniati, 2001)
| (10) |
where , now includes both adiabatic loss terms and those described by , and the third term on the right hand side includes contributions from CR pressure work and sink terms. The evolution of the CR electrons is obtained by integrating numerically eq. (9) and (10) through a semi-implicit scheme described in Miniati (2001, 2002b). The slope of the distribution function at each grid point and momentum bin is then determined self consistently by the values of and .
However, for the simulated CR electrons and e± with momenta between GeV/c and 20 TeV cooling time due to IC losses, yr, is much shorter than the typical computational time-step, yr. Thus, because (Courant condition), these particles only exist in grid cells where the source term and will not propagate outside it. Thus, as discussed in (Miniati, 2002b), in this case it is computationally advantageous and numerically correct to take directly the steady state solution to eq. (9) as
| (11) |
[a similar expression holds for eq. (10)]. Notice that refers to the cell-volume averaged number density of CRs. Physically, the expression in eq. (11) represents a summation of all the individual populations of CR electrons within the grid zone that, as they emerge from the acceleration region, and are being advected away from the shock, develop a cut-off due to energy losses. For what follows in the next sections it is relevant to notice that for an injection spectrum and for the case of energy losses dominated by IC emission, , the steady state distribution given in eq. (11) implies a cell-volume averaged distribution function .
Finally the CR ion distribution function is mapped by 4 momentum bins. For the electrons and e± we used 5+1 momentum bins. The first five are logarithmically equidistant and cover a momentum range between MeV up to GeV. The last electron momentum bin stores the CR electron steady-state distribution function between GeV and 20 TeV given by eq. (11). Our tests indicate that increasing the number of momentum bins for either CR component (ions and electrons) does not affect the results.
3 Results
In the following sections we present results based on the simulation just described on the emission of high energy radiation from CRs in groups/clusters of galaxies. In particular, we inspect the spectra, radial dependence and synthetic images for various emission mechanisms and for each computed CR population. For the purpose we excise out of the simulation box regions containing individual virialized objects. For each of them we compute the nonthermal radiation produced through emission processes described below, by using the simulated hydro (density) and CR (distribution functions) quantities. For simplicity in the following we focus only on a couple of simulated virialized objects, although the studied radiation properties are independent of our peculiar choice. Finally, in §3.2 and §3.3 we describe the qualitative properties of the nonthermal radiation whereas in §3.4 and §3.5 we will attempt quantitative predictions for a Coma-like cluster of galaxies.
3.1 Density and Velocity Structure
First we consider the largest virialized object in the computational box. This is characterized by an X-ray core temperature keV. The object is partially described in fig. 1 where the two panels show two dimensional cuts across the coordinate planes X-Y and Z-X respectively of the density distribution (in color scale), the velocity field (arrows) and the location of shocks (contours). The gas density is cm-3 at the core and drops by about 2 orders of magnitudes at a distance of a few Mpc. The tree-dimensional velocity characterizing the accretion flows is typically of order of 103 km s-1. The velocity field converges toward the mass concentration and becomes quite complex close to it. As described in more detail in Miniati et al. (2000), this is due to the large asymmetry of accretion flows. Noticeably, stream along filaments, which carry more momentum, reach closer to the central regions before being shocked. As a result the ensuing shock structure is also complex. The largest shocks are found up to Mpc from the core of the collapsed object. Additional shocks are present at intermediate distances, especially along filaments as already pointed out. These shocks have Mach numbers that range from up to 100 in the most outlining regions, to along filaments. Close to the high temperature core some discontinuities are also found. However, as it is apparent from the broad features of the isocontours, these are weak, tran-sonic shocks.
For the selected object the energy in CR ions is erg in the inner 1.5 Mpc and corresponds to about 26% of the thermal pressure within the same volume. We notice the presence in the neighborhood of the collapsed objects of a small structure which is is marginally visible above and to the right of it, in the left and right panels of fig. 1 respectively. As we shall see in the following, this will affect (particularly, will increase) the computed radiation spectrum at large radii.
3.2 Radiation Spectrum
In fig. 2 the quantity ‘’ in units ‘keV s-1’ associated with the selected object is plotted as a function of photon energy, . ‘’ is the volume integrated spectral power and is defined as
| (12) |
where is the spectral emissivity in units ‘keV cm-3 s-1 keV-1’ and is an integration volume defined by a radius . Here we set Mpc in order to account for the shock accelerated electrons which are typically located away from the cluster center (see fig 1). We consider the following emission processes: -decay (solid line), IC emission from shock accelerated electrons (dotted line) and from secondary e± (dashed line) scattering off CMB photons, and NTB from shock accelerated electrons (dot-dashed line). Thermal X-ray photons, of energy , can be neglected as seeds for IC emission of -rays with respect to CMB photons to first order approximation. In fact, although the number of available IC scattering electrons is larger by a factor ( this is not sufficient to compensate for the lower number of seed photons (especially for flat CR distributions such as those produced at accretion shocks) and for the IC cross-section suppression due to Klein-Nishina effects which enter for (see also, e.g., Enßlin & Biermann, 1998; Berrington & Dermer, 2002).
According to fig. 2, both emission from -decay and IC from primary e- contribute significantly to the -ray emission above 100 MeV. The actual proportion between these two components is determined by two factors: (a) The ratio of accelerated electrons and ions at relativistic energies, which has never been measured for cluster shocks. It is represented by the parameter and was set to in the current study. (b) The temperature of the group/cluster, from which the -ray luminosity from -decay and IC emission depend differently. In fact, for both processes the temperature dependence is expected to be of power-law type, but with a moderately steeper index for the hadronic emission component (Miniati et al., 2001b; Miniati, 2002b). Thus the relative strength of these two contributions as presented in fig. 2 is only indicative at this stage. However, it is within the objectives of the present paper to investigate possible strategies for their experimental determination. At HXR and soft -ray energies below 10 MeV, IC from primary e- dominates the spectrum although the contribution from e± is not negligible. However, as we shall see in the next sections, this source of emission should also be detectable at HXR energies owing to its different spatial distribution with respect to the primary e- .

Noticeably the radiation spectra of these three components are rather “flat”. This indicates that the primary CR ions and ’s were generated in shocks of at least moderate strength, i.e., . Indeed, for the hadronic component, the -ray emissivity from a CR ion distribution , is (cf. Mannheim & Schlickeiser, 1994). Thus, the case of an emission spectrum such that , implies a CR ion distribution with . As for both primary electrons and secondary e± , because of the severe energy losses suffered by these particles, the emission spectrum must be related to their steady state distributions. As pointed out at the end of §2.2, this is characterized by a steady-state log-slope, , that is steeper by one unit with respect to the source spectrum. The produced IC emissivity is of the form which satisfies the condition for and, therefore, . For primary e- this straightforwardly requires that these CRs were accelerated at strong shocks. For secondary e± with a source term of the form (cf. Mannheim & Schlickeiser, 1994), it requires that the parent CR ions were accelerated at strong shocks and that their log-slope distribution be .
Finally, NTB is negligible for all purposes. Notice that latter component includes also the contribution from trans-relativistic electrons. These manage to propagate away from the acceleration region (i.e., a shock) for a short time before being re-absorbed into the thermal pool due to Coulomb losses. This trans-relativistic component enhances the NTB emissivity with respect to that produced by the bulk of the relativistic electrons. In fact, it dominates the emission below 10 MeV causing a sort of bump in the shape of the spectrum about this photon energy (dot-dashed line in fig. 2).
3.3 Luminosity Volume Dependence
We now inspect the spatial distribution of the emissivity associated with the various processes presented in the previous section. As anticipated there, such information allows in principle a measurement of each individual emission component (except NTB).

With this in mind, in fig. 3 we show the radial dependence of the integrated photon luminosity above 100 keV, that is
| (13) |
where , the radius defining the integration volume, is now a varying parameter. Obviously, at these low energies there is no contribution from the CR ionic component. Thus the diagram contains only three curves illustrating IC emission from primary e- (dotted) and secondary e± (dashed) and, for completeness, NTB from e- (dot-dashed). This plot clearly shows how the radiation emitted by primary e- and secondary e± originates in spatially separate regions. In fact, the latter component saturates quickly within the central Mpc and dominates the total photon production there. On the contrary, the contribution from the former component becomes significant only at a distance of about 1.5 Mpc from the cluster center and keeps increasing up to several Mpc from there.

The situation is analogous at -ray energies. This is illustrated in fig. 4 where the integrated photon luminosity above 100 MeV, - defined by an equation analogous to eq. (13) - is plotted versus radial distance. Here it is the emission from -decay (solid line) that saturates at relatively short distances from the cluster center and dominates the photon emission in the inner regions. As before, IC emission from primary e- (dotted line) reaches a substantial level only outside a distance Mpc. IC emission from e± (dashed line) is now unimportant and, as in the previous case, NTB from primary e- (dot–dashed line) is completely negligible.
The radial dependence of the various radiation components presented in fig. 3 and 4 reflects both the spatial distribution of the emitting particles as well as the nature of the emission process. Thus, on the one hand, both e± and are produced at the highest rate in the densest regions where both the parent CR ions and target ICM nuclei are most numerous. Consequently, e± IC and -decay emissivities are strongest in the cluster inner regions and quickly fade toward its outskirts. Notice that in the case of fig. 3 and 4 this behavior is slightly altered by the presence of a nearby object (similar to the case in fig. 5 below) which causes these integrated photon luminosities to slowly grow even after few core radii instead of leveling out.
On the other hand, because of severe energy losses, the emitting high energy primary e- are only found in the vicinity of strong shocks where they are being accelerated. Notice that in this case the shocks must be strong so that enough particles are accelerated to high energies to produce appreciable emission. Thus, because the strongest shocks are located at the cluster outskirts rather than at its core where the ICM temperature is already high (fig. 1; also cf. Miniati et al., 2000), the spatial distribution of the emissivity is now reversed with respect to the previous case. Notice that, in line with this analysis, the drop of IC emissivity (from primary e- ) toward the inner regions is slightly more abrupt at -ray energies (fig. 4) than at HXR energies (fig. 3).
3.4 Synthetic Maps
In this section we present synthetic maps produced by non-thermal emission processes. These maps were obtained upon simple integration along the line of sight of the photon emissivity in the thin plasma approximation. We use them to study the morphology of the emitting region. In addition we investigate which emission component contributes most to the radiation spectrum when the latter is extracted from different spatial regions. Unlike plots in fig. 3 and 4, using synthetic maps will automatically account for projection effects.
We will attempt to relate the present analysis to the case of Coma cluster which, for its large size and relative vicinity, is likely the best source candidate for the detection of non-thermal, high energy radiation. Our calculations are now based on a different collapsed object extracted as before from the simulation box but relatively more isolated (and therefore better suited for the current purpose) than the previous one. It has a temperature of a few keV, a core density of cm-3. This object is smaller than Coma cluster and for that reason we will renormalize the emission components as follows.111 Notice that this “renormalization” procedure can be applied to any other cluster for which sufficient observational data are available. As for the hydro quantities we retain the temperature and density profiles produced in the simulation but renormalize them by (multiplying each of them by) the ratio of the observed and simulated core values. The following observed values for Coma cluster are taken: a temperature keV (Arnaud et al., 2001) and a gas density of cm-3. The thermal energy within 1 Mpc computed according to temperature and density thus renormalized corresponds to erg.
For the IC emission from primary e- we have used the recent finding of Miniati (2002b) indicating that the -ray flux due to this process scales with the X-ray temperature as . The total number of secondary , , and the associated IC flux , are normalized by assuming that these particles are responsible for producing Coma radio halo through emission of synchrotron radiation. For a given measured radio flux, , and an assumed average ICM magnetic field strength, , the total number of emitting particles scales as
| (14) |
where is the radiation spectral index. The assumption that Coma radio halo is produced by secondary e± , as opposed to high energy e- of different origin, allows us to also fix the total number of parent CR ions, , and the ensuing -decay fluxes, . In fact, since the steady-state total number of secondary CR electrons accords to
| (15) |
based on this and eq. (14) one finds
| (16) |
where and are the energy density in magnetic field and CMB radiation field, respectively. For the synchrotron flux needed in (14) and (16) we adopted the value mJy measured at 1.4 GHz by Deiss et al. (1997). When extracting synthetic spectra in the next section we consider two cases for the magnetic field strength corresponding to G and G (Kim et al., 1990). The former choice implies a ratio of CR ions to thermal energy about 30 % as opposed to almost 4% for the latter. This second case is assumed to produce the synthetic maps described below. Notice that its “renormalized” values would imply a lower CR ion acceleration efficiency then described in §2.2.1 and would also correspond to a parameter .
It is worth pointing out that according to eq. (14) and (16) smaller values of than assumed here would imply correspondingly higher fluxes of IC emission and -ray from -decay . For very weak fields, then, most of the assumed radio emitting particles could not be of hadronic origin due to EGRET upper limits on -ray flux from Coma cluster (Blasi & Colafrancesco, 1999; Miniati et al., 2001a, cf. also fig. 8). In the opposite limit of stronger magnetic fields than assumed here, less emitting particles would be required to produce the same radio emission. As a consequence, the associated IC flux is reduced proportionally to the inverse of the magnetic energy density [cf. eq. (14)]. However, as indicated by the expression in eq. (16), for and G, the -ray production from -decay reaches only a floor value. This is because even if the higher magnetic field implies a smaller number of radio emitting e± particles, in steady state a minimum rate of hadronic interactions is necessary to compensate for the increased synchrotron losses. In fact the enhanced synchrotron emission rate from the total particle distribution () is counterbalanced by the reduced number of steady state emitting e± [ - see eq. (15)]. Thus in secondary models of radio halos, there is a lower limit to the expected -ray flux from -decay .
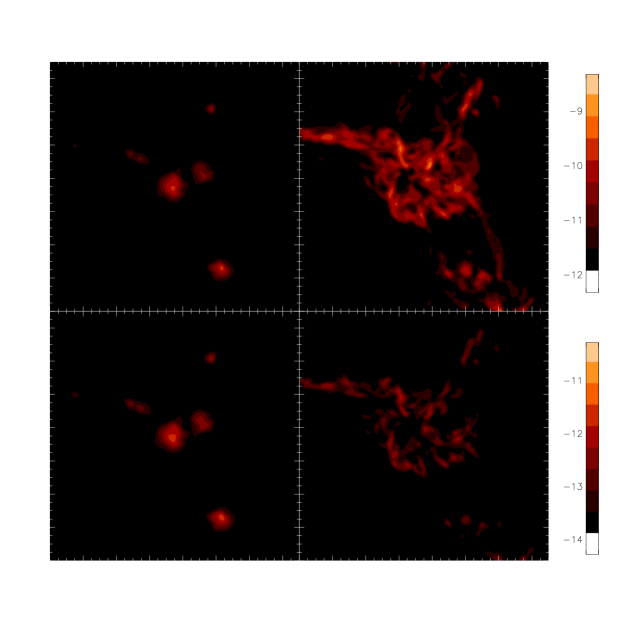
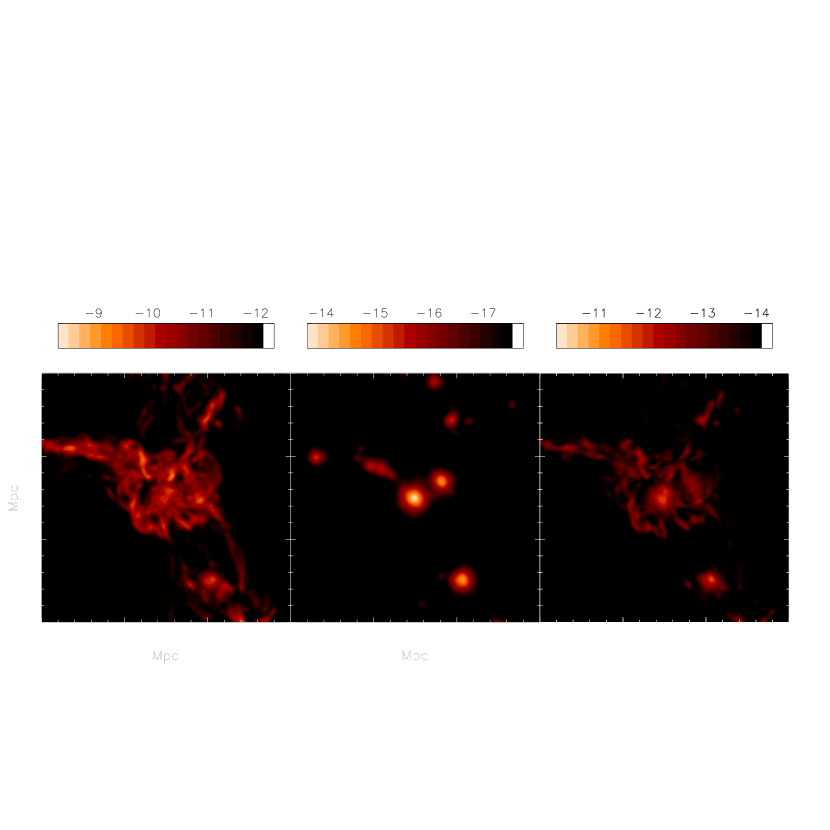
In fig. 5 we present synthetic maps of the integrated photon flux above 100 keV (top panels) and 100 MeV (bottom panels) for an assumed G. Right panels are associated with IC emission from primary e- whereas left panels correspond to emission due to IC from secondary e± (top-left) and -decay (bottom-left). The top and bottom panels of fig. 5 are combined in the left and right panels of fig. 6 respectively to produce a synthetic map of the total photon flux above 100 keV and 100 MeV. (For completeness these maps also include negligible contributions from the additional processes that were investigated in the previous section, e.g., NTB.) A synthetic map associated with the (not rescaled) bolometric X-ray emission from thermal bremsstrahlung is also shown in the central panel of fig. 6 to allow for comparison between thermal and non-thermal processes. Non-thermal maps are presented in units of “ph cm-2 s-1 arcmin-2” whereas thermal X-ray surface brightness is in units “erg cm-2 s-1 arcmin-2”.
The synthetic images in fig. 5 show that the non-thermal emissivity is remarkably extended. In accord with the previous section we find that the emission from -decay (bottom left) and e± (top left) is confined to the cluster core. There it creates a diffuse halo which rapidly fades with distance from the center. Also, as to be expected, there is a strong correlation between the spatial distribution of both these emission components and that of the thermal X-ray emission (fig. 6). On the other hand, IC emission from primary e- is distributed over a much more extended area. Moreover, it is characterized by a strikingly rich and irregular structure. This is a direct reflection of the complex “web” of shocks that reside at the outskirts of galaxy clusters first pointed out by Miniati et al. (2000). The morphology of the emissivity in fig. 5 and 6 is quite similar, although noticeably the central diffuse emission stands out more prominently in the high energy -ray map.
3.5 Synthetic Spectra
In order to assess the separability of the different emission components, in fig. 7 we have produced synthetic spectra taken from a core (top) and an outskirts region (bottom). The extension of the core region corresponds to an angular size of (or 2 Mpc diameter at the red-shift of Coma cluster) whereas the outskirts region is defined as an annular ring with inner and outer radii of and (or 1 Mpc and 3 Mpc at the red-shift of Coma cluster) respectively.

For the core region we consider two values for the magnetic field strength (0.15 and 0.5 G). For each emission region in fig. 7 we plot the predicted flux contribution due to the main emission processes considered so far namely, IC emission from primary e- (dot) and secondary e± (dash and dot–dash), and -decay (solid and long–dash). Notice that as the magnetic field strength is increased from 0.15 to 0.5 G the fluxes due to IC from e± and -decay drop by about a factor (cf. eq. 14 and 16). Fig. 7 shows that at high photon energy ( 100 MeV) the spectrum of radiation is indeed dominated by -decay in the core region (top panel) and by IC emission from primary e- in the outer region (bottom). In the latter case, the residual -decay component is actually due to the presence in the field of view of a small structure north-west of the selected object (see fig. 5; since this is not part of the main cluster, we do not renormalize it according to various magnetic field values as it was done for the core emission). In principle any contribution such as this can be removed by excision of emission regions associated with thermal X-rays from structures appearing in the field of view. Below 100 MeV the flux from the outskirts region is still strongly dominated by IC emission from primary e- . The contribution from the latter is much reduced in the narrower field of view of the core region. However, for the larger field case it is still significant and at the level of IC emission from secondary e± . The relative amount of radiation flux from these two components further depends on the actual shock structure subtended by the field of view. Nevertheless the point is that for magnetic field of a few tenths of G they are expected of comparable intensity. In order to separate them out one could measure the radiation flux as a function of radial distance in the outer regions, where it presumably is only due to CR electrons accelerated at accretion shocks, and then extrapolate its value for the core region. For this purpose, an angular resolution or so should be sufficient.
Finally, above the spectra are characterized by a cutoff which appears at photon energies about 1 TeV. For IC emission from primary e-, for which this feature is sharpest, this is mostly due to the maximum momentum, TeV, of the accelerated particles. For the other processes, it is rather caused by absorption due to the reaction . In fact, pair production becomes important at TeV energies due to the presence of diffuse background radiation field at optical/infrared wavelengths. The spectra in fig. 7 were thus corrected through a factor and by assuming an optical depth for pair production (e.g., Coppi & Aharonian, 1999)
| (17) |
where is the target photon energy and is the energy density carried by the background radiation taken from Dwek & Arendt (1998).
4 Discussion
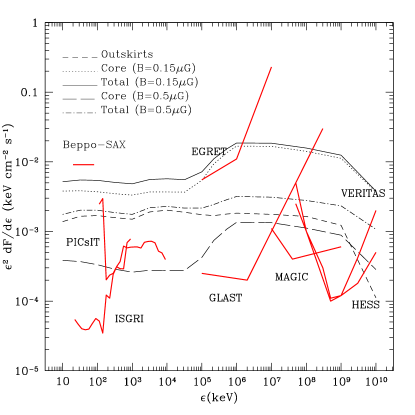
In fig. 8 we plot sensitivity limits of planned -ray observatories together with the total radiation spectra from the core (dotted line) and outskirts (dashed line) regions that were presented in fig. 7. The sensitivity limits are plotted for point sources. For extended sources it will be worse by roughly a factor that goes as that is the ratio between the source size and the angular resolution of the instrument. For Cherenkov telescopes In any case, according to this plot, several future experiments should be sensitive enough to detect the computed non-thermal emission at most photon energies. In particular the IBIS imager onboard INTEGRAL should readily measure the flux between 100 keV and several MeV. In addition GLAST and Cherenkov telescopes should be able to detect both the core -ray emission from -decay as well as the IC flux directly produced at accretion shocks above 100 MeV and 10 GeV respectively. One should notice that resolving sharp and complex structures such as those reported in fig. 5 and 6 is a real challenge, especially for coded mask techniques employed by several current and planned -ray imagers. Although a nominal resolution of in principle should be sufficient to identify some of the bright shock features, the final outcome of such measurements will hinge on the actual source fluxes and instruments performance.
The measurement of the non-thermal radiation spectra at several photon energies spanning the range illustrated in fig. 7 provides important information about the physical conditions in clusters. First, besides the mere detection of HXR and -ray radiation from clusters, important information is embedded in the spatial distribution of their surface brightness. In particular the extended emission component corresponds to the location of accretion shocks. Merger shocks have occasionally been observed in the core of clusters as relatively weak temperature jumps. However, strong accretion shocks have yet to be observed directly. Thus, detection and imaging of IC emission from primary electrons would provide an opportunity to directly observe these accretion shocks given their wide angular extension and their unique morphology.
In addition, the flux about 100 keV will give us the first direct estimate of the energy density of CR electrons and, together with radio measurements, will allow an estimate of (or upper limits on) the ICM magnetic field. In this respect for a correct interpretation of the data it will be necessary to account properly for the fluxes contributed by both the CR electrons in the core and those directly accelerated at the outlining shocks. In fact, the former likely propagate in relatively highly magnetized regions and produce a substantial radio emission. On the other hand, because of the expected decline of the magnetic field strength toward the outer regions, the latter might generate only a weak radio emission but, nonetheless, a strong IC flux. Since, as shown in fig. 7, the HXR flux produced by this second component can easily dominate the total flux at this spectral range (the details will depend on the assumed normalizations on acceleration efficiency and average magnetic field strength) separating the contributions from CRs in the cluster core and external accretion shocks will be an important step for correctly measuring ICM magnetic fields. A similar point was qualitatively discussed already in Miniati et al. (2001a) and was also addressed in Brunetti et al. (2001) in the context of a their “multiphase” acceleration model. In particular Brunetti et al. (2001) pointed out that the magnetic field in the outer region, where most of the IC emission is produced due to the larger emitting volume, can be much lower than in the core where the radio emission originates. In that model all the radio and HXR emitting particles are accelerated with the same mechanism, whereas in our model the CR electrons that generate the HXR flux are accelerated in the outer accretion shocks and never make it to the cluster core.
It is worth mentioning that our estimated non-thermal flux from IC emission above 20 keV is quite smaller than the recently reported measurements of excess of HXR radiation with respect to thermal emission. For the case of Coma cluster our predictions, as illustrated in fig. 8, fall short by a factor of several (Fusco-Femiano et al., 1999; Rephaeli et al., 1999). An analogous estimate, obtained for A2256 after appropriate rescaling, indicates a similar discrepancy by a factor (Fusco-Femiano et al., 2000), although the upper limits on A3667 are respected by our predictions (Fusco-Femiano et al., 2001). The above discrepancies between prediction and reported detections could be readily improved by assuming that the electron acceleration efficiency at shocks is larger by an order of magnitude with respect to what assumed here (see also Loeb & Waxman, 2000). Interestingly, since these electrons are located at the cluster outskirts and need not be responsible for the radio halo emission, their hard X-ray emission would not constraint the ICM magnetic field detected through Faraday rotation measures. However, as it is apparent from fig. 8, this is at odds with EGRET experimental upper limits on the -ray flux above 100 MeV (Sreekumar et al., 1996; Reimer, 1999; Reimer et al., 2003), which allow for the acceleration efficiency adopted here to be increased by at most a factor (Miniati, 2002b). This constraint, however, holds true only as long as: (1) CR e- are accelerated above momenta GeV/c and (2) the spectrum of the accelerated particles is not much steeper than computed here. These conditions, though, seem to be easily fulfilled for the case of accretion shocks. Thus, in this respect, if all of the HXR excess emission is diffuse in nature and not associated with individual sources, turbulent and/ or second order Fermi acceleration models may provide a more natural explanation because a high momentum cutoff in this range arises more naturally in those models (provided of course enough acceleration efficiency).
One of the most awaited experiments is related to the measurement of the -ray flux at and above 100 MeV. This is important in order to convalidate or rule out secondary e± models for radio halos in galaxy clusters (Dennison, 1980; Vestrand, 1982; Dolag & Enßlin, 2000; Blasi & Colafrancesco, 1999; Miniati et al., 2001a) and in order to estimate the non-thermal CR pressure there (Miniati et al., 2001b). In this perspective the above authors estimated for nearby clusters the -ray flux produced from the decay of neutral pions produced in p-p inelastic collisions. As pointed out in Miniati (2002b), however, -ray from IC emission can also be substantial and at the same level as that from -decay . Therefore, once again for a correct interpretation of the measurements, separation of these two components will be required. Estimating the -ray flux from IC emission due to shock accelerated CR electrons will be instrumental for addressing another issue of great interest. That is, the contribution of this emission mechanism to the cosmic -ray background (Loeb & Waxman, 2000; Miniati, 2002b; Keshet et al., 2003), for which so far the only constraint is provided by an upper limit based on EGRET experiments (Miniati, 2002b).
Photon energies of order GeV to TeV, will be investigated by Cherenkov telescopes. Such measurements will be complementary to that carried out at lower energies. Because the radiated energy spectrum is directly connected to the distribution function of the emitting particles, measuring the flux at different energies will provide information about the acceleration mechanism. In particular, the observed spectrum could differ from our predictions if the accretion shocks were modified by CR pressure. That in fact would cause the radiation spectrum to soften at low energies and to become harder toward higher energies, up to an energy cut-off (e.g., Malkov & Drury, 2001; Berezhko & Ellison, 1999; Kang & Jones, 2002). Given the different environmental conditions with respect to supernova remnants, these are interesting issues for a broad exploration of shock acceleration physics. Independent of the shock dynamics, measurements in this photon energy range should help determining the maximum momentum of the accelerated CR electrons and, perhaps, even of CR ions in case these maxima produce spectral cutoff before attenuation by absorption becomes important. For the electronic component this is not excluded and could allow a clearer specification of the energy range in which they can contribute to the cosmic -ray background.
5 Summary & Conclusions
We have explored the spatial and spectral properties of non-thermal emission at -ray energies. For the purpose we carried out a simulation of structure formation including the evolution of baryonic gas, dark matter, CR ions and electrons accelerated at cosmic shocks as well as secondary e± generated in inelastic p-p collisions. We estimated the radiation flux between 10 keV and 10 TeV from CRs in collapsed structures due to IC emission, -decay and NTB and made specific predictions for the case of Coma cluster. We have assessed the importance of distinguishing among the contribution from different CR components for a correct interpretation of future experimental results and we have outlined a strategy to do so. Our conclusions are summarized as follows:
-
•
Two main regions for production of non-thermal radiation in clusters/groups of galaxies were identified: the core also bright in thermal X-ray and the outskirts region where accretion shocks occur.
-
•
The chief radiation mechanism at all -ray energies in the outskirts region is IC emission from shock accelerated CR electrons, provided that a fraction of a percent of the shock ram pressure is converted into CR electrons. A clear detection of this component and of its spatial distribution will allow us direct probing of cosmic accretion shocks. Such evidence would corroborate recent findings about extra-galactic radio emission from large scale shocks (Bagchi et al., 2002).
-
•
In the cluster core, -ray emission above 100 MeV is dominated by -decay mechanism. At lower energies, IC emission from secondary e± takes over. However, IC emission from shock accelerated electrons projected onto the cluster core will not be negligible in general.
-
•
Separating the aforementioned emission components is important for a correct interpretation of the experimental data. This can be achieved in principle by measuring the spatial distribution of the detected emission.
-
•
Measuring the non-thermal spectrum will provide us with knowledge regarding: the injection efficiency as well as the ram pressure to CR pressure conversion efficiency for both electrons and ions; the energy range in which IC emission from CR electrons accelerated at accretion shocks can contribute to the CGB; the CR content in galaxy clusters; the dynamical conditions (CR modified or not) of the accretion shocks.
Acknowledgments
This work was carried out at the Max-Planck-Institut für Astrophysik under the auspices of the European Commission for the ‘Physics of the Intergalactic Medium’. I am grateful to E. Churazov, T. Enßlin, M. Gilfanov, F. Aharonian and I. Susumu for useful discussion. The computational work was carried out at the the Rechenzentrum in Garching operated by the Institut für Plasma Physics and the Max-Planck Gesellschaft.
References
- Allen et al. (2001) Allen, G. E., Petre, R., & Gotthelf, E. V. 2001, ApJ, 558, 739
- Arnaud et al. (2001) Arnaud, M., Aghanim, N., Gastaud, R., Neumann, D. M., Lumb, D., Briel, U., Altieri, B., Ghizzardi, S., Mittaz, J., Sasseen, T. P., & Vestrand, W. T. 2001, A&A, 365, L67
- Atoyan & Völk (2000) Atoyan, A. M. & Völk, H. J. 2000, ApJ, 535, 45
- Bagchi et al. (2002) Bagchi, J., Enßlin, T., Miniati, F., Stalin, C. S., Singh, M., Raychaudhury, S., & Humeshkar, N. B. 2002, NewA, 7, 249
- Berezhko & Ellison (1999) Berezhko, E. G. & Ellison, D. C. 1999, ApJ, 526, 385
- Berezinsky et al. (1997) Berezinsky, V. S., Blasi, P., & Ptuskin, V. S. 1997, ApJ, 487, 529
- Berrington & Dermer (2002) Berrington, R. C. & Dermer, C. D. 2002, ApJ
- Blasi (1999) Blasi, P. 1999, ApJ, 525, 603
- Blasi & Colafrancesco (1999) Blasi, P. & Colafrancesco, S. 1999, Astropart. Phys. , 12, 169
- Brunetti et al. (2001) Brunetti, G., Setti, G., Feretti, L., & Giovannini, G. 2001, MNRAS, 320, 365
- Colafrancesco & Blasi (1998) Colafrancesco, S. & Blasi, P. 1998, Astropart. Phys. , 9, 227
- Coppi & Aharonian (1999) Coppi, P. S. & Aharonian, F. A. 1999, Astropart. Phys. , 11, 35
- Deiss et al. (1997) Deiss, B. M., Reich, W., Lesch, H., & Wielebinski, R. 1997, A&A, 321, 55
- Dennison (1980) Dennison, B. 1980, ApJ, 239, L93
- Dolag & Enßlin (2000) Dolag, K. & Enßlin, T. 2000, A&A, 362, 151
- Dwek & Arendt (1998) Dwek, E. & Arendt, R. G. 1998, ApJ, 508, L9
- Ellison et al. (2000) Ellison, D. C., Berezhko, E. G., & Baring, M. G. 2000, ApJ, 540, 292
- Ellison & Eichler (1984) Ellison, D. C. & Eichler, D. 1984, ApJ, 286, 691
- Enßlin & Biermann (1998) Enßlin, T. A. & Biermann, P. L. 1998, A&A, 330, 90
- Enßlin et al. (1997) Enßlin, T. A., Biermann, P. L., Kronberg, P. P., & Wu, X.-P. 1997, ApJ, 477, 560
- Freedman (2000) Freedman, W. L. 2000, Phys. Rep., 333, 13
- Fusco-Femiano et al. (2000) Fusco-Femiano, R., Dal Fiume, D., De Grandi, S., Feretti, L., Giovannini, G., Grandi, P., Malizia, A., Matt, G., & Molendi, S. 2000, ApJ, 534, L7
- Fusco-Femiano et al. (1999) Fusco-Femiano, R., Dal Fiume, D., Feretti, L., Giovannini, G., Grandi, P., Matt, G., Molendi, S., & Santangelo, A. 1999, ApJ, 513, L21
- Fusco-Femiano et al. (2001) Fusco-Femiano, R., Dal Fiume, D., Orlandini, M., Brunetti, G., Feretti, L., & Giovannini, G. 2001, ApJ, 552, L97
- Jones et al. (1999) Jones, T. W., Ryu, D., & Engel, A. 1999, ApJ, 512, 105
- Kang & Jones (1995) Kang, H. & Jones, T. W. 1995, ApJ, 447, 994
- Kang & Jones (2002) —. 2002, JKAS, 35, 159
- Keshet et al. (2003) Keshet, U., Waxman, E., Loeb, A., Springel, V., & Hernquist, L. 2003, ApJ, in press, (astro-ph/0202318)
- Kim et al. (1990) Kim, K.-T., Kronberg, P. P., Dewdney, P. E., & Landecker, T. L. 1990, ApJ, 355, 29
- Kronberg et al. (2001) Kronberg, P. P., Dufton, Q. W., Li, H., & Colgate, S. A. 2001, ApJ, 560, 178
- Landau & Lifshitz (1987) Landau, L. D. & Lifshitz, E. M. 1987, Course of Theoretical Physics, Vol. 6, Fluid Mechanics, 2nd edn. (Oxford: Pergamon Press)
- Loeb & Waxman (2000) Loeb, A. & Waxman, E. 2000, Nature, 405, 156
- Malkov & Drury (2001) Malkov, M. A. & Drury, L. O. 2001, Rep. Prog. Phys., 64, 429
- Mannheim & Schlickeiser (1994) Mannheim, K. & Schlickeiser, R. 1994, A&A, 286, 983
- Meyer et al. (1997) Meyer, J.-P., Drury, L. O., & Ellison, D. C. 1997, ApJ, 487, 182
- Miniati (2000) Miniati, F. 2000, PhD thesis, University of Minnesota
- Miniati (2001) —. 2001, Comp. Phys. Comm. , 141, 17
- Miniati (2002a) Miniati, F. 2002a, in The Gamma-Ray Universe, ed. A. Goldwurm, D. Neumann, & J. T. T. Van, Moriond Astrophysics Meeting No. XXIInd, Les Arcs
- Miniati (2002b) —. 2002b, MNRAS, 337, 199
- Miniati (2002c) Miniati, F. 2002c, in The Universe Viewed in Gamma-Rays, ed. R. Enomoto, M. Mori, & S. Yanagita (Kashiwa: Universal Academy Press, Inc.), (preprint astro-ph/0212338)
- Miniati et al. (2001a) Miniati, F., Jones, T. W., Kang, H., & Ryu, D. 2001a, ApJ, 562, 233
- Miniati et al. (2001b) Miniati, F., Ryu, D., Kang, H., & Jones, T. W. 2001b, ApJ, 559, 59
- Miniati et al. (2000) Miniati, F., Ryu, D., Kang, H., Jones, T. W., Cen, R., & Ostriker, J. 2000, ApJ, 542, 608
- Müller & et al. (1995) Müller, D. & et al. 1995, in Int. Cosmic Ray Conference, Vol. 3, Rome, 13
- Müller & Tang (1987) Müller, D. & Tang, K.-K. 1987, ApJ, 312, 183
- Peebles (1993) Peebles, P. J. E. 1993, Principles of Physical Cosmology (Princeton New Jersey: Princeton University Press)
- Quest (1988) Quest, K. B. 1988, J. Geoph. Res. , 93, 9649
- Reimer (1999) Reimer, O. 1999, in ICRC, Vol. 4, Int. Cosmic Ray Conference, ed. . B. D. D. Kieda, M. Salamon, Salt Lake City, Utah, 89
- Reimer et al. (2003) Reimer, O., Pohl, M., Sreekumar, P., & Mattox, J. R. 2003, ApJ, in press
- Rephaeli et al. (1999) Rephaeli, Y., Gruber, D., & Blanco, P. 1999, ApJ, 511, L21
- Ryu et al. (1993) Ryu, D., Ostriker, J. P., Kang, H., & Cen, R. 1993, ApJ, 414, 1
- Skilling (1975a) Skilling, J. 1975a, MNRAS, 172, 557
- Skilling (1975b) —. 1975b, MNRAS, 173, 245
- Sreekumar et al. (1996) Sreekumar, P., Bertsch, D. L., Dingus, B. L., Esposito, J. A., Fichtel, C. E., Fierro, J., Hartman, R. C., Hunter, S. D., Kanbach, G., Kniffen, D. A., Lin, Y. C., Mayer-Hasselwander, H. A., Mattox, J. R., Michelson, P. F., von Montigny, C., Mukherjee, R., Nolan, P. L., Schneid, E., Thompson, D. J., & Willis, T. D. 1996, ApJ, 464, 628
- Vestrand (1982) Vestrand, W. T. 1982, AJ, 87, 1266
- Völk et al. (1996) Völk, H. J., Aharonian, F. A., & Breitschwerdt, D. 1996, Space Sci. Rev. , 75, 279
- White et al. (1993) White, S. D. M., Navarro, J. F., Evrard, A. E., & Frenk, C. S. 1993, Nature, 366, 429