The Clustering Dipole of the Local Universe from the Two Micron All Sky Survey
Abstract
The unprecedented sky coverage and photometric uniformity of the Two Micron All Sky Survey (2MASS) provides a rich resource for investigating the galaxies populating the local Universe. A full characterization of the large-scale clustering distribution is important for theoretical studies of structure formation. 2MASS offers an all-sky view of the local galaxy population at , unbiased by young stellar light and minimally affected by dust. We use 2MASS to map the local distribution of galaxies, identifying the largest structures in the nearby universe. The inhomogeneity of these structures causes an acceleration on the Local Group of galaxies, which can be seen in the dipole of the Cosmic Microwave Background (CMB). We find that the direction of the 2MASS clustering dipole is from the CMB dipole, confirming that the local galaxy distribution accelerates the Local Group. From the magnitude of the dipole we find a value of the linear bias parameter in the -band. The 2MASS clustering dipole is from the latest measurement of the dipole using galaxies detected by the Infrared Astronomical Satellite (IRAS) suggesting that bias may be non-linear in some wavebands.
1 Introduction
Since the discovery of a dipole in the CMB (Lubin et al., 1983; Fixsen et al., 1983) it has been identified as the Doppler signature of our motion relative to the CMB rest frame. Strong evidence in favor of this interpretation has been provided by the observation of a similar dipole in the surface brightness of radio galaxies in the same direction (Blake & Wall, 2002). Blake & Wall make the distinction between velocity dipoles caused by our motion and clustering dipoles which measure the distribution of galaxies. Attempts to measure the clustering dipole of local galaxies in the 1980s (Meiksin & Davis, 1986; Yahil et al., 1986; Lahav, 1987; Villumsen & Strauss, 1987) from only the fluxes and positions of galaxies led to results that were within from the CMB velocity dipole. The inclusion of redshift information led to a controversy over out to which distance the clustering dipole converges (Strauss & Davis, 1988; Lynden-Bell et al., 1989; Rowan-Robinson et al., 1990; Plionis & Valdarnini, 1991; Scaramella et al., 1991). Through the 1990s progressively larger redshift surveys were used in an effort to determine where the clustering dipole converges and to improve the calculation of cosmological parameters (Strauss et al., 1992; Hudson, 1993; Schmoldt et al., 1999; Rowan-Robinson et al., 2000). These improvements included determining the shot noise in the sample, optimizing the window function for smoothing and estimating the contribution of nonlinear effects to the velocity dipole (Strauss et al., 1992). These efforts have recently determined that the clustering dipole converges at Mpc (Schmoldt et al., 1999; Rowan-Robinson et al., 2000).
2MASS (Skrutskie et al., 1997) is the first near-infrared ( passbands) all-sky survey. 2MASS has an effective image resolution of 1 arcsecond and greater sensitivity than the far-infrared all-sky survey, IRAS. Most passbands tend to be sensitive to star formation rate, while the passband is most sensitive to stellar mass (Bell & de Jong, 2000), which probably makes the -band a better tracer of total mass. Therefore, 2MASS offers a unique opportunity for calculating a flux-weighted clustering dipole.
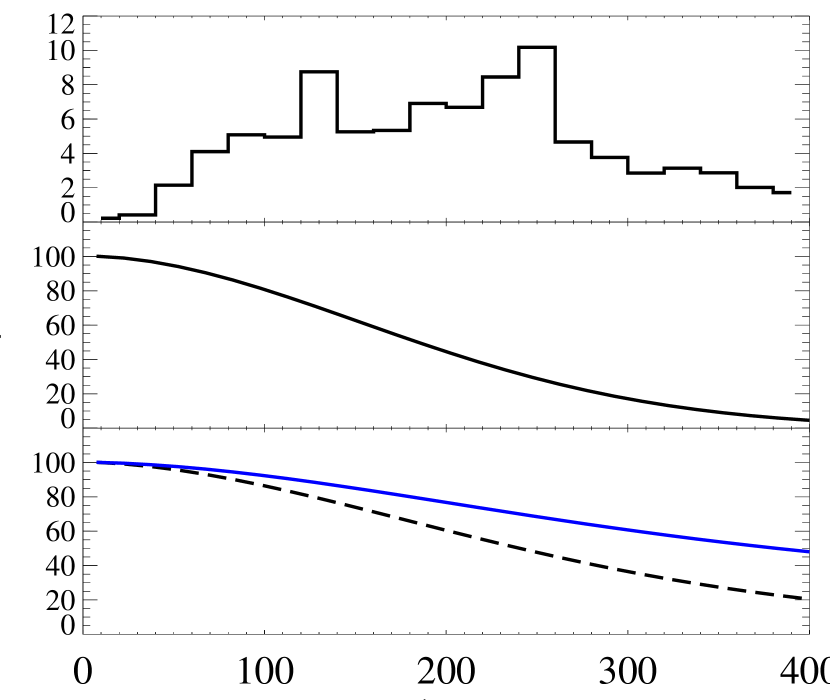
The median depth of the survey is , or Mpc (Bell et al., 2003), a distance past where the dipole has been shown to converge. Figure 1 shows the distance distribution for a magnitude-limited sample of 2MASS galaxies as determined from redshifts from the Sloan Digital Sky Survey early data release (Stoughton et al., 2002). At a limiting magnitude of mag, 2MASS includes all and brighter galaxies out to Mpc.
We can use the 2MASS luminosity function measured using the Sloan redshifts (Bell et al., 2003) to determine the completeness of the survey as a function of distance. The result, shown in Figure 1, is that the survey contains of the total luminosity and of the total flux inside Mpc. Thus 2MASS is a fairly complete survey of the total flux in the local universe. As we expect the clustering dipole to be dominated by bright objects, any missing flux is unlikely to contribute significantly to the dipole. Later we show that this is true by demonstrating the convergence of the clustering dipole as a function of apparent magnitude.
2 The 2MASS Catalog
The 2MASS final release extended source catalog is the most complete resource of local galaxy observations at near-infrared wavelengths. The catalog contains over 1.6 million sources, and for most Galactic latitudes () has completeness and reliability down to mag (Jarrett et al., 2000b). For , in regions where the stellar density is less than per square degree with mag stars, the catalog maintains its high completeness and is still reliable (Jarrett et al., 2000a). Hereafter, we adopt the Kron (1980) magnitudes, which attempt to recover the “total” galaxy flux using apertures related to the galaxy radius (limited in 2MASS to a 5″minimum). 2MASS Kron magnitudes underestimate the true total flux systematically by mag for (Bell et al., 2003), which we correct for when converting magnitudes to flux. The extended source catalog is complete within the Sloan early data release for extinction-corrected Kron mag (Bell et al., 2003). While the reliability decreases at lower galactic latitudes we will adopt this limiting flux and explore the effect of a brighter cutoff later on. The photometry of the catalog is very uniform with errors of less then magnitudes (Nikolaev et al., 2000). We have performed an analysis of the galaxy density with a number of possible contaminants and find that the cross-correlation is always less then (Maller et al., 2003).
We apply an extinction correction based on Galactic dust maps (Schlegel et al., 1998) to create a foreground corrected catalog of galaxies with mag. From the overlap with the Sloan spectroscopically confirmed galaxies we find that bright ( mag) galaxies have dust-corrected colors narrowly clustered around . Thus, we exclude objects brighter than mag with or , as there are no galaxies with these colors found in the confirmed sample ( objects). Since the photometric errors increase the spread in colors for faint objects we do not extend this color criteria below .
In the region and we mask out the region and extend this to in the region and , where the 2MASS sources are clearly obscured. We also remove galaxies that are members of the Local Group. This leaves us with galaxies covering of the sky. Note that applying no dust correction reduces the number of galaxies to .
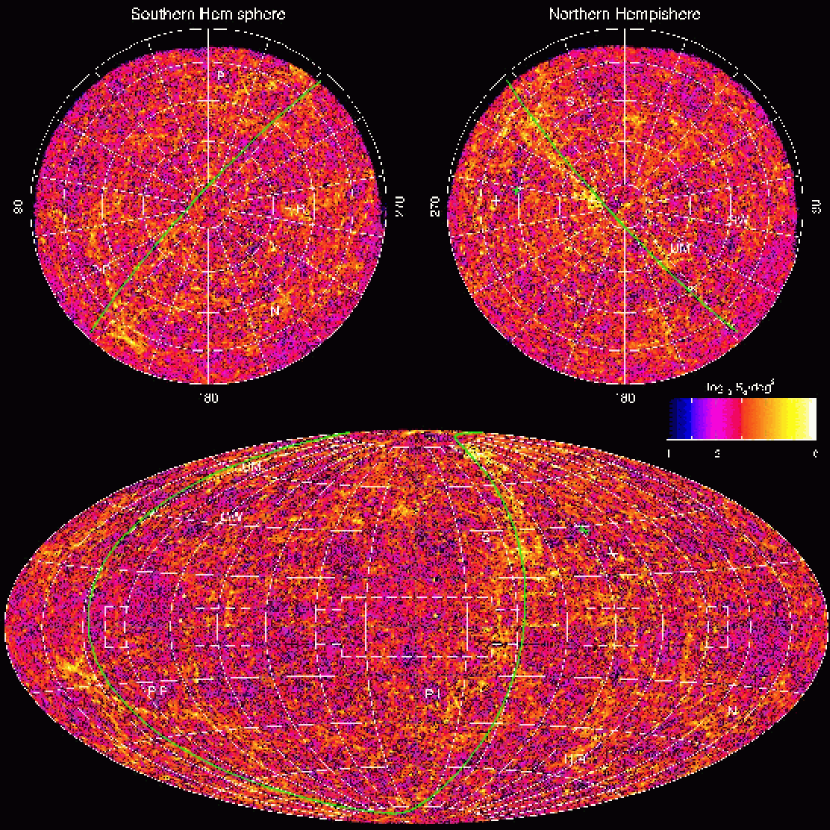
We display the most comprehensive representation of the local Universe in Figure 2. We see a complex web of galaxies stretched out along filaments between dense nodes often corresponding to the location of giant superclusters. The most obvious structure is the “Great Attractor” found within the region bounded by and . This structure is roughly divided into north and south Galactic hemisphere complexes – the overlapping Hydra-Centaurus and “Shapley” supercluster complex () and the Pavo-Indus wall () (Dressler, 1988; Fisher et al., 1995). The Perseus-Pisces “chain” extends from the Perseus supercluster (,) to (,)(Haynes & Giovanelli, 1986), and appears to reach up to along latitude (Fisher et al., 1995). It has been demonstrated that there is no physical link between the Perseus-Pisces chain and the Pavo-Indus wall(di Nella et al., 1996). Additional features include the Horologium-Reticulum supercluster (,) (Lucey et al., 1983), Virgo supercluster (,), the Ursa Major cloud (,), and the NGC 1600 group (,) (Fisher et al., 1995). Finally, the “Great Wall” at km/s (Geller & Huchra, 1989) is the faint feature running from the Hercules supercluster (,) to (,).
3 Measuring the Clustering Dipole
The inhomogeneity of these structures causes a gravitational acceleration on the Local Group of galaxies. The CMB velocity dipole (Lineweaver et al., 1996) results from the motion of the Sun relative to the CMB standard of rest. This motion can be broken down into two parts; the motion of the sun relative to the Local Group and the motion of the Local Group with respect to the CMB. Using the most recent values (Courteau & van den Bergh, 1999) we find that the Local Group velocity relative to the CMB is in the direction .
Since both gravitational force and flux fall off as distance squared, the net acceleration of the Local Group is proportional to the dipole of the light distribution for a constant mass-to-light ratio . Thus,
| (1) |
where is the flux received from each galaxy and is a directional unit vector. However, the light may be a biased tracer of mass (Kaiser, 1984); if there is linear biasing then the true acceleration would be a factor times the measured value.
Linear theory can be used to estimate the resultant velocity (Peebles, 1980), which depends on the matter density of the universe . The expected velocity of the Local Group is therefore,
| (2) |
where (Peebles, 1980) and is the Hubble constant. Of course, this is only true in linear theory. Nonlinear N-body simulations show that the velocity of a region like the local group is typically within of the computed linear acceleration and that the magnitude agrees to within (Davis et al., 1991). Measuring the light dipole therefore achieves two aims: (1) It verifies that the CMB dipole is truly caused by the Sun’s motion and (2) it can determine a combination of , and . Since and can be measured by other means we can therefore determine the value of .
To accurately calculate a clustering dipole we need to consider the effect of the masked region. We address this in two ways: by cloning the sky above and below the masked regions (Lynden-Bell et al., 1989), and by filling the masked region with randomly chosen galaxies such that it has the same surface density as the unmasked area. We apply both methods to estimate the uncertainty contributed by the masked region.
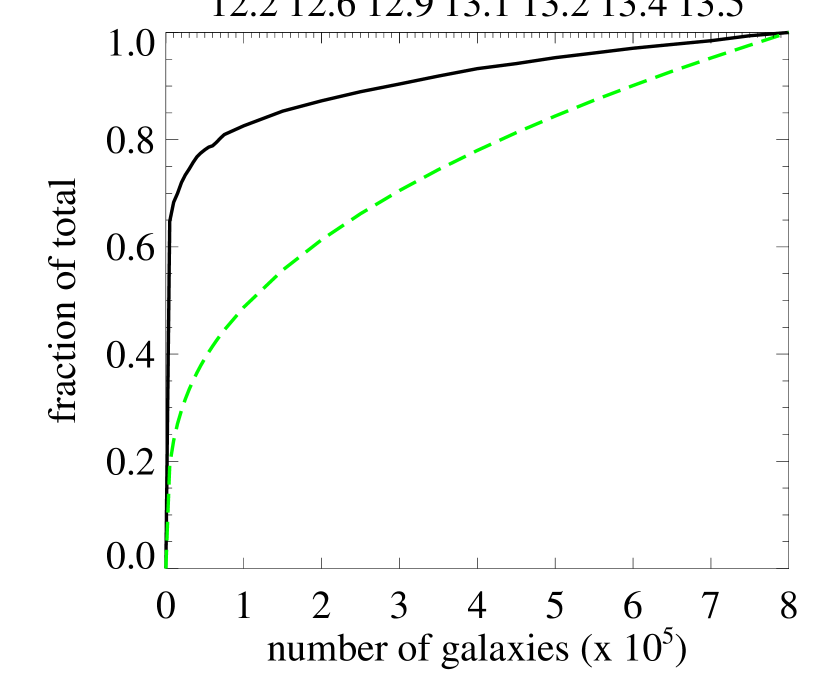
Figure 3 shows the convergence of the magnitude of the clustering dipole as a function of the flux limit of the survey. The dipole mostly arises from galaxies with mag, the brightest galaxies. The dipole converges at fainter magnitudes and the addition of galaxies with changes the dipole by less then . For comparison, the dashed line shows the growth in the total flux as a function of the number of galaxies used, which continues to grow for faint magnitudes. This is compelling evidence that the dipole has converged in the 2MASS sample and that any flux we are missing in low luminosity galaxies is a minor contribution.
To estimate the effect of shot noise on our calculation we perform bootstrap resampling on the galaxy catalog. We first bin the galaxies by their fluxes and then resample each flux bin to ensure that the resampled catalog has the correct flux distribution. Performing the resampling times the standard deviations of the clustering dipole direction is and in magnitude it is . We find that the systematic uncertainties are much larger than the shot noise.
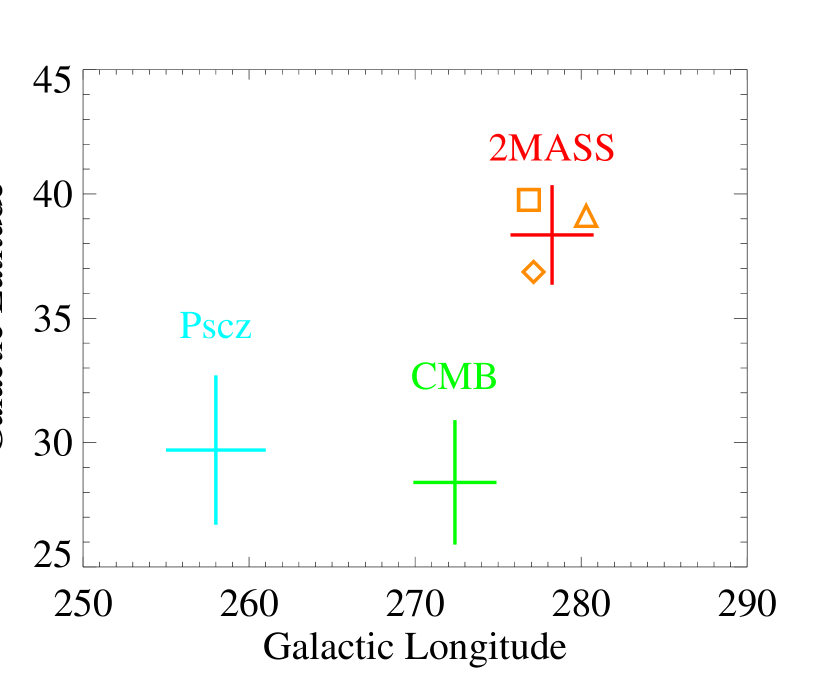
The most important sources of systematic error in our calculation are our treatment of the mask and of dust corrections. Cloning the sky above and below the mask gives a dipole pointing towards . If instead of cloning the adjacent sky we fill the mask with randomly selected galaxies the direction of the dipole changes to . If we perform no dust correction on the galaxy catalog then the dipole moves to (Figure 4). We adopt the centroid of these three measurements as the best fit dipole with error bars reflecting the dust correction and mask filling uncertainties. The dipole calculated only using galaxies brighter then points to verifying that the missing fainter galaxies are not introducing any significant error.
The clustering dipole is from the CMB velocity dipole, closer then any previous determination. This is somewhat larger then the average separation of found in the N-body simulations, but within confidence limits. Therefore we conclude that the 2MASS determined clustering dipole is consistent with the direction of the Local Group motion given the uncertainties caused by non-linear effects and systematic errors.
Interestingly, our clustering dipole is from the dipole measured most recently using the IRAS Psc catalog (Rowan-Robinson et al., 2000). This is larger than the systematic errors in either calculation and therefore suggests differences either caused by the passband of the survey or in the methods used to calculate the clustering dipole. It is possible that biasing schemes more complicated then simple linear biasing may be needed to explain this disagreement. The magnitude of the 2MASS clustering dipole is kpc-2, where again the errors are dominated by the systematic uncertainties in the dust correction and the treatment of the masked area.
4 Estimating b
The Wilkinson Microwave Anisotropy Probe (Bennett et al., 2003) has recently determined the matter density of the universe to be and (Spergel et al., 2003). From the 2MASS luminosity function we can determine the luminosity density of the universe to be (Bell et al., 2003) and therefore the average mass-to-light ratio, . Using these values in eq. 2 we find that the expected velocity in linear theory is compared to the value measured from the CMB of . Including the uncertainty between the linear prediction and the measured velocity in nonlinear N-body simulations we find . This can be compared with a measurement of bias from the 2df Galaxy Redshift Survey using redshift space distortions which finds that in the -band (Peacock et al., 2001).
If bias is luminosity or color dependent then we would expect a higher value from 2MASS than from the 2df Galaxy Redshift Survey. Since the measurement of bias as a function of waveband and scale is one of the most important tools used to understand the formation and evolution of galaxies, this measurement of the clustering dipole not only confirms basic cosmological predictions, but will also lead to a better understanding of how galaxies form.
References
- Bell et al. (2003) Bell, E., McIntosh, D. H., Katz, N., & Weinberg, M. D. 2003, ApJ, submitted, astro-ph/0302543
- Bell & de Jong (2000) Bell, E. F. & de Jong, R. S. 2000, MNRAS, 312, 497
- Bennett et al. (2003) Bennett, C. L., et al. 2003, ApJ, 583, 1
- Blake & Wall (2002) Blake, C. & Wall, J. 2002, Nature, 416, 150
- Courteau & van den Bergh (1999) Courteau, S. . & van den Bergh, S. 1999, AJ, 118, 337
- Davis et al. (1991) Davis, M., Strauss, M. A., & Yahil, A. 1991, ApJ, 372, 394
- di Nella et al. (1996) di Nella, H., Couch, W. J., Paturel, G., & Parker, Q. A. 1996, MNRAS, 283, 367
- Dressler (1988) Dressler, A. 1988, ApJ, 329, 519
- Fisher et al. (1995) Fisher, K. B., Huchra, J. P., Strauss, M. A., Davis, M., Yahil, A., & Schlegel, D. 1995, ApJS, 100, 69
- Fixsen et al. (1983) Fixsen, D. J., Cheng, E. S., & Wilkinson, D. T. 1983, Physical Review Letters, 50, 620
- Geller & Huchra (1989) Geller, M. J. & Huchra, J. P. 1989, Science, 246, 897
- Haynes & Giovanelli (1986) Haynes, M. P. & Giovanelli, R. 1986, ApJ, 306, L55
- Hudson (1993) Hudson, M. J. 1993, MNRAS, 265, 72
- Jarrett et al. (2000a) Jarrett, T.-H., Chester, T. H., Cutri, R., Schneider, S.,Rosenberg, J., Huchra, J. P., & Mader J., 2000a, AJ, 120, 298
- Jarrett et al. (2000b) Jarrett, T. H., Chester, T., Cutri, R., Schneider, S., Skrutskie, M., & Huchra, J. P. 2000b, AJ, 119, 2498
- Kaiser (1984) Kaiser, N. 1984, ApJ, 284, L9
- Kron (1980) Kron, R. G. 1980, ApJS, 43, 305
- Lahav (1987) Lahav, O. 1987, MNRAS, 225, 213
- Lineweaver et al. (1996) Lineweaver, C. H., Tenorio, L., Smoot, G. F., Keegstra, P., Banday, A. J., & Lubin, P. 1996, ApJ, 470, 38
- Lubin et al. (1983) Lubin, P. M., Epstein, G. L., & Smoot, G. F. 1983, Physical Review Letters, 50, 616
- Lucey et al. (1983) Lucey, J. R., Dickens, R. J., Mitchell, R. J., & Dawe, J. A. 1983, MNRAS, 203, 545
- Lynden-Bell et al. (1989) Lynden-Bell, D., Lahav, O., & Burstein, D. 1989, MNRAS, 241, 325
- Maller et al. (2003) Maller, A. H., McIntosh, D. H., Katz, N., & Weinberg, M. D. 2003, ApJ, submitted
- Meiksin & Davis (1986) Meiksin, A. & Davis, M. 1986, AJ, 91, 191
- Nikolaev et al. (2000) Nikolaev, S., Weinberg, M. D., Skrutskie, M. F., Cutri, R. M., Wheelock, S. L., Gizis, J. E., & Howard, E. M. 2000, AJ, 120, 3340
- Peacock et al. (2001) Peacock, J. A., et al. 2001, Nature, 410, 169
- Peebles (1980) Peebles, P. J. E. 1980, The large-scale structure of the universe ( Princeton, N.J., Princeton University Press, 1980. 435 p.)
- Plionis & Valdarnini (1991) Plionis, M. & Valdarnini, R. 1991, MNRAS, 249, 46
- Rowan-Robinson et al. (1990) Rowan-Robinson, et al. 1990, MNRAS, 247, 1
- Rowan-Robinson et al. (2000) Rowan-Robinson, M., et al. 2000, MNRAS, 314, 375
- Scaramella et al. (1991) Scaramella, R., Vettolani, G., & Zamorani, G. 1991, ApJ, 376, L1
- Schlegel et al. (1998) Schlegel, D. J., Finkbeiner, D. P., & Davis, M. 1998, ApJ, 500, 525
- Schmoldt et al. (1999) Schmoldt, I., et al. 1999, MNRAS, 304, 893
- Skrutskie et al. (1997) Skrutskie, M. F., et al. 1997, in ASSL Vol. 210: The Impact of Large Scale Near-IR Sky Surveys, 25–32
- Spergel et al. (2003) Spergel, D. N., et al. 2003, ApJ, submitted, astro-ph/0302209
- Stoughton et al. (2002) Stoughton, C., et al. 2002, AJ, 123, 485
- Strauss & Davis (1988) Strauss, M. A. & Davis, M. 1988, in Large-Scale Motions in the Universe: A Vatican study Week, 255–274
- Strauss et al. (1992) Strauss, M. A., Yahil, A., Davis, M., Huchra, J. P., & Fisher, K. 1992, ApJ, 397, 395
- Villumsen & Strauss (1987) Villumsen, J. V. & Strauss, M. A. 1987, ApJ, 322, 37
- Yahil et al. (1986) Yahil, A., Walker, D., & Rowan-Robinson, M. 1986, ApJ, 301, L1