The lithium depletion boundary and the age of NGC 2547
Abstract
We present the results of a photometric and spectroscopic survey of cool M dwarf candidates in the young open cluster NGC 2547. Using the 2dF fiber spectrograph, we have searched for the luminosity at which lithium remains unburned in an attempt to constrain the cluster age. The lack of a population of individual lithium-rich objects towards the faint end of our sample places a very strong lower limit to the cluster age of 35 Myr. However, the detection of lithium in the averaged spectra of our faintest targets suggests that the lithium depletion boundary lies at and that the cluster age is Myr. The age of NGC 2547 judged from fitting isochrones to low-mass pre-main-sequence stars in colour-magnitude diagrams is 2035 Myr using the same evolutionary models. The sense and size of the discrepancy in age determined by these two techniques is similar to that found in another young cluster, IC 2391, and in the low-mass pre main-sequence binary system, GJ 871.1AB. We suggest that the inclusion of rotation or dynamo-generated magnetic fields in the evolutionary models could reconcile the two age determinations, but only at the expense of increasing the cluster ages beyond that currently indicated by the lithium depletion. Alternatively, some mechanism is required that increases the rate of lithium depletion in young, very low-mass fully convective stars.
keywords:
stars: abundances – stars: late-type – stars: interiors – open clusters and associations: individual: NGC 2547.1 Introduction
Lithium can be a very short-lived element in the atmospheres of low mass pre-main-sequence (PMS) stars, burning swiftly in reactions once core temperatures approach K (Ushomirsky et al., 1998). Because PMS stars less massive than 0.35 M⊙ are always fully convective, the surface abundance of Li is also rapidly depleted when the core reaches this Li-burning temperature. The time taken for this to happen is sensitively dependent on mass and to a lesser extent on adopted equations of state and atmospheric boundary conditions. As a result, if one observes a cluster of co-eval stars with a range of properties, the mass, and hence luminosity and temperature, at which Li is observed to be depleted from its initial value offers a potentially precise determination of the cluster age. It has been claimed that this technique is less subject to systematic uncertainties in stellar models than cluster ages derived from the main-sequence turn-off or fitting low-mass, PMS isochrones (e.g. Bildsten et al. 1997).
Several attempts have been made to define the lithium depletion boundary (hereafter LDB) in the Pleiades, the Per cluster and IC 2391. Stauffer, Schultz & Kirkpatrick (1998) derive an LDB age of Myr for the Pleiades, considerably older than the nuclear turn-off age of 78 Myr derived by Mermilliod (1981) using models with no convective core overshoot, but younger than the 150 Myr obtained by Mazzei & Pigatto (1988) using models with very strong overshoot. Similarly, the LDB ages of Myr and Myr derived for the Per (Stauffer et al., 1999) and IC 2391 clusters (Barrado y Navascués, Stauffer & Patten, 1999) are older than their zero-overshoot nuclear turn-off ages of 51 Myr and 36 Myr respectively. The LDB ages offer a powerful argument for a modest amount of convective core overshoot and agree reasonably well with nuclear turn-off ages from such models (Ventura et al., 1998). Measuring the LDB in clusters of different ages and different turn-off masses might reveal whether the amount of convective overshoot is mass-dependent.
Finding clusters which are amenable to such analysis is not easy. The LDB position is difficult to measure because of the intrinsic faintness of the relevant PMS stars. Neither is the technique sensitive to ages less than 10 Myr or older than about 300 Myr. In the former case, lithium remains unburned in stars of all masses, whereas in the latter the gradient of the relationship between the luminosity at the LDB and age becomes quite shallow. NGC 2547 is a rich, young (1455 Myr) and nearby (400450 pc) open cluster, that offers excellent opportunities for exploring the early evolution of angular momentum, magnetic activity and lithium depletion among low-mass stars (e.g. Jeffries, Totten & James 2000a). In this paper we describe an attempt to find the LDB in NGC 2547. In Sect. 2 we describe previous observations and age determinations for this cluster. In Sect. 3 we describe a new photometric survey and subsequent spectroscopic observations (using the 2dF fibre spectrograph) to identify low-mass members of the cluster. In Sect. 4 we analyse the spectra of the cluster candidates and attempt to detect the Li i 6708Å resonance feature. In Sect. 5 we describe the location of the LDB and the isochronal and LDB ages of the cluster. Our results are discussed in Sect. 6.
2 NGC 2547: Previous observations and age determinations
NGC 2547 ( C0809-491) is an interesting young cluster and the question of its age has been scrutinized from two traditional view points: main-sequence turn-off and low-mass star isochrone fitting. Clariá (1982) investigated the high mass population, finding a reddening of , an intrinsic distance modulus of and an age of Myr. Jeffries & Tolley (1998) estimate an age of Myr and an intrinsic distance modulus of based on isochrones and models from Meynet, Mermilliod & Maeder (1993) and Schaller et al. (1992). These models feature a modest amount of convective overshoot (the same sets of isochrones yield ages of 52 Myr and 100 Myr for the Per and Pleiades clusters respectively). The major sources of uncertainty here are simply the very small number of stars that define the turn-off, together with their photometric errors and uncertain binary status.
Jeffries & Tolley (1998) reported ROSAT X-ray observations and a survey of the cluster, identifying a large population of X-ray active, low-mass PMS stars. Fits to low-mass isochrones, derived from the models of D’Antona & Mazzitelli (1997), indicated an age of Myr with a very small spread ( Myr). Recently, Naylor et al. (2002) have re-analysed the survey of the cluster and obtained a better age estimate of 2035 Myr and an intrinsic distance modulus of 8.008.15, using new empirically calibrated, low mass isochrones from D’Antona & Mazzitelli (1997) and Siess, Dufour & Forestini (2000).
Jeffries et al. (2003) present results of an investigation of Li depletion among the K and early M stars of NGC 2547. The targets in that paper were selected from the X-ray observations and photometry summarised in the previous paragraph and observed with the 2dF spectrograph (a year before the observations described in this paper). They found that for some models of PMS evolution (those of Baraffe et al. 1998 and Siess et al. 2000), both the positions in the colour-magnitude diagrams and the degree of PMS Li depletion for the majority of 0.5-0.9 M⊙ stars could be simultaneously satisfied at an age of Myr. However, these observations did not look at stars faint enough to put a strong constraint on the age from the LDB. From the same data, Jeffries et al. (2000b) reported no evidence of the Li i feature in stars as faint as and hence estimated an age 23 Myr – quite consistent with the Li depletion seen in higher mass stars and the nuclear turn-off age.
3 Observations and data reduction
3.1 photometric survey
New photometric data for NGC 2547 were obtained with the 0.91-m telescope at the Cerro Tololo Interamerican Observatory (CTIO), from 4th to 9th February 1999. The dataset consists of 23 overlapping 13.5′13.5′ fields in , and . The survey covers an area of approximately a square degree. Individual frames were de-biased, flat-fielded with twilight sky flats and in the case of the frames, de-fringed using a median stack of all the night-time exposures. The analysis of these images was achieved using the procedures and algorithms described in detail by Naylor et al. (2002). Photometric calibration onto the Cousins system was done with reference to 26 measurements of standard stars from Landolt (1992). Only two stars with mag were included and so although the global fit to the standards had an rms discrepancy of 0.04 mag in and 0.03 mag in , we believe there may be systematic errors in the colours and magnitudes for mag of up to 0.1 mag (for the redder objects we found a systematic effect in Ic-band magnitude of 0.07 mag when comparing our catalog with the one presented in Naylor et al. (2002)). colours were calibrated using standard stars defined by Zapatero Osorio et al. (1999) in Landolt’s SA98 field. The calibrations were taken from the best photometric night. Frames taken on other nights were tied to this calibration via the substantial (2.5′) overlaps between fields (see Naylor et al. 2002). Our survey reached (S/N) depths of , and . The astrometry has been calibrated against the USNO A2 catalogue (Monet, 1998), and yields typical positional accuracies of 0.25″rms.
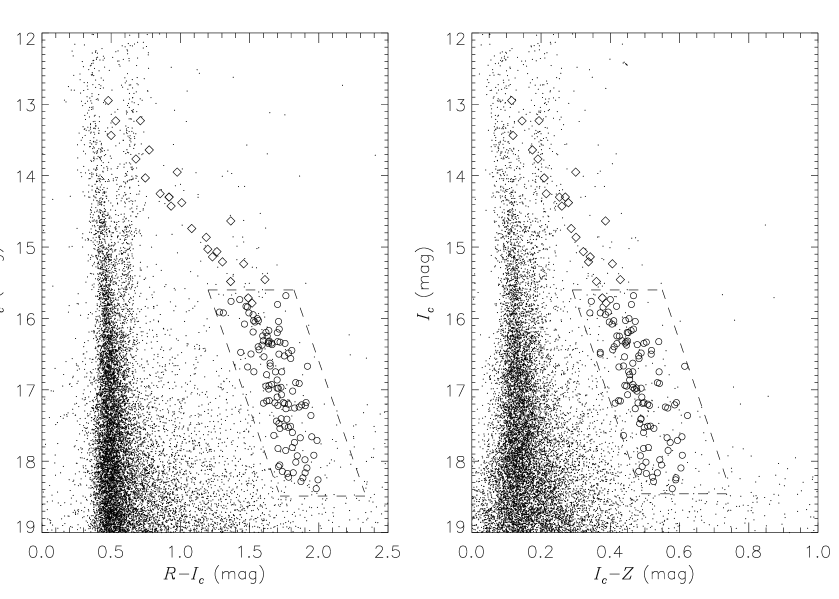
Fig. 1 shows the and colour-magnitude diagrams of the central area of our survey. The pre-main-sequence can clearly be seen separated from the back- and foreground populations. The symbols represent objects with 2dF spectra: either from the sample discussed here (circles) or from the earlier observations of X-ray selected brighter members from Jeffries et al. (2003, diamonds).
3.2 2dF spectroscopic survey
The primary goal of these observations was to determine the position of the LDB by inferring Li abundances from the Li i 6708 Å resonance doublet. Observations of cool young PMS stars suggest that undepleted Li will produce a saturated equivalent width (EW) of 0.6 Å for this feature (Zapatero Osorio et al., 2002). Theoretical curves of growth tally with these observations and predict that a star depleted by a factor of 100 from its initial Li abundance will still have an Li i 6708 Å EW of 0.3 Å (Zapatero Osorio et al., 2002) but that the line disappears rapidly for even lower abundances (e.g. Pavlenko & Magazzu 1995). According to evolutionary model predictions (e.g. D’Antona & Mazzitelli 1997; Baraffe et al. 1998) the Li abundance should change from undepleted to depleted by more than a factor of 100 over a 0.2 mag increase in luminosity. Thus measurements with an EW accuracy of 0.10.2 Å should be capable of identifying the LDB.
Candidate cluster members were selected as spectroscopic targets based on their positions in both the and colour-magnitude diagrams. We were guided by the predictions of empirically calibrated models and the positions of previously identified members of both NGC 2547 and IC 2391 (a cluster of comparable age) in these colour-magnitude diagrams (see Sect. 5.4.2). The 109 spectroscopic targets have magnitudes of 15.6 18.3 and are within a 0.8 0.8 field. Tables 1 & 3 list the coordinates, Ic magnitudes, and colours for the objects observed, as well as a membership flag and measurements of the lithium feature (Sect. 4). To make it easier for the reader, we have separated the description of the sample into: Table 1 for those objects that are suspected to be Li rich, and Table 3 for objects with no detected lithium (Sect. 4.3). The spectroscopic sample contains about 50 per cent of “eligible” targets (those with the right colours and magnitudes) on average, varying from 40 per cent at the brighter magnitudes to 65 per cent for mag. However this must be a lower limit to the percentage of cluster members observed because both the cluster members and the spatial distribution of our targets are centrally concentrated. Littlefair et al. (2003) use the membership catalogue of Naylor et al. (2002) to deduce that the half-mass radius for low-mass stars in NGC 2547 is about 0.2. In other words, given that we expect some contamination by non-members (see Sect. 5.2), we expect more contamination in the outer parts of our survey. The dense coverage and relatively uniform spread in target magnitudes of our sample should ensure that the LDB, if within this magnitude range, can be located accurately.
Spectra were obtained on the nights of 28th and 29th of February 2000 with the fiber-feed multi-object spectrograph 2dF (Lewis et al., 2002) at the prime focus of the 3.9 m Anglo-Australian Telescope (AAT). Each 2dF field plate has 400 object fibers which are 140 m in diameter, corresponding to about 2 on the sky. This implies that target positions have to be accurate to better than about 0.5 to avoid significant light loss. To achieve adequate astrometric accuracy, the target positions were cross-correlated with the SuperCOSMOS Sky Survey catalog (Hambly et al., 2001a, b). The 2dF configuration program configure was then used to allocate as many objects as possible to fibers in the 2dF field, subject to constraints on fiber proximity. About 15 fibers in each field are assigned to sky positions to allow accurate sky subtraction. The final fiber positioning and observational procedures are mostly automated111http://www.aao.gov.au/2df/manual/2df_manual_inline.html. There are two identical spectrographs and CCD detectors, each receiving 200 fibers. Therefore each science exposure actually comprises two individual CCD images, that are reduced independently. The 1200R grating was used (in both spectrographs) to give a 2.2 Å resolution over a range of 1100 Å centered at 6700 Å.
From the experience of a previous 2dF service run (Jeffries et al., 2000b, 2003), the desired equivalent width accuracy can be achieved with spectra of signal-to-noise 15 per 1.1 Å pixel. Individual exposures times (per configuration) range from 2700 to 3600 sec. For most targets multiple exposures were obtained, to achieve a higher signal-to-noise, with total exposure times per target ranging from 1.3 h to 7.8 h.
Data reduction was performed using the 2dF Data Reduction system (2dfdr version 2.0 for linux), mostly following the advised reduction steps. We did not perform scattered light subtraction or flatfield the spectra, since these procedures were introducing spurious artifacts. Relative fiber transmissions were obtained from offset sky frames and an average sky spectrum was obtained from sky fibers in the stellar frames. Multiple exposures of each field configuration were combined within 2dfdr. Once the reduction procedure was concluded, the resulting combined frames were analysed using the IDL222http://www.rsinc.com/idl/index.asp software.
4 Spectral Analysis
ht

4.1 Optimal variance determination and combination of stellar spectra
Most objects were observed several times during the run with different fiber configurations. In order to better combine these spectra, an accurate determination of the true variance of each spectra is needed. The major difficulty is separating the intrinsic noise in the spectrum from the rich background of spectral features and molecular bands that permeates this spectral region for late spectral types.
Using the difference of pairs of spectra of the same star, we are able to reasonably remove the “feature noise” component and are left only with the true variance. As expected, the variance of the spectra of the brighter targets follows a linear relation with number of counts and the inverse of the slope measures the effective gain of the CCD camera. The scatter reflects different observing conditions and fiber throughput corrections. Using this linear relation, we can estimate the true variance for each spectrum and thus the true signal-to-noise ratio. Multiple spectra of the same object were averaged, weighted by the calculated variance.
This procedure works less well towards the faintest objects. Sky subtraction accuracy in the continuum count level is of the order of 610% of the original sky level. For the fainter objects, the sky signal down a fiber is larger than the stellar flux level; so the final stellar flux (in counts) can be rather uncertain. This is taken into account when computing the errors in measured equivalent widths of spectral lines (Sect. 4.3).
4.2 Spectral indices
Our 109 spectra of candidate NGC 2547 members were analysed firstly by looking at two spectral indices and comparing those with spectral standards. These spectral indices measure the strength of the TiO and CaH molecular bands and are defined as (Allen, 1996; Briceño et al., 1998)
where C (70207050 Å) represents the pseudo-continuum and TiO (71257155 Å) and CaH (69606990 Å) molecular absorption bands, integrated in the indicated wavelength intervals.


In Fig. 2 (a and b) we plot each of these spectral indices against color for our sample and for the sample from Jeffries et al. (2003). Throughout this paper we assume =0.04, consistent with low reddening determined by Clariá (1982). We use these diagrams to further refine the sample by checking if the targets have spectral indices consistent with what is expected for M dwarfs; we choose to exclude targets that have the CaH (6975 Å) index too low for their colour (indicative of a lower gravity e.g. Allen & Strom 1995) and some targets that have a deviant TiO (7140 Å) index. Given the sky subtraction errors in the faintest targets, these spectral indices are uncertain by 0.050.1 (for CaH) and 0.10.2 (for TiO). The adopted selection cuts are therefore quite severe and it is probable that a handful of genuine members (those with poor sky subtraction) have been excluded. For the purpose of this paper it is better to be incomplete than include many contaminating non-members (see Sect. 5.2).
From the original sample of 109 objects with mag we are left with 94 objects with colours and indices consistent with late spectral types and cluster membership. Using the TiO (7140 Å) index we estimate these objects to have spectral types mostly between M3 and M5 (with a few M2 and M6 objects). The objects rejected as non-members based on their indices are described with the flag NM (non-member) in Tables 1 & 3, otherwise they are flagged M (members). We plot in Fig. 2 (c) the CaH (6975 Å) index against the TiO (7140 Å) index for our sample, together with several standard stars and a locus (from Allen & Strom 1995), indicating where low gravity giants would lie. Our cluster candidates have dwarf-like gravities, although there is a hint that the gravities are lower on average than in the field stars. This is what we would expect from a population of M dwarfs in a cluster of age Myr. The models of Chabrier & Baraffe (1997) indicate that M-dwarfs of 0.1 to 0.5 and age 30 Myr, have surface gravities that are between 0.5 and 0.3 dex lower than stars of similar spectral type at Gyr, but which are still several dex higher than M giant gravities.
In principle, the H line could also be used as a membership criterion. Young, magnetically active M2M6 PMS stars should exhibit strong chromospheric H emission, with an EW of 130 Å. Unfortunately, the strength of H in the sky spectra (arising both from the night sky and an H ii region apparently centred on NGC 2547) and the uncertainties in the relative fiber throughput calibration, mean we are unable to provide a useful estimate of the H EW for our targets.
4.3 The Li i feature detections
| J2000 Position | Ic-band | ) | ) | Li | ||||||
|---|---|---|---|---|---|---|---|---|---|---|
| ra | dec | mag | error | mag | error | mag | error | flag | EW (Å) | |
| 26 | 8 12 28.29 | 49 16 53.4 | 16.325 | 0.006 | 1.703 | 0.010 | 0.540 | 0.007 | M | 0.4860.07 |
| 38 | 8 08 16.68 | 49 15 35.6 | 16.485 | 0.004 | 1.781 | 0.007 | 0.489 | 0.005 | M | 0.3970.09 |
| 65 | 8 08 35.99 | 49 07 49.7 | 17.151 | 0.004 | 1.642 | 0.006 | 0.424 | 0.005 | M | 0.6620.11 |
| 100 | 8 09 53.16 | 49 05 37.8 | 18.076 | 0.017 | 1.709 | 0.030 | 0.492 | 0.019 | M | 0.8800.23 |
| 67 | 8 10 13.90 | 49 39 48.2 | 17.178 | 0.008 | 1.908 | 0.014 | 0.591 | 0.009 | M | 0.5550.27 |
| 72 | 8 08 29.18 | 49 03 54.9 | 17.201 | 0.016 | 1.780 | 0.027 | 0.508 | 0.016 | M | 0.4040.14 |
| 75 | 8 09 50.22 | 49 21 15.8 | 17.241 | 0.016 | 1.858 | 0.025 | 0.559 | 0.016 | M | 0.3340.21 |
| 91 | 8 10 46.12 | 49 06 28.5 | 17.737 | 0.017 | 1.824 | 0.059 | 0.573 | 0.020 | M | 0.2530.15 |
Our main goal is to determine the position of the lithium depletion boundary for NGC 2547. To that end we have analysed the spectra of the 94 remaining cluster candidates covering the range 15.618.3 mag in .
In Fig. 3 we plot the Li i profiles we found in our target sample. The plots on the left are (we claim) positive detections of the lithium feature, while on the right are more marginal detections (all shown as thick-lines); we have overplotted (with light-lines) example spectra of objects with similar magnitudes that appear not to show the Li feature.
For the 8 objects in Fig. 3 we give their Li equivalent width333In reality we are measuring a pseudo equivalent width with respect to the local pseudo-continuum (e.g. Zapatero Osorio et al. 2002) (EW) and errors (Table 1). The Li feature was integrated over a fixed 5 pixel interval, corresponding to a width of 5.5Å. The EW error has two components that are added in quadrature. The error due to pixel-to-pixel uncertainties on the flux values within the integration interval can be described as EW = /SNR, where r and p are the width of the feature and the pixel width respectively, and SNR is the signal-to-noise ratio per pixel (as derived in Sect. 4.1). The other error contribution comes from the uncertainties in the continuum flux level (Sect. 4.1) from the estimated sky subtraction error. The latter error is usually negligible, except in the faintest objects. When no feature is detected, the detection threshold is given by a total 2- upper limit in Table 3.
5 How old is NGC 2547 ?
An LDB location within the magnitude range we have analysed corresponds to an age range of 2050 Myr. We have detected lithium in a few cluster members but have we detected the LDB? The lithium abundance drops from undepleted to 99 per cent depleted in just over 0.2 mag, therefore we expect to find objects with either entirely depleted or undepleted Li abundances, with no (or very few) transition objects. Initially it would seem that we have not found a clear boundary in our dataset and so have not found the LDB in NGC 2547. There are several possibilities to explain this: i) the data were not of sufficient quality to detect the LDB; ii) we did not observe any cluster members; iii) the cluster is older than 50 Myr and our sample is not deep enough to detect the LDB. In this section we discuss the limits of our spectroscopic sample, try to constrain the cluster (LDB and low-mass isochronal) age and compare with IC 2391, a cluster previously thought to be Myr older than NGC 2547 (Jeffries & Tolley, 1998).
5.1 How faint can we detect the Li feature?

The total EW errors are plotted versus in Fig. 4. The scatter in the relationship is largely due to variations in fiber transmission efficiency. If we expect Li-undepleted stars to have EWs of around 0.6 Å (e.g. Zapatero Osorio et al. 2002), then we judge that we are capable of detecting (at 3-sigma confidence) individual Li-rich objects to mag for the majority of targets and a population of Li-rich objects (at a lower individual significance of say 2-sigma) to mag. Thus, providing our sample is not very heavily contaminated by cluster non-members down to these magnitudes we should have been capable of detecting the LDB.
5.2 Have we observed cluster members?
A first point to make is that it is extremely unlikely that we have “missed” the NGC 2547 PMS. A glance at Fig. 7 shows that even though we assumed an age of 2050 Myr in making our candidate selection on the CMDs, the isochrones are so closely packed together compared with the width of the selection area that no plausible error in our assumed age would allow the PMS to fall outside this area.
Another important consideration is at what level is our sample contaminated by cluster non-members? By using two colour-magnitude diagrams to select pre-main-sequence objects and by further refining that sample by analysing their spectral indices, we have removed background giants and other anomalously reddened objects. However our final sample can still contain field M dwarfs that are basically indistinguishable from cluster members on the basis of their colours and spectral indices. As we expect almost all of these to have completely depleted their lithium, it is relevant to estimate the contaminant numbers.
As the field-of-view towards the cluster is largely unobscured we ignore the effects of reddening. We adopt the model of Ortiz & Lépine (1993) that describes star counts at red and infrared wavelengths in the solar neighbourhood. For late spectral types, the dominant component is the so-called “thick disk” component characterised by a scale height of 390 pc (i.e. the old disk population). Taking into account the galactic latitude of NGC 2547 ( 9) we can estimate the stellar density for each spectral type. Leggett (1992) and Leggett et al. (1996) list typical and M for each spectral type. From the colour-magnitude diagram we estimate the distance range over which a M-dwarf with a given (spectral type) would appear to populate the parallelogram in Fig. 1. Then, given the effective angular extent for our spectroscopic survey (recall that we only observed between 40 and 65 per cent of “eligible” targets – Sect. 3.2) and assuming the spectroscopic targets are spread evenly over this area (see below), this defines a contaminating volume that together with the stellar density allows us to compute the number of contaminants.
We estimate the level of contamination to be 20, 30 and 10 per cent respectively for spectral types M3, M4 and M5 (the largest contaminating volume occurs for spectral type M4). Our targets show some concentration towards the cluster centre, as expected given the small 0.2 half-mass cluster radius. In addition, Fig. 1 shows that our targets are concentrated towards the centres of the parallelogram selection domains, whereas foreground contaminants would tend to be concentrated towards the fainter edge at a given colour. Given this, it is likely that these contamination numbers (calculated assuming a uniform target distribution) are overestimates. However, to be absolutely conservative, we assume a uniform contamination of 30 per cent across the sample spectral type range. Thus the majority of the spectroscopically selected cluster candidates should indeed be cluster members and contamination by field M dwarfs should not greatly impair our ability to detect the LDB.

5.3 The location of the LDB
Fig. 5 shows the colour-magnitude diagram of the cluster candidates. The filled symbols represent lithium-rich objects and grey symbols are the more marginal detections. The dashed lines are isochrones of 99 per cent lithium depletion, based on the Chabrier & Baraffe (1997) models and described in the next section. We have adopted a conservative distance modulus of = 8.15 and reddening = 0.04 (Naylor et al., 2002). We divide the discussion of lithium detection and the location of the LDB into -magnitude bands: 17.2 mag; 17.2 17.8 mag and 17.8 18.3 mag.
There are two objects at with detected lithium (Fig. 3). We have plenty of good quality spectra for fainter objects and with only an estimated 30 per cent contamination, we can safely say that the LDB is not at 17.2 mag. What are these lithium-rich objects? A few such objects, brighter than the LDB and lithium-rich, have also been found in comparable samples in the Pleiades (Oppenheimer et al., 1997) and IC 2391 (Barrado y Navascués & Stauffer, 2003). It has been suggested that such objects might belong to a later burst of star formation or might not have formed in these clusters, but no convincing explanation is available. Both objects in NGC 2547 could be binary systems, based on their position in the colour-magnitude diagram, but could also be isolated very young ( Myr) stars unassociated with NGC 2547.
At mag there is a lithium-rich object and a few tentative detections. Again, based on the fact that there are good quality spectra to magnitudes as faint as 17.8 mag and that none of those objects shows a convincing lithium detection, we are inclined to believe that we are not seeing the LDB at 17.2 mag. Taking into account that if present the lithium feature should be strong (EW Å), then the tentative detections are not at all convincing. The definite lithium-rich object could be a binary system, in which case the true LDB could be up to 0.75 mag fainter, although its position in the colour-magnitude diagram suggests 0.3-0.5 mag fainter might be more plausible. Taking into account the sensitivity of our spectra we thus believe the LDB for NGC 2547 is not at 17.8 mag.
Most of the spectra of objects with 17.8 mag are of rather poor quality, with the exception of the Li-rich object with mag in Fig. 3. Thus individually these noisy spectra do not allow us to locate the LDB. But, given our relatively low estimate of the contamination by non-members, combining these low signal-to-noise spectra seems a reasonable step to take.

In Fig. 6 we have plotted the weighted average spectra of the objects in the magnitude bins 17.3 17.8 mag (top graph) and 17.8 mag (bottom graph). We have excluded the two objects with probable or possible lithium detections from these averages. In the brighter average spectrum the lithium feature is definitely not present (EW Å at 2-sigma confidence). The average spectrum of the fainter objects (bottom graph) does show a lithium feature with EW Å – precisely what we would expect if the fainter sample consists of two thirds of stars with an undepleted Li EW of about 0.6 Å and one third of stars (contaminants) with no Li feature at all. This points to the LDB being located somewhere between .
As the SNR of the spectra is not high, we made a separate test of our uncertainty estimates and ability to detect Li features; we examined all 94 candidate member spectra in a wavelength region (67406780 Å) where no atomic lines are identifiable and where the molecular bands have similar shape and strength as in the vicinity of the Li i 6708 Å feature. On average we found 1 detected “line” per 4 Å interval (the interval over which we would allow a possible feature to be identified with Li at 6708 Å) at the the 2 to 3- level with EWs of 0.30.4 Å, which is just what one would expect from 94 trials. Comparing these statistics with Table 1 it seems likely that all of the positive detections are real, but one or two of the more marginal detections could be spurious. The numbers of spurious features detected in our test, together with their measured EWs and uncertainties, lends support to our estimates of the significance and strength of the Li features in our targets.
5.4 The age of NGC 2547
5.4.1 The LDB age of NGC 2547
We assume here that the LDB corresponds to the brightest star whose lithium abundance has been 99 per cent depleted from its original value. The (absolute) Ic-band magnitude of the LDB can be converted to a cluster age with the help of evolutionary models. One can use theoretical evolutionary models that incorporate model atmospheres as appropriate boundary conditions and also predict the magnitudes and colours for low-mass objects. These directly yield the Ic-band magnitude of the LDB at a given age (e.g. Baraffe et al. 1998; Stauffer et al. 1998). However, this is the only set of models that produces such self-consistent magnitudes and colours. Alternatively, Jeffries & Naylor (2001b) and Stauffer et al. (1999) use the observed -magnitude and colour of the LDB together with an empirical bolometric correction-colour relation from Leggett et al. (1996) to compute the bolometric luminosity of the LDB. This approach does not use effective temperature-colour relationships or bolometric corrections provided by models. Using any evolutionary model, the LDB luminosity is then converted to an age. This method allows us to perform the same analysis using several different evolutionary models and quantitatively compare the results (see Table 2). However, for the record, we find that for NGC 2547, the ages determined by either method are perfectly consistent. The LDB isochrones (dotted lines) in Figs. 5 and 7 were computed following the latter procedure, using the evolutionary models of Chabrier & Baraffe (1997).
We have calculated the LDB age assuming that the boundary lies between with a corresponding colour of . We adopt and an intrinsic distance modulus of 8.15. The luminosity at the LDB was then used to estimate the cluster age using the models of Chabrier & Baraffe (1997), D’Antona & Mazzitelli (1997) and Siess et al. (2000, using both Z =0.02 and Z =0.01 models). The results are presented in Table 2 and are very similar for the differing models. To estimate the uncertainties we assume that the location of the LDB is in error (due to systematic uncertainties in the photometric calibration) by in colour and magnitude. The effects of uncertainties in the reddening and bolometric correction-colour relation will be minor in comparison (see Jeffries & Naylor 2001b). There is a further uncertainty associated with the adopted distance. We have used the largest probable distance modulus found by Naylor et al. (2002). In fact the distance modulus could be as low as 8.0, or perhaps even a little lower if NGC 2547 has a significantly sub-solar metallicity. Using a distance modulus of 8.0 would add about 3 Myr to all the ages in Table 2. Thus the LDB age for NGC 2547 is at least 35 Myr (D’Antona & Mazzitelli models) but probably less than 54 Myr (Siess et al. model, distance modulus of 8.0).
| Chabrier & Baraffe | D’Antona & Mazzitelli | Siess et al. | Siess et al. | ||
| LDB age (Myr) | |||||
| 17.8 | 1.8 | ||||
| 18.3 | 1.9 | ||||
| Isochronal age (Myr) | |||||


5.4.2 The isochronal age of NGC 2547 and comparison with IC 2391
In the and colour-magnitude diagrams in Fig. 7, we compare the NGC 2547 sample (filled circles) with members of IC 2391 (empty circles, from Barrado y Navascués et al. 2001; Simon & Patten 1998; Patten & Simon 1996), thought to be Myr older than NGC 2547 (we assume = 5.95 and = 0.06 for IC 2391).
We try to determine the ages of these clusters by using low-mass PMS isochrones. For NGC 2547 Naylor et al. (2002) used the evolutionary models of D’Antona & Mazzitelli (1997) and Siess et al. (2000, – the models). They found an age of 25 5 Myr and intrinsic distance modulus of 8.008.15 from the D’Antona & Mazzitelli models and corresponding values of 30 5 Myr for the Siess et al. models. We have repeated the analysis in Naylor et al. using the models of Baraffe et al. (1998, 2002) which feature a convective mixing length of 1.9 times the pressure scale height. The optical colours predicted by these models are known to be inaccurate (see Baraffe et al. 1998), so we adopt a empirical calibration procedure (described in detail by Jeffries et al. 2001a; Naylor et al. 2002) to convert from bolometric luminosities and effective temperatures to magnitudes and colours. Briefly, we assume that the Pleiades has an intrinsic distance modulus of 5.6 and age of 120 Myr (Stauffer et al., 1998). Pleiades photometry is then used along with a bolometric correction-colour relation to define a colour-effective temperature relation that can then be used to produce an isochrone at any age where the same colour-effective temperature relation is assumed to apply.
The solid lines in Fig. 7 show the results of this procedure. As we believe that photometric calibrations might be significantly affected by systematic errors (Section 3.1) for stars with mag (i.e. most of the faint sample), we attach most weight to the brighter stars ( mag) and the magnitudes to estimate the absolute cluster age. For an intrinsic distance modulus of 8.15, an age of Myr is indicated for NGC 2547. IC 2391 appears to be a little older in both diagrams, perhaps by 510 Myr, but after taking into account the likely distance uncertainties this difference is not very significant.
The reader might question the empirical calibration based upon Pleiades photometry, because we are forced to assume a distance and age for the Pleiades. In fact, our results are quite robust to these assumptions. We have generated model isochrones using the more recent (but disputed – see Pinsonneault et al. 1998) Hipparcos-measured distance modulus of 5.36 (Robichon et al., 2000); using a Pleiades age of 150 Myr – which is the LDB age that would be derived if the Hipparcos distance is adopted (Jeffries & Naylor, 2001b); and simultaneously adopting both of the latter changes. We find that changing the age of the Pleiades by 30 Myr has no significant effect on our derived isochronal ages simply because 120 Myr old stars are already almost on the ZAMS for stars at the relevant colours. Changing the distance of the Pleiades simply changes the distance we find for NGC 2547 by a similar amount. Thus, if we accept the Hipparcos parallax distance to the Pleiades, then the distance modulus of NGC 2547 is , the isochronal ages are unchanged, but the LDB ages reported in Table 2 would be older by a further Myr.
Finally we have independently checked our results by adopting an empirical relationship between and effective temperature found by fitting data from Bessell (1979) and Leggett et al. (1996). We find that the low-mass isochronal age for NGC 2547 would be reduced by about 5 Myr for all the models we have considered, but the distances are unchanged.
6 Discussion
The main finding of this paper is that while the LDB age of NGC 2547 lies between 3554 Myr and is formally consistent with the (rather uncertain) nuclear turn-off age of Myr, the age found from fitting low-mass isochrones, using the same evolutionary models is lower – in the range 2035 Myr. This discrepancy is even more significant than it might first appear because: (i) the evolutionary models that give the youngest LDB age also give the youngest isochronal age; (ii) the conservative distance modulus assumed to obtain the LDB ages is larger than the distances required to fit the isochrones and thus the LDB ages should probably be increased by a few Myr.
The same appears to be true for IC 2391. Barrado y Navascués et al. (2001) find an LDB age of Myr. Using the models and techniques presented in this paper (but Barrado y Navascués et al.’s estimate of the magnitude and colour of the LDB), we would estimate an LDB age of 4850 Myr, with a Myr uncertainty due to the LDB placement and systematic errors in the photometric calibrations. The low-mass isochronal age is not quite so easy to determine as for NGC 2547, possibly because the available photometry is less precise, but we estimate 2540 Myr using the same distance and range of evolutionary models.
Could the discrepancy between isochronal and LDB ages, assuming a universal -colour relationship, mean that there are systematic problems in the current generation of low-mass evolution models? Or, could the -colour relationship change sufficiently with gravity between 30 and 120 Myr to increase the isochronal ages of the low-mass stars?
We think the latter possibility unlikely, simply because the gravities of the stars which define the low-mass isochronal ages (stars with masses of approximately 0.3-1.5 ) do not change significantly between 30 and 120 Myr. The atmospheric models of Baraffe et al. (1998) suggest that any age dependence of the -colour relationship is indeed very small. However, the optical colours, particularly and , in these models are still not capable of reproducing the observed colour-magnitude diagrams of young clusters, probably due to missing sources of opacity in the optical region. There is presently insufficient published near IR data in NGC 2547 to do a similar test in a spectral region where the model colours are likely to be more realistic. However, the available data for IC 2391 yields an identical LDB age but spectroscopically confirmed members of IC 2391 also clearly lie above a 50 Myr isochrone (and therefore at younger ages) in the diagram (see Barrado y Navascués & Stauffer 2003).
We are then left contemplating what physical ingredients may need altering in the PMS models which might bring the LDB and isochronal ages into agreement. The different evolutionary models considered in this paper already cover a wide variety of treatments of convection, equations of state and atmospheric structure in low-mass stars. None of these seems capable on their own of closing the discrepancy we have identified; in particular, the LDB age is very robust to changes of detailed model physics. Perhaps then the answer is that something is missing from the models entirely. Two possibilities are rotation and dynamo-generated magnetic fields, both of which are expected to be present in young stars.
Investigation of these factors on the LDB ages are still at a preliminary stage. Intuitively we would expect that rotation and magnetic fields provide additional pressure terms, decreasing the core temperature and delaying the onset of Li burning. This is borne out by preliminary calculations. Rapid rotation may increase the LDB ages by 2025 per cent at 120 Myr, but by only 13 Myr at 30 Myr (Burke & Pinsonneault, 2000). D’Antona (private communication) finds that the lowering of the core temperature thanks to the extra support provided by a plausible magnetic field also increases the LDB age. These effects would seem to be the opposite of what we require, but it is possible that these physical changes could simultaneously provide a bigger increase in the derived isochronal ages because the effective temperatures are also altered.
Pinsonneault et al. (1998) have shown that rapid rotators lie up to 0.1 mag above a isochrone defined by the slower rotators in the Pleiades and Per open clusters. If almost all the low-mass stars in NGC 2547 are fast rotators this might mean the low-mass isochronal ages were underestimated, but only by 5 Myr. The magnetic field hypothesis may hold more promise. The effect in the Hertzsprung-Russell diagram is to move a star of a given mass and age to significantly cooler temperatures at roughly constant luminosity – making them appear much younger when interpreted with models featuring no magnetic field (D’Antona et al., 2000).
If either rotation or magnetic fields can reconcile the LDB and isochronal ages, the implication is that the cluster age scale becomes even older than suggested from the present group of LDB ages, i.e. even more discrepant with nuclear turn off ages from models featuring no convective core overshoot.
Further clues may arise from PMS associations where there are independent kinematic age indicators. Song et al. (2002) have found that while the lower-mass component of a recently discovered PMS binary system (GJ 871.1B) exhibited Li, the higher mass component (GJ 871.1A) did not. They deduced that if the lower mass component was at or beyond the LDB, the system would have an age Myr (we find Myr based on the procedures and range of models described in this paper). However, using assumed colour-effective temperature relations, bolometric corrections (derived for old disk M dwarfs) and a Hipparcos parallax, they find the isochronal age of the system is 10 Myr. Furthermore Song et al. claim that this binary may be a member of the Pictoris moving group which has both a low-mass isochronal age and kinematic expansion age of Myr. If this were the case (and we note that expansion ages measure the time since an association became unbound and therefore are lower limits to the true age), then any scope for increasing the isochronal or LDB ages is severely limited and a way must be found to increase the rate at which Li is burned in very low mass stars.
7 Summary
We have obtained intermediate resolution 2dF spectra of many candidate low-mass members of NGC 2547. We have refined our sample to select 94 objects with and ) colours and narrowband spectroscopic indices that are consistent with cluster membership. Our goal was use the Li i feature as an age indicator, by detecting the lithium depletion boundary of this cluster. We were not able to conclusively find the position of such a boundary in the diagram, however the lack of a population of individual Li-rich objects towards the faint end of our sample places a very strong lower limit to the cluster age of 35 Myr. The detection of Li in the averaged spectra of our faintest objects, together with the expected low-levels of contamination by non-members, lead us to believe that the LDB actually lies at and hence an upper limit to the LDB age of 54 Myr.
The age of NGC 2547 judged from isochrones in the and colour-magnitude diagrams is between 20 and 35 Myr using the same evolutionary models from which the LDB ages were determined. The sense and size of this discrepancy between the LDB and low-mass isochronal ages is similar to that seen in another young cluster, IC 2391 and in the low-mass PMS binary system GJ 871.1AB. We suggest that inclusion of rotation or internal magnetic fields in PMS evolutionary models may be able to reconcile the two age determinations, at the expense of increasing the ages to values even higher than the LDB ages presently indicate. Alternatively, some mechanism must be identified which can increase the rate of Li depletion among young, very low-mass fully convective PMS stars.
| J2000 Position | Ic-band | ) | ) | Li | ||||||
|---|---|---|---|---|---|---|---|---|---|---|
| ra | dec | mag | error | mag | error | mag | error | flag | (Å) | |
| 1 | 8 09 49.46 | 49 16 19.0 | 15.681 | 0.004 | 1.762 | 0.005 | 0.467 | 0.005 | M | 0.14 |
| 2 | 8 10 48.36 | 49 15 25.1 | 15.712 | 0.003 | 1.490 | 0.004 | 0.377 | 0.003 | M | 0.09 |
| 3 | 8 09 13.92 | 49 13 18.8 | 15.736 | 0.008 | 1.429 | 0.016 | 0.400 | 0.009 | M | 0.10 |
| 4 | 8 10 32.59 | 49 09 43.8 | 15.760 | 0.004 | 1.366 | 0.005 | 0.345 | 0.005 | M | 0.08 |
| 5 | 8 10 57.20 | 49 23 47.9 | 15.804 | 0.003 | 1.702 | 0.004 | 0.461 | 0.004 | M | 0.09 |
| 6 | 8 10 59.43 | 49 08 33.1 | 15.830 | 0.007 | 1.474 | 0.013 | 0.418 | 0.008 | M | 0.12 |
| 7 | 8 09 54.29 | 49 08 41.9 | 15.841 | 0.008 | 1.484 | 0.008 | 0.379 | 0.009 | M | 0.13 |
| 8 | 8 10 01.44 | 48 56 21.9 | 15.911 | 0.004 | 1.283 | 0.005 | 0.394 | 0.004 | M | 0.11 |
| 9 | 8 12 56.77 | 49 11 22.5 | 15.922 | 0.005 | 1.310 | 0.005 | 0.341 | 0.005 | M | 0.11 |
| 10 | 8 10 35.82 | 49 20 05.6 | 15.922 | 0.003 | 1.495 | 0.005 | 0.371 | 0.004 | M | 0.08 |
| 11 | 8 10 27.41 | 49 20 19.9 | 15.948 | 0.003 | 1.525 | 0.005 | 0.386 | 0.004 | M | 0.10 |
| 12 | 8 09 00.42 | 49 12 59.6 | 16.002 | 0.009 | 1.556 | 0.021 | 0.454 | 0.010 | M | 0.10 |
| 13 | 8 08 53.44 | 49 13 26.8 | 16.029 | 0.009 | 1.564 | 0.021 | 0.444 | 0.011 | M | 0.15 |
| 14 | 8 10 07.08 | 49 12 59.9 | 16.032 | 0.005 | 1.529 | 0.006 | 0.410 | 0.006 | M | 0.10 |
| 15 | 8 10 18.40 | 49 26 31.3 | 16.042 | 0.003 | 1.709 | 0.005 | 0.472 | 0.004 | M | 0.12 |
| 16 | 8 10 13.80 | 49 18 37.0 | 16.050 | 0.003 | 1.539 | 0.004 | 0.397 | 0.004 | M | 0.15 |
| 17 | 8 12 56.81 | 49 01 37.3 | 16.079 | 0.003 | 1.463 | 0.004 | 0.405 | 0.004 | M | 0.11 |
| 18 | 8 10 42.49 | 49 24 55.4 | 16.149 | 0.003 | 1.714 | 0.005 | 0.467 | 0.003 | M | 0.12 |
| 19 | 8 09 21.90 | 49 11 35.2 | 16.170 | 0.010 | 1.639 | 0.025 | 0.460 | 0.012 | M | 0.10 |
| 20 | 8 10 50.13 | 49 22 47.7 | 16.196 | 0.003 | 1.618 | 0.004 | 0.449 | 0.003 | M | 0.16 |
| 21 | 8 10 06.17 | 49 25 59.0 | 16.199 | 0.004 | 1.700 | 0.006 | 0.452 | 0.004 | M | 0.14 |
| 22 | 8 11 16.67 | 49 22 29.2 | 16.245 | 0.004 | 1.595 | 0.005 | 0.419 | 0.005 | M | 0.64 |
| 23 | 8 12 03.84 | 49 12 04.7 | 16.248 | 0.006 | 1.627 | 0.007 | 0.426 | 0.006 | M | 0.13 |
| 24 | 8 08 58.56 | 49 11 17.3 | 16.313 | 0.011 | 1.599 | 0.027 | 0.434 | 0.013 | M | 0.14 |
| 25 | 8 11 09.33 | 49 11 53.6 | 16.316 | 0.006 | 1.641 | 0.007 | 0.450 | 0.006 | M | 0.20 |
| 27 | 8 08 54.64 | 49 27 03.5 | 16.329 | 0.004 | 1.635 | 0.006 | 0.446 | 0.005 | M | 0.14 |
| 28 | 8 12 11.63 | 49 12 36.2 | 16.332 | 0.006 | 1.720 | 0.010 | 0.504 | 0.009 | M | 0.21 |
| 29 | 8 10 36.75 | 48 58 39.1 | 16.345 | 0.003 | 1.659 | 0.004 | 0.443 | 0.004 | M | 0.40 |
| 30 | 8 10 00.84 | 49 09 10.0 | 16.349 | 0.006 | 1.756 | 0.008 | 0.497 | 0.007 | M | 0.15 |
| 31 | 8 08 11.66 | 49 09 16.6 | 16.352 | 0.003 | 1.637 | 0.005 | 0.419 | 0.004 | M | 0.19 |
| 32 | 8 09 06.82 | 49 15 34.9 | 16.367 | 0.007 | 1.662 | 0.010 | 0.478 | 0.007 | M | 0.15 |
| 33 | 8 09 25.74 | 49 03 15.7 | 16.374 | 0.010 | 1.590 | 0.017 | 0.447 | 0.011 | M | 0.14 |
| 34 | 8 09 37.17 | 49 05 59.6 | 16.397 | 0.005 | 1.562 | 0.008 | 0.411 | 0.006 | M | 0.12 |
| 35 | 8 09 11.71 | 48 57 38.6 | 16.439 | 0.005 | 1.568 | 0.007 | 0.407 | 0.004 | M | 0.12 |
| 36 | 8 07 47.51 | 49 11 09.5 | 16.448 | 0.004 | 1.805 | 0.007 | 0.519 | 0.005 | M | 0.33 |
| 37 | 8 11 14.31 | 49 10 24.6 | 16.475 | 0.006 | 1.436 | 0.007 | 0.371 | 0.007 | M | 0.12 |
| 39 | 8 10 07.81 | 49 01 06.4 | 16.498 | 0.010 | 1.510 | 0.015 | 0.371 | 0.011 | M | 0.17 |
| 40 | 8 11 31.92 | 49 11 53.0 | 16.500 | 0.011 | 1.712 | 0.024 | 0.518 | 0.011 | M | 0.15 |
| 41 | 8 09 17.72 | 49 08 34.6 | 16.525 | 0.004 | 1.751 | 0.006 | 0.482 | 0.005 | M | 0.17 |
| 42 | 8 10 50.49 | 49 16 24.0 | 16.538 | 0.005 | 1.604 | 0.006 | 0.441 | 0.005 | M | 0.23 |
| 43 | 8 09 33.92 | 49 38 45.4 | 16.562 | 0.004 | 1.797 | 0.008 | 0.483 | 0.004 | M | 0.24 |
| 44 | 8 09 29.04 | 49 14 33.0 | 16.627 | 0.013 | 1.648 | 0.027 | 0.465 | 0.015 | M | 0.13 |
| 45 | 8 10 21.87 | 49 00 07.0 | 16.666 | 0.006 | 1.649 | 0.009 | 0.438 | 0.007 | M | 0.22 |
| 46 | 8 10 11.76 | 49 21 01.9 | 16.670 | 0.011 | 1.918 | 0.021 | 0.615 | 0.011 | M | 0.23 |
| 47 | 8 08 51.49 | 49 12 58.9 | 16.680 | 0.015 | 1.486 | 0.035 | 0.425 | 0.017 | M | 0.15 |
| 48 | 8 09 12.08 | 49 10 15.4 | 16.747 | 0.015 | 1.531 | 0.037 | 0.453 | 0.017 | M | 0.12 |
| 49 | 8 10 10.41 | 48 58 05.4 | 16.748 | 0.004 | 1.687 | 0.006 | 0.465 | 0.005 | M | 0.20 |
| 50 | 8 09 35.49 | 49 13 03.3 | 16.748 | 0.010 | 1.732 | 0.016 | 0.541 | 0.015 | M | 0.16 |
| 51 | 8 09 01.74 | 49 01 10.7 | 16.788 | 0.013 | 1.623 | 0.023 | 0.456 | 0.014 | M | 0.39 |
| 52 | 8 10 12.13 | 49 04 31.7 | 16.862 | 0.007 | 1.699 | 0.011 | 0.456 | 0.008 | M | 0.22 |
| 53 | 8 10 59.18 | 49 04 27.9 | 16.899 | 0.005 | 1.833 | 0.008 | 0.536 | 0.006 | M | 0.35 |
| 54 | 8 10 25.35 | 49 11 18.6 | 16.911 | 0.006 | 1.858 | 0.009 | 0.542 | 0.007 | NM | 0.52 |
| 55 | 8 10 23.69 | 48 59 35.5 | 16.925 | 0.007 | 1.659 | 0.011 | 0.465 | 0.008 | M | 0.23 |
| 56 | 8 10 02.44 | 49 05 13.3 | 16.938 | 0.007 | 1.640 | 0.011 | 0.442 | 0.008 | M | 0.19 |
| 57 | 8 11 31.07 | 49 14 10.6 | 16.948 | 0.009 | 1.618 | 0.011 | 0.447 | 0.009 | NM | 0.35 |
| 58 | 8 09 11.92 | 49 14 43.0 | 16.965 | 0.010 | 1.727 | 0.016 | 0.465 | 0.011 | NM | 0.24 |
| 59 | 8 11 39.94 | 49 03 25.9 | 16.977 | 0.005 | 1.707 | 0.008 | 0.489 | 0.007 | M | 0.24 |
| 60 | 8 10 49.78 | 49 08 19.9 | 16.977 | 0.004 | 1.699 | 0.006 | 0.476 | 0.005 | M | 0.23 |
Objects with no detected Li feature. Columns 110 as in Table 1. Column 11 gives the estimated 2 upper limits. J2000 Position Ic-band ) ) Li ra dec mag error mag error mag error flag (Å) 61 8 09 09.26 49 20 42.7 16.989 0.006 1.638 0.008 0.470 0.007 M 0.38 62 8 08 38.74 49 12 49.1 17.018 0.005 1.811 0.009 0.477 0.007 M 0.24 63 8 08 20.49 49 04 54.7 17.069 0.007 1.730 0.011 0.450 0.008 M 0.52 64 8 08 44.32 49 20 12.5 17.102 0.007 1.699 0.010 0.491 0.008 M 0.23 66 8 10 17.67 49 23 29.7 17.157 0.006 1.624 0.011 0.429 0.008 M 0.24 68 8 10 46.82 49 03 47.8 17.179 0.005 1.743 0.008 0.497 0.006 M 0.31 69 8 11 16.74 49 06 56.7 17.183 0.005 1.683 0.007 0.480 0.006 M 0.23 70 8 07 41.00 49 19 07.8 17.187 0.005 1.600 0.007 0.414 0.006 M 1.10 71 8 10 04.60 49 11 39.0 17.192 0.011 1.753 0.015 0.494 0.013 M 0.23 73 8 10 46.88 49 21 34.1 17.211 0.005 1.876 0.009 0.586 0.006 M 0.53 74 8 12 04.66 49 02 17.6 17.219 0.006 1.704 0.010 0.513 0.008 M 0.40 76 8 10 12.75 49 01 49.8 17.255 0.017 1.825 0.030 0.566 0.017 M 0.23 77 8 10 23.18 49 04 04.2 17.265 0.017 1.763 0.031 0.472 0.018 NM 0.68 78 8 10 43.13 48 56 47.7 17.360 0.004 1.943 0.008 0.623 0.005 NM 1.48 79 8 08 17.93 49 04 17.7 17.405 0.018 1.728 0.030 0.489 0.019 M 0.44 80 8 10 46.81 49 27 45.5 17.412 0.004 1.769 0.007 0.488 0.005 M 0.38 81 8 11 03.97 49 10 01.9 17.472 0.012 1.712 0.016 0.485 0.013 NM 0.20 82 8 08 54.09 49 21 04.8 17.509 0.009 1.754 0.013 0.516 0.010 M 0.33 83 8 09 53.33 48 55 37.7 17.511 0.010 1.796 0.013 0.508 0.011 M 0.36 84 8 11 32.41 48 58 51.2 17.527 0.006 1.779 0.009 0.498 0.006 M 0.34 85 8 10 12.07 49 17 41.4 17.541 0.008 1.719 0.012 0.526 0.009 NM 0.22 86 8 07 29.69 49 02 03.0 17.599 0.010 1.809 0.018 0.496 0.011 M 0.45 87 8 09 12.40 49 22 28.0 17.639 0.009 1.675 0.014 0.438 0.011 M 0.28 88 8 09 33.84 49 30 32.6 17.658 0.007 1.949 0.012 0.607 0.008 M 0.40 89 8 10 16.48 49 03 36.6 17.672 0.012 1.866 0.022 0.564 0.014 M 0.37 90 8 08 58.32 49 30 09.2 17.710 0.007 1.987 0.012 0.594 0.008 M 0.64 92 8 10 57.64 49 19 58.1 17.808 0.012 1.808 0.022 0.510 0.015 NM 0.30 93 8 08 36.32 49 19 06.3 17.822 0.009 1.705 0.016 0.496 0.010 NM 0.43 94 8 10 41.23 49 12 22.1 17.850 0.016 1.761 0.023 0.567 0.016 NM 0.21 95 8 12 10.01 49 05 20.9 17.917 0.010 1.964 0.019 0.608 0.012 M 1.30 96 8 11 25.29 49 26 35.4 17.925 0.012 1.844 0.019 0.487 0.014 M 0.35 97 8 09 44.64 49 28 57.6 17.980 0.006 1.900 0.013 0.543 0.008 M 0.68 98 8 10 04.21 49 00 29.0 18.014 0.015 1.834 0.029 0.503 0.017 M 0.35 99 8 10 31.84 48 58 08.8 18.053 0.016 1.718 0.027 0.548 0.019 M 0.46 101 8 10 53.27 49 16 48.6 18.095 0.011 1.914 0.018 0.604 0.012 NM 0.76 102 8 09 42.58 49 04 39.6 18.143 0.012 1.736 0.022 0.482 0.013 NM 0.30 103 8 12 00.17 49 18 57.6 18.163 0.011 1.901 0.019 0.536 0.013 M 0.96 104 8 11 58.97 49 01 59.8 18.172 0.009 1.774 0.015 0.504 0.011 M 0.61 105 8 12 59.18 49 04 02.0 18.224 0.013 1.782 0.022 0.522 0.016 NM 0.88 106 8 09 08.08 49 21 59.6 18.233 0.014 1.885 0.023 0.590 0.016 NM 0.68 107 8 11 01.18 48 59 08.4 18.261 0.016 1.994 0.045 0.589 0.017 M 0.67 108 8 08 06.81 49 00 10.2 18.285 0.017 1.871 0.031 0.525 0.018 M 0.85 109 8 08 03.61 49 05 06.6 18.385 0.018 1.981 0.037 0.579 0.020 NM 1.19
Acknowledgements
We would like to thank: the director and staff of the Cerro Tololo Interamerican Observatory, operated by the Association of Universities for Research in Astronomy, Inc., under contract to the US National Science Foundation; the director and staff of the Anglo Australian Observatory and particularly Terry Bridges who assisted with the 2dF observations; Nigel Hambly for providing accurate astrometric positions for 2dF targets from the SuperCOSMOS sky survey. Computational work was performed on the Keele node of the PPARC funded Starlink network. JMO acknowledges support of the UK Particle Physics and Astronomy Research Council and CRD acknowledges the support of the Nuffield Foundation in the form of an undergraduate research bursary.
References
- Allen (1996) Allen L.E., 1996, Ph.D. thesis, Univ. Massachusetts
- Allen & Strom (1995) Allen L.E., Strom K.M., 1995, AJ, 109, 1379
- Baraffe et al. (1998) Baraffe I., Chabrier G., Allard F., Hauschildt P.H., 1998, A&A, 337, 403
- Baraffe et al. (2002) Baraffe I., Chabrier G., Allard F., Hauschildt P.H., 2002, A&A, 382, 563
- Barrado y Navascués & Stauffer (2003) Barrado y Navascués D., Stauffer J.R., 2003, IAU Symp. 211 on “Brown Dwarfs”, in ASP Conference Series, ed. E. Martín, in press
- Barrado y Navascués et al. (1999) Barrado y Navascués D., Stauffer J.R., Patten B.M., 1999, ApJ, 522, 53
- Barrado y Navascués et al. (2001) Barrado y Navascués D., Stauffer J.R., Briceño C. et al., 1999, ApJ, 522, 53
- Bessell (1979) Bessell M.S., 1979, PASP, 91, 589
- Bildsten et al. (1997) Bildsten L., Brown E.F., Matzner C.D., Ushomirsky G., 1997, ApJ, 482, 442
- Briceño et al. (1998) Briceño C., Hartmann L., Stauffer J., Martín E., 1998, AJ, 115, 2074
- Burke & Pinsonneault (2000) Burke C.J., Pinsonneault M.H., 2000, AAS abstract, 197, 41.10
- Chabrier & Baraffe (1997) Chabrier G., Baraffe I., 1997, A&A, 327, 1039
- Clariá (1982) Clariá J.J., 1982, A&AS, 47, 323
- D’Antona et al. (2000) D’Antona F., Ventura P., Mazzitelli I., 2000, ApJ, L77
- D’Antona & Mazzitelli (1997) D’Antona F., Mazzitelli I., 1997, Mem. Soc. Astr. It., 68, 807
- Hambly et al. (2001a) Hambly N.C., MacGillivray H.T., Read M.A. et al., 2001a, MNRAS, 326, 1279
- Hambly et al. (2001b) Hambly N.C., Davenhall A.C., Irwin M.J., MacGillivray H.T., 2001b, MNRAS, 326, 1315
- Jeffries & Tolley (1998) Jeffries R.D., Tolley A.J., 1998, MNRAS, 300, 331
- Jeffries et al. (2000a) Jeffries R.D., Totten E.J., James D.J., 2000a, MNRAS, 316, 950
- Jeffries et al. (2000b) Jeffries R.D., Totten E.J., Barrado y Navascués D., Stauffer J.R., Hambly N.C., 2000b, in “Stellar clusters and associations: Convection, rotation and dynamos”, ASP Conference Series, Vol. 198, eds. Pallavicini R., Micela G., San Francisco, p. 281
- Jeffries et al. (2001a) Jeffries R.D., Thurston M., Hambly N., 2001a, A&A, 375, 863
- Jeffries & Naylor (2001b) Jeffries R.D., Naylor T., 2001b, in “From Darkness to Light: Origin and Evolution of Young Stellar Clusters” ASP Conference Proceedings, Vol. 243, eds. T. Montmerle, Ph. Andre, p.633
- Jeffries et al. (2003) Jeffries R.D., Oliveira J.M., Barrado y Navascués D., Stauffer J.R., 2003, MNRAS, submitted
- Landolt (1992) Landolt A.U., 1992, AJ, 104, 340
- Leggett (1992) Leggett S.K., 1992, ApJS, 82, 351
- Leggett et al. (1996) Leggett S.K., Allard F., Berriman G. et al., 1996, ApJS, 104, 117
- Lewis et al. (2002) Lewis I.J., Cannon R.D., Taylor K. et al., 2002, MNRAS, 333, 279
- Littlefair et al. (2003) Littlefair S.P., Naylor T., Jeffries R.D., Devey C.R., 2003, MNRAS submitted
- Mazzei & Pigatto (1988) Mazzei P., Pigatto L., 1988, A&A, 193, 148
- Mermilliod (1981) Mermilliod J.C.,1981, A&A, 97, 235
- Meynet et al. (1993) Meynet G., Mermilliod J.C., Maeder A., 1993, A&AS, 98, 477
- Monet (1998) Monet D., 1998, BAAS, 30, 1427
- Montes et al. (1997) Montes D., Martín E.L., Fernández-Figueroa M.J., Cornide M., de Castro E., 1997, A&AS, 123, 473
- Naylor et al. (2002) Naylor T., Totten E.J., Jeffries R.D., Pozzo M., Devey C.R., Thompson S.A., 2002, MNRAS, 335, 291
- Oppenheimer et al. (1997) Oppenheimer B.R., Basri G., Nakajima T., Kulkarni S.R., 1997, AJ, 113, 296
- Ortiz & Lépine (1993) Ortiz R., Lépine J.R.D., 1993, A&A, 279, 90
- Patten & Simon (1996) Patten B.M., Simon T., 1996, ApJS, 106, 489
- Pavlenko & Magazzu (1995) Pavlenko Y.V., Magazzu A., 1996, A&A, 311, 961
- Pinsonneault et al. (1998) Pinsonneault M.H., Stauffer J.R., Soderblom D.R., King J.R., Hanson R.B., 1998, ApJ, 504, 170
- Randich et al. (2001) Randich S., Pallavicini R., Meola G., Stauffer J.R., Balachandran S.C., 2001, A&A, 372, 862
- Robichon et al. (2000) Robichon N., Arenou F., Mermilliod J.-C., Turon C., 2000, A&A, 345, 471
- Schaller et al. (1992) Schaller G., Schaerer D., Meynet G., Maeder A., 1992, A&AS, 96, 269
- Siess et al. (2000) Siess L., Dufour E., Forestini M., 2000, A&A, 358, 593
- Simon & Patten (1998) Simon T., Patten B.M., 1998, PASP, 110, 283
- Song et al. (2002) Song I., Bessell M.S., Zuckerman B., 2002, ApJ, 581, L43
- Stauffer et al. (1997) Stauffer J.R., Hartmann L.W., Prosser C.F. et al., 1997, ApJ, 479, 776
- Stauffer et al. (1998) Stauffer J.R., Schultz G., Kirkpatrick J.D., 1998, ApJ, 499, 199
- Stauffer et al. (1999) Stauffer J.R., Barrado y Navascués D., Bouvier J. et al., 1999, ApJ, 527, 219
- Ushomirsky et al. (1998) Ushomirsky G., Matzner C.D., Brown E.F. et al., 1998, ApJ, 497, 253
- Ventura et al. (1998) Ventura P., Zeppieri A., Mazzitelli I., D’Antona F., 1998, A&A, 334, 953
- Zapatero Osorio et al. (1999) Zapatero Osorio M.R., Rebolo R., Martín E.L. et al., 1999, A&AS, 134, 537
- Zapatero Osorio et al. (2002) Zapatero Osorio M.R., Béjar V.J.S., Pavlenko Ya. et al., A&A, 384 937