Radio Polarization of the Young High-Magnetic-Field Pulsar PSR J11196127
Abstract
We have investigated the radio polarization properties of PSR J11196127, a recently discovered young radio pulsar with a large magnetic field. Using pulsar-gated radio imaging data taken at a center frequency of 2496 MHz with the Australia Telescope Compact Array, we have determined a rotation measure for the pulsar of rad m-2. These data, combined with archival polarimetry data taken at a center frequency of 1366 MHz with the Parkes telescope, were used to determine the polarization characteristics of PSR J11196127 at both frequencies. The pulsar has a fractional linear polarization of 75% and 55% at 1366 and 2496 MHz, respectively, and the profile consists of a single, wide component. This pulse morphology and high degree of linear polarization are in agreement with previously noticed trends for young pulsars (e.g., PSR J15135908). A rotating-vector (RV) model fit of the position angle (PA) of linear polarization over pulse phase using the Parkes data suggests that the radio emission comes from the leading edge of a conal beam. We discuss PSR J11196127 in the context of a recent theoretical model of pulsar spin-down which can in principle be tested with polarization and timing data from this pulsar. Geometric constraints from the RV fit are currently insufficient to test this model with statistical significance, but additional data may allow such a test in the future.
1 Introduction
Pulsar polarimetry is one of the keys to understanding the process and geometry of radio emission from pulsars. In the rotating-vector (RV) model (Radhakrishnan & Cooke, 1969) the polarization of pulsar radio emission is linked to the emission geometry in such a way that as the pulsar rotates, the axis of linear polarization is aligned with the projected direction on the sky of the pulsar’s magnetic dipole axis. The pulsar’s emission geometry itself may be described by two angles, each measured from the pulsar’s angular momentum vector: the magnetic inclination angle is the angle between the spin axis and the magnetic dipole axis, and the angle measures the separation between the spin axis and an observer’s line of sight. Given this geometric description, the RV model defines the linear polarization position angle (PA) as a function of pulse phase according to
| (1) |
where is the PA corresponding to the projected direction of the pulsar’s rotation axis on the sky, and is the pulse phase at which the PA swings most rapidly, corresponding to the magnetic axis sweeping past the line of sight. PA is measured from North to East on the sky, following the usual convention (e.g., Everett & Weisberg 2001). A more observationally useful replacement for is the impact parameter , defined as the smallest angle between the magnetic axis and the line of sight as the dipole rotates, (Everett & Weisberg, 2001). A small value of corresponds to a steep PA swing as the magnetic axis sweeps past the line of sight.
With sufficient coverage over pulse phase, a fit for RV model parameters , , , and may be performed. Since is the phase corresponding to the center of the magnetic pole, the fit determines the geometry not only of the pulsar itself, but of the pulsar’s regions of radio emission, which can lie at various positions relative to the pulsar’s magnetic axis. Emission at the magnetic axis is not always present, and emission may not be symmetrical about the axis, in some cases giving rise to one or more pulses that lead or trail the beam center (Lyne & Manchester, 1988).
One possible geometric interpretation of the phenomenology of pulsar polarization profiles is that emission can come from either core or conal beams. While a core beam is a narrow, solid cone of radio emission extending outward along the pulsar’s magnetic dipole axis, a conal beam is in the form of a larger, hollow cone that circumscribes the core beam. In this interpretation, conal emission tends to have a steeper spectral index and a higher degree of linear polarization than core emission (Lyne & Manchester, 1988). While Rankin (1983) has proposed that core and conal components arise from differing emission mechanisms, Lyne & Manchester (1988) contend that there is a continuous variation in radiation properties between core and cone, and that all radio beam emission shares the same mechanism. Lyne & Manchester (1988) also suggest that emission beam patterns may be “patchy,” such that only one side of an ideal hollow cone beam might be active.
A model of pulsar spin-down proposed by Melatos (1997) connects pulsar timing with geometry such that its predictions may be tested through observation. The model treats the pulsar and its inner magnetosphere as a single perfectly conducting sphere rotating in a vacuum. The model thus differs from the standard vacuum-dipole theory of pulsar spin down (Ostriker & Gunn, 1969) in which the rotating magnetic dipole is treated as point-like. In the Melatos model, the components of the electric and magnetic fields exterior to the rotating conducting sphere are modified according to calculations first performed by Deutsch (1955). The resulting modified electromagnetic torque is also dependent upon the magnetic inclination angle ; the strongest braking occurs when the magnetic and spin axes are orthogonal (i.e., when is a maximum).
Using the modified torque expression derived from these fields, the Melatos model predicts the values of the first and second braking indices and , which are determined observationally by and , where is the observed pulsar rotation frequency. The model determines and using only three observable parameters: the period , the period derivative , and . In the point-dipole spin-down model, theory predicts and (Blandford & Romani, 1988). However, in the Melatos model, the decreased braking torque produces values for and which are smaller than these, and there are no free parameters in the model. The model is thus highly falsifiable if adequate constraints can be placed on a pulsar’s emission geometry. The model has so far been applied with some success to the Crab pulsar, PSR B054069, and PSR J15135908 (B150958).
PSR J11196127 is a 408-ms radio pulsar that was discovered in August 1997 using the Parkes 64-m radio telescope during the Parkes Multibeam Pulsar Survey (Camilo et al., 2000). The pulsar is suitable for the study of pulsar spin-down: it is one of the youngest known pulsars, with an estimated age from timing of kyr, and is notable for having one of the strongest surface magnetic strengths of any known radio pulsar ( G under the magnetic dipole assumption). A measured second period derivative for the pulsar (Camilo et al., 2000) can in principle be used in combination with a constraint on to test the Melatos model of pulsar spin-down (see Section 3.3).
2 Observations and Data Reduction
We have analyzed polarimetry data taken with the Australia Telescope Compact Array (ATCA; Frater, Brooks, & Whiteoak 1992) and the Parkes radio telescope at center frequencies of 2496 and 1366 MHz, respectively. Details of the data analysis are presented below.
2.1 ATCA 2496-MHz Data
Data were taken of PSR J11196127 with the ATCA using a 128-MHz bandwidth centered on a frequency of 2496 MHz111Data were taken simultaneously at 1384 MHz with the ATCA using the dual-band feed, but Faraday smearing across the bandwidth from the large rotation measure (see rotation measure estimate below) reduced the measured linear polarization to less than 5% of the intrinsic value. We therefore do not use the 1384-MHz ATCA data in the analysis here and do not mention it further in this paper. as part of a radio imaging campaign in which supernova remnant SNR G292.20.5 was discovered; this is a young remnant associated with the pulsar (Crawford et al., 2001a). The ATCA observations were conducted on 30 and 31 Oct 1998 in the 6D array configuration using pulsar gating. The observing parameters, given in Table 1, are outlined with more extensive details of the data analysis elsewhere (Crawford, 2000; Crawford et al., 2001a).
Frequency channels contaminated with self-generated RFI were automatically excised at the start of the analysis, and alternating channels from the remaining set were preserved as a set of 13 channels of width 8 MHz each, giving 104 MHz of usable bandwidth. Since there is overlap between original adjacent channels, no sensitivity penalty was incurred in the selection of alternate channels. After the data were flagged and edited, the on-pulse data were selected from the pulsar gating, and Stokes parameters were extracted for each frequency channel at the pulsar’s position. These were used to compute the rotation measure (RM) for the pulsar. Using the MIRIAD data analysis package222See R. J. Sault & N. E. B. Killeen, 1999, The MIRIAD User’s Guide (Sydney: Australia Telescope National Facility), found at http://www.atnf.csiro.au/computing/software/miriad., Stokes and from each channel were converted into a PA according to:
| (2) |
An uncertainty in each PA was also computed using this routine, and the resulting PA for each channel was plotted against the square of the wavelength for each channel (see Figure 1). A linear fit of the form was then performed on the 13 data points to determine the RM. The best-fit slope gave RM = rad m-2. The resulting Faraday depolarization across the bandwidth at 2496 MHz was 4%, indicating that the polarization profile retains fidelity even in the absence of a Faraday rotation correction.
The frequency channels were then summed, and Stokes parameters were preserved for each of 32 pulse phase bins. A mean off-pulse baseline was subtracted from the total intensity profile, and the magnitude of the linear polarization for each phase bin, , was computed and corrected for positive bias as follows:
| (3) |
is the average value of the square of for all off-pulse bins. Stokes represents the circularly polarized intensity, with positive values corresponding to left-circularly polarized radiation. The percentage of linear polarization in the pulse profile, , was computed as the mean fractional linear polarization for all on-pulse bins, where is the flux from Stokes . The percentages of circular and absolute circular polarization were likewise computed as and , respectively.
2.2 Parkes 1366-MHz Data
Data were taken of PSR J11196127 with the Parkes radio telescope on 16 and 18 Jan 1999. The observations were conducted using the multibeam receiver (Staveley-Smith et al., 1996) and Caltech Correlator (Navarro, 1994; Navarro et al., 1997) at a center frequency of 1366 MHz covering a bandwidth of 128 MHz. Eight channels of width 16 MHz each were preserved.
Four separate integrations of 12 min each were summed, totaling 48 min. The four observations were taken in two sets of two consecutive observations. The first set (taken on 16 Jan 1999) was separated by two days from the second set (taken on 18 Jan 1999). Feed rotation provided correction for parallactic angle variation during the observations. The observing parameters are presented in Table 1, and the observing technique was similar to the one described by Manchester, Han, & Qiao (1998) and Crawford, Manchester, & Kaspi (2001b). 256 pulse phase bins were preserved across the full profile, allowing a high-resolution study of the behavior of the PA over the pulse phase.
An independent estimate of the RM using the Parkes data gave RM = rad m-2 (see, e.g., Manchester, Han, & Qiao 1998; Crawford, Manchester, & Kaspi 2001b for details on the technique of how the RM was estimated). Although this RM is consistent with the ATCA RM estimate, the very small uncertainty in the Parkes estimate cannot be readily believed. Multibeam receiver instrumental effects were present which affect the measured RM at a level significantly greater than the quoted uncertainty, which is less than 1% (see, e.g., Johnston 2002 for details). We instead use the more reliable RM estimate from the ATCA data. However, a phase-rotation correction could still be applied to the Parkes data prior to channel summing. Trial phase rotations were applied until the resulting measured linear polarization in the profile from the sum across channels was maximized, indicating constructive addition of the linear polarization (and the proper correction for Faraday rotation). Uncorrectable Faraday smearing within the frequency channels accounted for a reduction in the measured fractional linear polarization of 4%.
After phase-rotation and channel summing, the Stokes parameters were used to determine polarization parameters for each bin in the same way as for the ATCA data (described above). The uncertainty in for each profile bin was based on the scalar uncertainty determined from the off-pulse rms of Stokes . The linear polarization vector for a given bin could deviate in any direction by this uncertainty, and the corresponding deviation in the vector’s PA was taken to be the uncertainty in . These uncertainties were used when computing the RV best fit for the Parkes data. 33 data points in the profile had PA uncertainty less than , indicating significant and measurable linear polarization. These points were used in the PA fit (see Section 3.2). Only the Parkes data were used for this fit since the ATCA profile had insufficient resolution.
3 Results and Discussion
3.1 Radio Polarization Properties of PSR J11196127
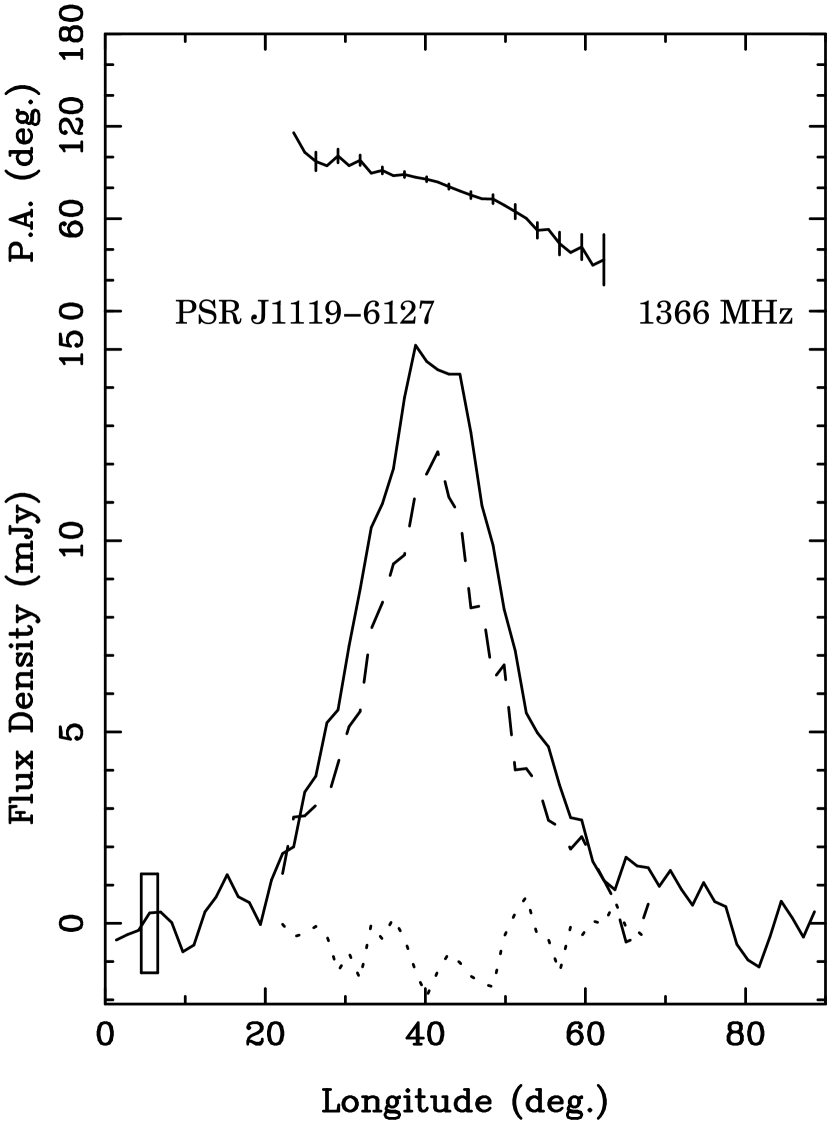
Measured polarization parameters for PSR J11196127 from the 1366-MHz Parkes data and the 2496-MHz ATCA data are presented in Table 1, and the Parkes and ATCA polarization profiles are shown in Figures 2 and 3, respectively. The on-pulse emission has strong linear polarization at both frequencies, with a fractional linear polarization (scaled upwards by 4% in each case to correct for Faraday smearing across finite bandwidths) of 77 10% and 56 6% at 1366 and 2496 MHz. The uncertainty in the linear polarization fraction measured in the Parkes data includes the error introduced by multibeam receiver polarization impurities. These impurities affect the measured circular polarization and, to a lesser extent, the linear polarization (Johnston, 2002). It is clear that the pulsar remains highly polarized at high radio frequencies. The circular polarization is weaker in both cases. The RM, measured using the 2496-MHz ATCA data, is rad m-2. The relation of the RM to the mean line-of-sight interstellar magnetic field is given by (Manchester & Taylor, 1977):
| (4) |
where DM is the dispersion measure in units of pc cm-3 (DM = 707 pc cm-3 for PSR J11196127). for PSR J11196127 is G, where a positive value corresponds to field lines pointing toward the observer. This value is consistent with typical galactic magnetic field strengths (Han, Manchester, & Qiao, 1999).
The profile’s high degree of linear polarization is particularly noteworthy. Another young radio pulsar, PSR J15135098, has similar characteristics to PSR J11196127 (i.e., a 2 kyr age, a very large magnetic field, and a relatively long period for such a young pulsar). Crawford, Manchester, & Kaspi (2001b) report on radio polarization observations of PSR J15135908 taken with Parkes at 1350 MHz and show that the pulsar is essentially completely linearly polarized at this frequency. At 1366 MHz, PSR J11196127 has a single, wide pulse, with a width of as measured at 50% of the peak, and a width of as measured at 10% of the peak. This wide pulse is again similar to the morphology of PSR J15135908, which at 1350 MHz has pulse widths of and at 50% and 10% of the peak, respectively. In general, the pulse morphology of PSR J11196127 is similar to the single, wide, highly linearly polarized profiles of the young pulsars presented by Crawford, Manchester, & Kaspi (2001b).
With its relatively large spin-down luminosity ergs s-1, the pulsar fits a positive trend noticed previously at 1400 MHz between spin-down luminosity and degree of linear polarization (see, e.g., Figure 2 of Crawford, Manchester, & Kaspi 2001b). The pulsar also fits the association between small characteristic age (in this case, kyr) and strong linear polarization noticed by Gould & Lyne (1998). Since spin-down luminosity and characteristic age are correlated by definition (), this is not surprising.
3.2 PA Swing and RV Fit from the Parkes Data
Measured PAs with uncertainty less than are shown as a function of pulse phase in Figure 4 for the 1366-MHz Parkes data. Overlaid is the best-fit RV model. The fit used a downhill simplex -minimization algorithm in 4 dimensions (e.g., Press et al. 1992). The model fits well, with a best-fit of 16.5 with 29 degrees of freedom. The characteristic swing in PA is noticeable, with a maximum swing occurring at , as determined by the best fit. There is almost no radiation at the point and after; the pulse peak leads the PA swing. This is consistent with the partial conal beam structure interpretation set forth by Lyne & Manchester (1988) and is similar to the PA behavior seen for other young pulsars (Crawford, Manchester, & Kaspi, 2001b).
Constraints from the RV fit on the parameters and are shown in Figure 5. The statistical constraints on the fit parameters imply at the 3 confidence level. However, can only be constrained to at the level owing to the limited data available. It is important to note that while and display little covariance, and have concomitantly great covariance.
3.3 Testing the Melatos Model of Pulsar Spin-down
We have attempted to test the Melatos model of spin-down using an estimate of from the RV fit of the Parkes PA data (described in Section 3.2) and measurements of and from previous timing observations. Camilo et al. (2000) measured a braking index for PSR J11196127, which included uncertainty from a glitch and timing noise. Within the Melatos model, this value of implies that should lie between and (see Figure 6).
A measurement of the second braking index is unavailable from the current timing data; furthermore, possible future glitches make the prospect of accurately measuring uncertain. If were to be estimated from future timing observations, a significant test of the spin-down model using would still require an independent geometry constraint that excludes very small values of ; for less than a few degrees, the model’s prediction of fluctuates across a wide range of values.
Although the Parkes PA data are fit well by the RV model (see Section 3.2), the fit does not provide a meaningful statistical constraint on . At the 3 level, in the fit. Since the model’s prediction of the braking index depends on the sine of , a useful constraint on requires a constraint on better than . The constraint on from these observations is thus insufficient to test the Melatos model. Additional PA data from future polarimetry observations may be able to sufficiently constrain and make a significant test of the model possible. We estimate that with hr of polarization observations at 1400 MHz with a similar system, we could obtain a constraint on that would be useful for the model test.
As shown in Figure 6, improvements in the measurement of itself might also aid a test of this model. Reducing the uncertainty in would reduce the range of observed that could be in agreement with the model.
4 Conclusions
Using pulsar-gated 2496-MHz radio imaging data (Crawford et al., 2001a) taken with the ATCA and archival 1366-MHz polarization data taken with the Parkes telescope, we report on the polarization properties of PSR J11196127, a pulsar notable for its youth and strong magnetic field. A Faraday rotation measurement using the ATCA data gives a RM of rad m-2 for the pulsar and a corresponding mean line-of-sight magnetic field strength of G, consistent with typical galactic magnetic field values. The pulsar’s polarization profile shows a high degree of linear polarization (% at 1366 MHz and % at 2496 MHz), in agreement with previously noticed trends for young pulsars at 1400 MHz (Crawford, Manchester, & Kaspi, 2001b; Gould & Lyne, 1998). The pulsar also has linear polarization and pulse morphology characteristics which are similar to those seen for other young pulsars (e.g., PSR J15135908). A RV model fit of the observed PA swing from the Parkes data constrains the impact parameter to and indicates that the pulse peak leads the PA symmetry axis. Additionally, the pulsar’s profile consists of a single wide component. These features suggest emission from the leading edge of a wide hollow cone beam, consistent with the partial conal interpretation outlined by Lyne & Manchester (1988).
PSR J11196127’s measurable braking index and clean polarization profile suggest that it may be used in the future to test the model of pulsar spin-down proposed by Melatos (1997). While constraints on the magnetic inclination angle obtained from a RV model fit to the available Parkes PA data are inadequate for a significant test of this model, further refinements from pulsar timing and additional polarization observations could make such a test possible.
References
- Blandford & Romani (1988) Blandford, R. D. & Romani, R. W. 1988, MNRAS, 234, 57P
- Camilo et al. (2000) Camilo, F., Kaspi, V. M., Lyne, A. G., Manchester, R. N., Bell, J. F., D’Amico, N., McKay, N. P. F., & Crawford, F. 2000, ApJ, 541, 367
- Crawford (2000) Crawford, F. 2000, Ph.D. Thesis, MIT
- Crawford et al. (2001a) Crawford, F., Gaensler, B. M., Kaspi, V. M., Manchester, R. N., Camilo, F., Lyne, A. G., & Pivovaroff, M. J. 2001a, ApJ, 554, 152
- Crawford, Manchester, & Kaspi (2001b) Crawford, F., Manchester, R. N., & Kaspi, V. M. 2001b, AJ, 122, 2001
- Deutsch (1955) Deutsch, A. J. 1955, Annales d’Astrophysique, 18, 1
- Everett & Weisberg (2001) Everett, J. E. & Weisberg, J. M. 2001, ApJ, 553, 341
- Frater, Brooks, & Whiteoak (1992) Frater, R. H., Brooks, J. W., & Whiteoak, J. B. 1992, Journal of Electrical and Electronics Engineering Australia, 12, 103
- Gould & Lyne (1998) Gould, D. M. & Lyne, A. G. 1998, MNRAS, 301, 235
- Han, Manchester, & Qiao (1999) Han, J. L., Manchester, R. N., & Qiao, G. J. 1999, MNRAS, 306, 371
- Johnston (2002) Johnston, S. 2002, Publications of the Astronomical Society of Australia, 19, 277
- Lyne & Manchester (1988) Lyne, A. G. & Manchester, R. N. 1988, MNRAS, 234, 477
- Melatos (1997) Melatos, A. 1997, MNRAS, 288, 1049
- Manchester, Han, & Qiao (1998) Manchester, R. N., Han, J. L., & Qiao, G. J. 1998, MNRAS, 295, 280
- Manchester & Taylor (1977) Manchester, R. N. & Taylor, J. H. 1977, Pulsars (San Francisco: Freeman)
- Navarro (1994) Navarro, J. 1994, Ph.D. Thesis, Caltech
- Navarro et al. (1997) Navarro, J., Manchester, R. N., Sandhu, J. S., Kulkarni, S. R., & Bailes, M. 1997, ApJ, 486, 1019
- Ostriker & Gunn (1969) Ostriker, J. P. & Gunn, J. E. 1969, ApJ, 157, 1395
- Press, Teukolsky, Vetterling, & Flannery (1992) Press, W. H., Teukolsky, S. A., Vetterling, W. T., & Flannery, B. P. 1992, Numerical Recipes in C (2d ed.; Cambridge: Cambridge Univ. Press)
- Qiao, Manchester, Lyne, & Gould (1995) Qiao, G. J., Manchester, R. N., Lyne, A. G., & Gould, D. M. 1995, MNRAS, 274, 572
- Radhakrishnan & Cooke (1969) Radhakrishnan, V. & Cooke, D. J. 1969, Astrophys. Lett., 3, 225
- Rankin (1983) Rankin, J. M. 1983, ApJ, 274, 333
- Staveley-Smith et al. (1996) Staveley-Smith, L. et al. 1996, Publications of the Astronomical Society of Australia, 13, 243


| Telescope | Parkes | ATCA |
| Receiver | Multibeam | 13 cm |
| On-source integration time (h) | 0.8 | 9 |
| Center frequency (MHz) | 1366 | 2496 |
| Bandwidth (MHz) | 128 | 104 |
| Number of frequency channels | 8 | 13 |
| Number of bins in pulse profile | 256 | 32 |
| Pulse width at 50% of peak (deg) | 20 | 15 |
| Pulse width at 10% of peak (deg) | 45 | 35 |
| (%)aaFractional on-pulse linear polarization. Corrected for channel/bandwidth depolarization. | ddQuoted uncertainty includes the contribution from multibeam receiver instrumental effects (e.g., Johnston 2002). | |
| (%)bbFractional on-pulse circular polarization. Positive values correspond to left circular polarization. | ddQuoted uncertainty includes the contribution from multibeam receiver instrumental effects (e.g., Johnston 2002). | |
| (%)ccFractional absolute on-pulse circular polarization. | ddQuoted uncertainty includes the contribution from multibeam receiver instrumental effects (e.g., Johnston 2002). | |
| Rotation measure, RM (rad m-2)eeDetermined from 2496-MHz pulsar-gated ATCA data. | ||
| Mean line-of-sight magnetic field, (G)ffPositive values correspond to magnetic field lines toward the observer. |
Note. — The ATCA observing parameters are also presented in detail in Crawford et al. (2001a).