Star Formation at the Twilight of the Dark Ages: Which Stars Reionized the Universe?
Abstract
We calculate the global star formation rate density (SFRD) from –3 using a semi-analytic model incorporating the hierarchical assembly of dark matter halos, gas cooling via atomic hydrogen, star formation, supernova feedback, and suppression of gas collapse in small halos due to the presence of a photoionizing background. We compare the results with the predictions of simpler models based on the rate of dark matter halo growth and a fixed ratio of stellar-to-dark mass, and with observational constraints on the SFRD at . We also estimate the star formation rate due to very massive, metal-free Pop III stars using a simple model based on the halo formation rate, calibrated against detailed hydrodynamic simulations of Pop III star formation. We find that the total production rate of hydrogen-ionizing photons during the probable epoch of reionization () is approximately equally divided between Pop II and Pop III stars, and that if reionization is late (, close to the lower limit of the range allowed by the WMAP results), then Pop II stars alone may be able to reionize the Universe.
1 Introduction
When and how the Universe became reionized is one of the fundamental questions in cosmology. There is currently a great deal of interest in this question due to recent observational and theoretical developments. The discovery of several quasars in the SDSS whose spectra are consistent with showing zero flux below Lyman- (a ‘Gunn-Peterson’ trough) may indicate that the IGM was predominantly neutral at (Fan 2001; Becker et al. 2001). The ionization history of the Universe may also be constrained via observations of the cosmic microwave background (CMB). The recently released first-year results from the WMAP satellite constrain the reionization redshift to the range (Kogut et al. 2003).
What is the nature of the sources that produced the photons responsible for this transition from neutral to ionized? In Cold Dark Matter (CDM) models, halos large enough to form significant amounts of molecular hydrogen start appearing around redshift (Tegmark et al. 1997). The stars that formed in these halos, out of pristine, metal-free and magnetic-field-free gas, with molecular hydrogen as the only coolant, were almost certainly quite different from the stars we see around us today. Numerical simulations suggest that these first stars were extremely massive, on the order of a few hundred solar masses (Abel et al. 2000, 2002; Bromm et al. 2002). This first generation of very massive, metal free stars is often referred to as ‘Pop III’. Because of their high temperatures and low metallicities, Pop III stars may produce up to times as many hydrogen-ionizing photons per solar mass as Pop II stars (Bromm et al. 2001). It is therefore natural to think that these stars may play an important role in early reionization. Ironically, less is known about the second generation of stars, precisely because the metals, magnetic fields, and photons produced by the first stars complicate the situation. The key processes that determine how efficiently Pop III stars can form and when the transition to Pop II occurs — destruction of H2 by Lyman-Werner photons, catalysis of H2 by X-rays, and the production, dispersal, and mixing of heavy elements — remain poorly understood (Machacek et al. 2001, 2003; Ricotti et al. 2001, 2002; Cen 2002; Yoshida et al. 2003).
Around –20, halos that are large enough to cool by atomic processes start to collapse. Two processes are likely to be responsible for regulating star formation in these halos. If the Universe has already been reionized, the UV background will prevent gas from collapsing into halos with temperatures smaller than the effective Jeans mass, K, corresponding to circular velocities –50 km/s (e.g. Thoul & Weinberg 1996; Gnedin 2000). We hereafter refer to the suppression of star formation resulting from this effect as photoionization ‘squelching’. Supernovae and massive stars also regulate star formation by heating the ISM and driving winds that remove the gas from the galaxy (Dekel & Silk 1986; Mac Low & Ferrara 1999).
In this Letter, we present predictions for the cosmic star formation rate density (SFRD) due to both Pop II and Pop III stars from –3. We compare our results with observations at the low redshift end (–6). We use a semi-analytic model to explore the effects of photoionization squelching and supernova feedback on these predictions, and consider several possible reionization histories (including a model with multiple reionizations). We then assess the relative contribution from Pop II and Pop III stars to the ionizing photon budget during the redshift range relevant to the epoch of reionization as constrained by WMAP and the SDSS quasar observations (–30). Throughout, we assume cosmological parameters consistent with the WMAP data (Spergel et al. 2003): matter density , baryon density , dark energy , Hubble parameter km/s/Mpc, fluctuation amplitude , and a scale-free primordial power spectrum .
2 The halo-collapse model
In order for gas to be converted into stars, the first-order condition is that it must be inside a collapsed halo of sufficient mass to allow the gas to cool and become dense. Following this line of argument, we may model the global star formation rate density by assuming that it is proportional to the rate at which gas collapses into halos in a given mass range:
| (1) |
where is the time derivative of the fraction of the total mass in collapsed halos with masses greater than , obtained from the halo mass function given by the Press-Schechter model (Press & Schechter 1974) or one of its variants, and is the mean density of baryons. One may then assign the efficiency of conversion of gas into stars and the critical mass for separate populations depending on the main coolant and the mode of star formation. For example, corresponds to a halo virial temperature of about K for halos that cool via atomic processes, while K for molecular cooling. Pop III stars are generally assumed to form in the lower temperature, H2-cooled halos, with a much lower efficiency than Pop II stars, which are associated with larger, HI-cooled halos (for a more detailed discussion, see e.g. Loeb & Barkana 2001). We hereafter refer to this as the ‘halo-collapse’ model.
3 Merger Tree models
Variants on simple models like the one presented above have been used in many recent analytic studies of early star formation and reionization (e.g. Cen 2002; Wyithe & Loeb 2002, 2003; Venkatesan et al. 2003; Haiman & Holder 2003). However, there is a well-developed semi-empirical approach to modeling the physics of atomic cooling, Pop II star formation and chemical enrichment, and supernova feedback, within the framework of hierarchical merging predicted by CDM models. The effect of photoionization squelching on Pop II star formation has also been included in some semi-analytic models (Kauffmann et al. 1993; Somerville 2002; Benson et al. 2002). This approach has been used in a large number of studies of galaxy formation at lower redshift –5 (e.g. Kauffmann et al. 1993; Cole et al. 1994; Kauffmann et al. 1998; Cole et al. 2000; Somerville & Primack 1999; Somerville et al. 2001). It is interesting to see how the results based on these more realistic recipes compare with the simple ‘halo-collapse’ model described above, and to study the relative importance of the various processes that are expected to regulate star formation at very high redshift.
Here we use the models developed in Somerville & Primack (1999, SP) and Somerville et al. (2001, SPF), with photoionization squelching added as described in Somerville (2002), using a recipe based on the numerical results of (Gnedin 2000). We follow halo merger histories down to halos with temperature K, where atomic cooling becomes possible. We shall refer to these models as the ‘merger tree’ models.
4 Results
4.1 The Cosmic Star Formation History
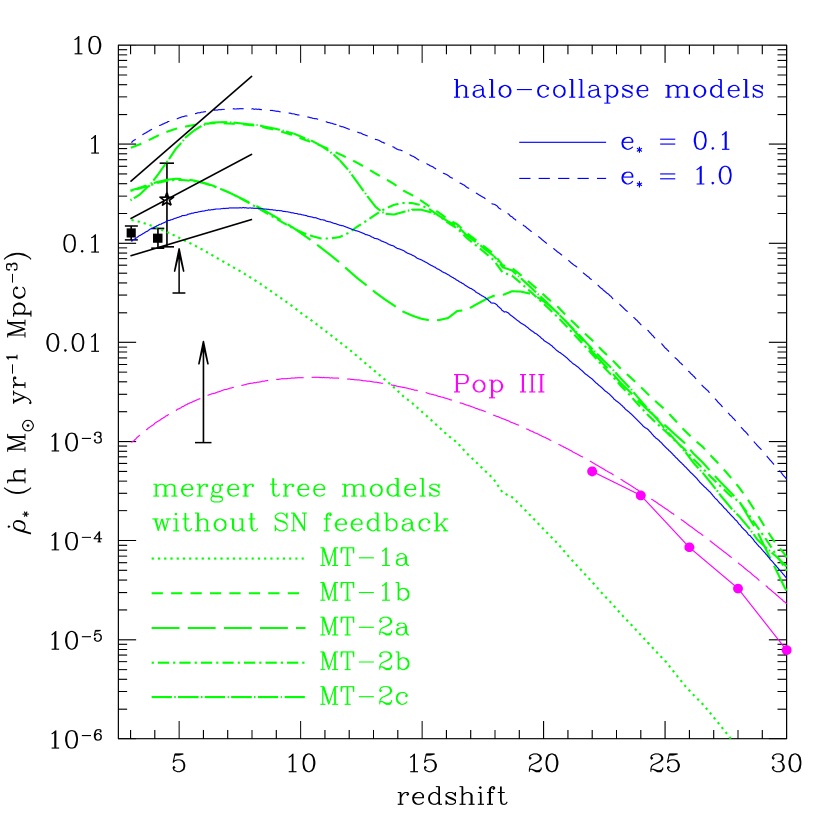
We show the predicted star formation rate density (SFRD) for Pop II and Pop III stars in Fig. 1. For Pop III stars, we have used the halo collapse model (Eqn. 1) with and . Also shown in Fig. 1a are the results from detailed numerical hydrodynamic simulations of Pop III star formation in a cosmological volume by Yoshida et al. (2003), for an assumed characteristic Pop III mass of . We see that with these parameter choices, our simple recipe reproduces the simulation results fairly well. Of course, we do not really expect Pop III star formation to continue to . However, in the absence of more detailed modeling of metal production and mixing, we do not know when the Pop III mode will ‘shut off’.
Fig. 1a also shows the prediction of the halo collapse model for Pop II stars, with corresponding to a temperature111See SP for the conversions between virial mass, velocity, and temperature as a function of redshift of K and efficiencies of and . The halo collapse model represents a sort of upper limit for star formation in halos that cool via HI, as it would require all new gas flowing into these halos to cool and form stars instantaneously. The predicted SFRD may be compared with observational estimates and limits on this quantity at ‘low’ redshift (see figure caption). The assumed efficiencies of and approximately bracket the range in observational estimates. We note in passing that the Lanzetta et al. high estimate exceeds even the extreme case of at –10.
We also show the star formation history produced in the more realistic semi-analytic merger tree models described in Section 3. To study the sensitivity of our results to our recipes for star formation, photoionization squelching, and supernova feedback, we investigate different choices of ingredients and parameters. The merger tree models are summarized in Table 1. The reader only interested in the main result may skip directly to Section 4.2.
Models MT-1a and MT-1b do not include supernova feedback or photoionization squelching. Star formation is then regulated only by the rate at which gas can cool via atomic processes and collapse, and by the star formation timescale . We consider two choices for this timescale, which we refer to as ‘constant efficiency’ and ‘accelerating’. In the constant efficiency (CE) recipe, is a constant (we take ). In the ‘accelerating’ recipe, , where is the dynamical time of the halo. This is similar to the scaling observed in nearby galaxies (Kennicutt 1983, 1998) and is commonly used as an empirical basis for star formation recipes in semi-analytic models and hydrodynamic simulations. Referring to Fig. 1a, we see that the ‘accelerating’ scaling leads to dramatically more star formation at high redshift compared with the constant efficiency scaling. We use this recipe in the rest of the models.
In models MT-2a–c, we include the effect of photoionization squelching (but no SN feedback), with different assumed reionization histories, motivated by the joint WMAP and SDSS constraints discussed above. We show in Fig. 1a a model in which hydrogen is reionized at or and remains reionized, and a model with a ‘double reionization’ based on the model of Cen (2002), in which the Universe is reionized at , recombines by , and experiences a second reionization at . The ‘dips’ in the star formation history are due to the suppression of gas infall by the photoionizing background, and demonstrate that a substantial fraction of the total star formation in the Universe would be taking place in small mass halos in the absence any kind of feedback.
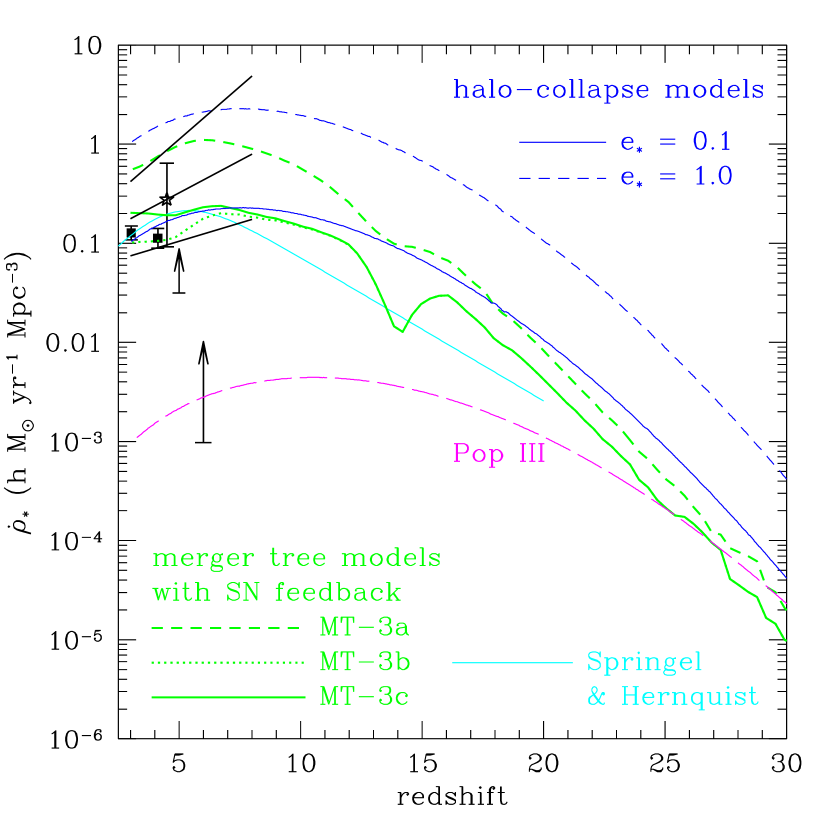
Models MT-3a–c, shown in Fig. 1b, all assume the Cen (2002) double-reionization history described above, and also include supernova feedback. Note that the ‘dips’ are now much less dramatic, because much of the gas has already been removed from the small halos that are affected by photoionization squelching. An uncertain aspect of implementing supernova feedback in semi-analytic models is the fate of the reheated gas. In model MT-3a, the gas reheated by SN is removed from the disk but retained in the halo (‘retention’ feedback), in MT-3b the reheated gas is removed from the disk and dark matter halo of all galaxies (‘ejection’ feedback), and in model MT-3c the gas is ejected from the halo only if the halo virial velocity is less than 100 km/s. This threshold for ejection of gas by super-winds is motivated by theoretical arguments (Dekel & Silk 1986) and observations of nearby galaxies (Martin 1999). The global star formation rate changes by as much as a factor of six at depending on these choices, but by less than a factor of two at . Note that the ‘dip’ following the first reionization is considerably more pronounced in the model with ejection feedback, as gas which has been accreted before reionization and ejected is not allowed to re-collapse in small halos while the photoionizing background is ‘switched on’. We consider models MT-3a and MT-3c to be the most realistic of the models considered here. Models with similar ingredients and parameter values have been shown to reproduce the luminosity function of galaxies at (SP) as well as of Lyman break galaxies at (SPF).
4.2 Production of Ionizing Photons
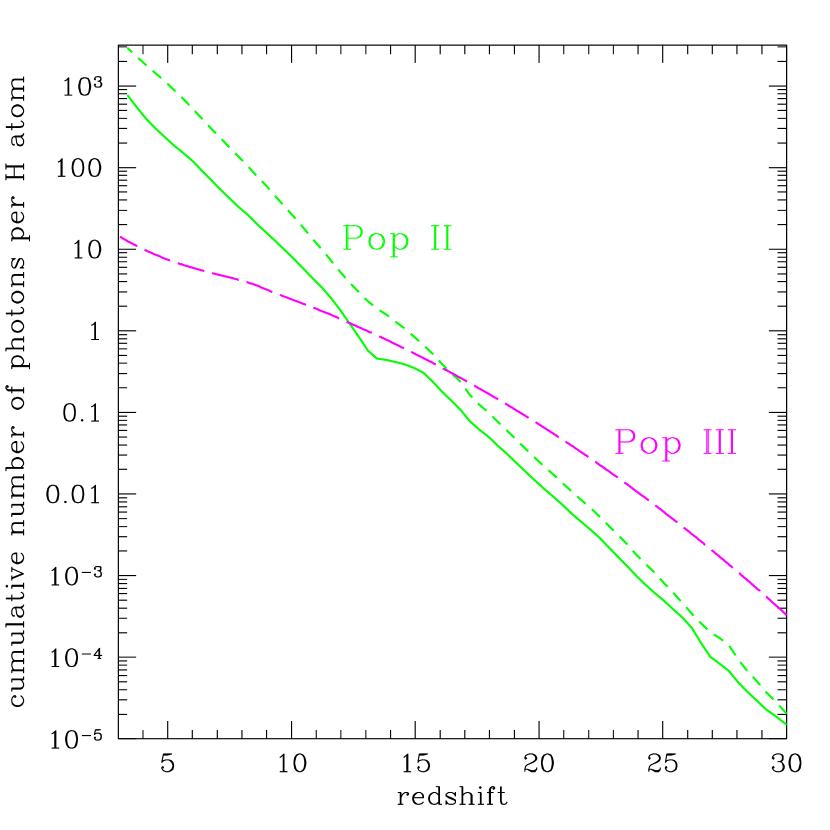
In Fig. 2 we show the cumulative number of hydrogen-ionizing photons per hydrogen atom in the Universe, produced by Pop II stars in our fiducial models (MT-3a and MT-3c), and by our model for Pop III star formation. For Pop II, we use the results of Leitherer et al. (1999) for the number of Å photons produced by low metallicity stars with a Salpeter IMF. For Pop III, we assume that each star produces photons s for a lifetime of 3 million years (Bromm et al. 2001). We emphasize that we have shown the number of ionizing photons produced, without attempting to fold in the fraction of these photons that manage to escape from the galaxy or to propagate through the IGM. The ionization fraction is expected to scale as this quantity times (e.g., Spergel et al. 2003), where is the number of ionizations per UV photon, is the fraction of ionizing photons that escape from the galaxy, and is the clumping factor, reflecting the clumpyness of the IGM. The recombination time at is –0.7 times the Hubble time (Cen 2002). Observational constraints on for both nearby and high redshift galaxies range from a few percent to 50 percent (Leitherer et al. 1995; Hurwitz et al. 1997; Steidel et al. 2001). Clumping factors at high redshift are expected to be on the order of –10 (Cen 2002). Therefore the combination is plausibly of order –0.2 in the relevant redshift range.
In Fig. 2, we see that the total number of ionizing photons produced by Pop II stars in our fiducial model overtakes the contribution from Pop III stars at around –12. If reionization occurred near the lower redshift end of the WMAP range (which seems easier to reconcile with our model), then our results suggest that Pop II stars contributed at least half of the ionizing photons. If reionization occurred as late as , then Pop II stars (which are known observationally to exist) may even have been able to reionize the Universe on their own. One should also keep in mind that given the non-negligible rate of star formation (both Pop III and Pop II) even at , we might expect there to have been sufficient metal pollution to have halted the formation of very massive Pop III stars at quite a high redshift. However, the redshift of this transition is highly uncertain, and is almost certainly not sharp, but will occur at different epochs in different environments.
5 Discussion
We have shown predictions of the global star formation history from the time when the first stars began to form until the epoch of the most distant observed galaxies –6. We summarize our main conclusions as follows:
-
•
There are two main competing effects determining the Pop II star formation efficiency (SFE) at high redshift. (i) The star formation activity shifts toward smaller halos at earlier times, leading to decreased effective SFE as supernova feedback and photoionization squelching reduce the available cold gas supply in these halos. (ii) If the SFE is higher when the gas density is larger, as suggested by observations in nearby galaxies, then this is partially counteracted by the increased efficiency expected due to the higher characteristic gas densities.
-
•
Our results suggest that the background of hydrogen-ionizing photons during reionization at –20 is roughly equally divided between Pop II and Pop III stars. While Pop III stars produce a larger number of ionizing photons per baryon, this is compensated by the lower SFRD of Pop III stars in the relevant redshift range –20.
-
•
If is pushed to the lower limit of the range allowed by the WMAP results, the background produced by Pop II stars alone may be sufficient to reionize the universe, thus removing the only compelling observational argument for the existence of Pop III stars.
Using similar semi-analytic recipes for star formation applied within N-body simulations with radiative transfer, Ciardi et al. (2003) also concluded that Pop II stars alone can produce reionization histories that are within the WMAP constraints.
There are several uncertain factors that could shift our results by factors of a few in different directions. The characteristic masses of the Pop III stars could be a factor of 2–3 higher than we have assumed here, resulting in a corresponding scaling in the star formation and ionizing photon production rate. However, we may have underestimated the number of ionizing photons produced by Pop II stars at early times, as they may have lower metallicities than the Leitherer et al. (1999) models used here, and may have a somewhat top-heavy IMF (Larson 1998). This could lead to a factor of –3 increase in the number of ionizing photons predicted by the Pop II stars (Tumlinson et al. 2003; Schaerer 2003). It is clear that more detailed modeling of chemical evolution is needed to better constrain these uncertainties, as well as the transition redshift between massive Pop III formation and Pop II formation with a normal IMF.
If correct, the implications of an ionizing background that is composed nearly equally of photons originating from Pop II and Pop III stars are interesting in several respects. The halos hosting the Pop II galaxies are rare peaks and will be highly clustered, while the lower-mass halos hosting the Pop III stars will be much less clustered, leading potentially to a rather complex topology for reionization. Because the Pop III stars will produce an even larger excess of helium ionizing photons, there are important implications for helium reionization as well (e.g. Venkatesan et al. 2003).
Acknowledgments
We thank L. Moustakas for a careful reading of the manuscript and useful suggestions.
References
- Abel et al. (2000) Abel, T., Bryan, G. L., & Norman, M. L. 2000, ApJ, 540, 39
- Abel et al. (2002) —. 2002, Science, 295, 93
- Barger et al. (2000) Barger, A. J., Cowie, L. L., & Richards, E. A. 2000, AJ, 119, 2092
- Becker et al. (2001) Becker, R. H.et al. 2001, AJ, 122, 2850
- Benson et al. (2002) Benson, A. J., Lacey, C. G., Baugh, C. M., Cole, S., & Frenk, C. S. 2002, MNRAS, 333, 156
- Bromm et al. (2002) Bromm, V., Coppi, P. S., & Larson, R. B. 2002, ApJ, 564, 23
- Bromm et al. (2001) Bromm, V., Kudritzki, R. P., & Loeb, A. 2001, ApJ, 552, 464
- Cen (2002) Cen, R. 2002, preprint, astro-ph/0210473
- Ciardi et al. (2003) Ciardi, B., Ferrara, A., & White, S. D. M. 2003, preprint, astro-ph/0302451
- Cole et al. (1994) Cole, S., Aragón-Salamanca, A., Frenk, C., Navarro, J., & Zepf, S. 1994, MNRAS, 271, 781
- Cole et al. (2000) Cole, S., Lacey, C. G., Baugh, C. M., & Frenk, C. S. 2000, MNRAS, 319, 168
- Dekel & Silk (1986) Dekel, A. & Silk, J. 1986, ApJ, 303, 39
- Fan (2001) Fan, X. 2001, AJ, 122, 2833
- Gnedin (2000) Gnedin, N. Y. 2000, ApJ, 542, 535
- Haiman & Holder (2003) Haiman, Z. & Holder, G. 2003, preprint, astro-ph/0302403
- Hurwitz et al. (1997) Hurwitz, M., Jelinsky, P., & Dixon, W. V. D. 1997, ApJ, 481, L31+
- Iwata et al. (2003) Iwata, I., Ohta, K., Tamura, N., Ando, M., Wada, S., Watanabe, C., Akiyama, M., & Aoki, K. 2003, preprint, astro-ph/0301084
- Kauffmann et al. (1998) Kauffmann, G., Colberg, J., Diaferio, A., & White, S. D. M. 1998, MNRAS, 303, 188
- Kauffmann et al. (1993) Kauffmann, G., White, S., & Guiderdoni, B. 1993, MNRAS, 264, 201
- Kennicutt (1983) Kennicutt, R. 1983, ApJ, 272, 54
- Kennicutt (1998) —. 1998, ApJ, 498, 181
- Kogut et al. (2003) Kogut, A. et al. 2003, preprint, astro-ph/0302213
- Lanzetta et al. (2002) Lanzetta, K. M., Yahata, N., Pascarelle, S., Chen, H., & Fernández-Soto, A. 2002, ApJ, 570, 492
- Larson (1998) Larson, R. B. 1998, MNRAS, 301, 569
- Leitherer et al. (1995) Leitherer, C., Ferguson, H. C., Heckman, T. M., & Lowenthal, J. D. 1995, ApJ, 454, L19
- Leitherer et al. (1999) Leitherer, C. et al. 1999, ApJS, 123, 3
- Loeb & Barkana (2001) Loeb, A. & Barkana, R. 2001, ARA&A, 39, 19
- Mac Low & Ferrara (1999) Mac Low, M. & Ferrara, A. 1999, ApJ, 513, 142
- Machacek et al. (2001) Machacek, M. E., Bryan, G. L., & Abel, T. 2001, ApJ, 548, 509
- Machacek et al. (2003) —. 2003, MNRAS, 338, 273
- Martin (1999) Martin, C. L. 1999, ApJ, 513, 156
- Press & Schechter (1974) Press, W. H. & Schechter, P. 1974, ApJ, 187, 425
- Ricotti et al. (2001) Ricotti, M., Gnedin, N. Y., & Shull, J. M. 2001, ApJ, 560, 580
- Ricotti et al. (2002) —. 2002, ApJ, 575, 49
- Schaerer (2003) Schaerer, D. 2003, A&A, 397, 527
- Somerville (2002) Somerville, R. S. 2002, ApJ, 572, L23
- Somerville & Primack (1999) Somerville, R. S. & Primack, J. R. 1999, MNRAS, 310, 1087
- Somerville et al. (2001) Somerville, R. S., Primack, J. R., & Faber, S. M. 2001, MNRAS, 320, 504
- Spergel et al. (2003) Spergel, D.N. et al. 2003, preprint, astro-ph/0302209
- Springel & Hernquist (2003) Springel, V. & Hernquist, L. 2003, MNRAS, 339, 312
- Stanway et al. (2003) Stanway, E., Bunker, A., & McMahon, R. 2003, preprint, astro-ph/0302212
- Steidel et al. (1999) Steidel, C. C., Adelberger, K. L., Giavalisco, M., Dickinson, M., & Pettini, M. 1999, ApJ, 519, 1
- Steidel et al. (2001) Steidel, C. C., Pettini, M., & Adelberger, K. L. 2001, ApJ, 546, 665
- Tegmark et al. (1997) Tegmark, M., Silk, J., Rees, M. J., Blanchard, A., Abel, T., & Palla, F. 1997, ApJ, 474, 1
- Thoul & Weinberg (1996) Thoul, A. A. & Weinberg, D. H. 1996, ApJ, 465, 608
- Tumlinson et al. (2003) Tumlinson, J., Shull, J. M., & Venkatesan, A. 2003, ApJ, 584, 608
- Venkatesan et al. (2003) Venkatesan, A., Tumlinson, J., & Shull, J. M. 2003, ApJ, 584, 621
- Wyithe & Loeb (2002) Wyithe, S. & Loeb, A. 2002, preprint, astro-ph/0209056
- Wyithe & Loeb (2003) —. 2003, preprint, astro-ph/0302297
- Yoshida et al. (2003) Yoshida, N., Abel, T., Hernquist, L., & Sugiyama, N. 2003, preprint, astro-ph/0301645
| Model | SN feedback | gas ejection | squelching | ||||
|---|---|---|---|---|---|---|---|
| MT-1a | constant | no | no | no | N/A | N/A | N/A |
| MT-1b | no | no | no | N/A | N/A | N/A | |
| MT-2a | no | no | yes | 20 | N/A | N/A | |
| MT-2b | no | no | yes | 15 | N/A | N/A | |
| MT-2c | no | no | yes | 15.5 | 13.5 | 6.0 | |
| MT-3a | yes | no | yes | 15.5 | 13.5 | 6.0 | |
| MT-3b | yes | yes | yes | 15.5 | 13.5 | 6.0 | |
| MT-3c | yes | km/s | yes | 15.5 | 13.5 | 6.0 |