In-the-Gap SU UMa-Type Dwarf Nova, Var73 Dra with a Supercycle of about 60 Days
An intensive photometric-observation campaign of the recently discovered SU UMa-type dwarf nova, Var73 Dra was conducted from 2002 August to 2003 February. We caught three superoutbursts in 2002 October, December and 2003 February. The recurrence cycle of the superoutburst (supercycle) is indicated to be 60 d, the shortest among the values known so far in SU UMa stars and close to those of ER UMa stars. The superhump periods measured during the first two superoutbursts were 0.104885(93) d, and 0.10623(16) d, respectively. A 0.10424(3)-d periodicity was detected in quiescence. The change rate of the superhump period during the second superoutburst was , which is an order of magnitude larger than the largest value ever known. Outburst activity has changed from a phase of frequent normal outbursts and infrequent superoutbursts in 2001 to a phase of infrequent normal outbursts and frequent superoutbursts in 2002. Our observations are negative to an idea that this star is an related object to ER UMa stars in terms of the duty cycle of the superoutburst and the recurrence cycle of the normal outburst. However, to trace the superhump evolution throughout a superoutburst, and from quiescence more effectively, may give a fruitful result on this matter.
Key Words.:
Accretion, accretion disks – novae, cataclysmic variables — Stars: dwarf novae — Stars: individual (Var73 Dra)1 Introduction
Dwarf novae are a class of cataclysmic variables stars (CVs), which show various types of variability originating in the accretion disk around the white dwarf (for a review, Warner (1995)). Dwarf novae are further classified into three basic types of SS Cyg-type dwarf novae showing normal outbursts, Z Cam-type dwarf novae showing normal outbursts and standstills, and SU UMa-type dwarf novae showing superoutbursts as well as normal outbursts. The difference of photometric behavior in these kinds of stars including nova-like variable stars is essentially explained by the thermal-tidal disk instability scheme (for a review, e.g. Osaki (1996)). Superhumps are oscillations with an amplitude of 0.1–0.5 mag and a period 1–5 % longer than the orbital period () observed only during long, bright (super)outbursts. The superhump is considered to be a beat phenomenon of the orbital motion of the secondary star and the precession of the tidally distorted eccentric disk (Whitehurst, 1988). The eccentricity in such disks plays a key role to keep the accretion disk in the hot state to make a normal outburst evolve into a superoutburst (Osaki, 1989).
Non-magnetic CVs have been suggested to have a bi-modal distribution (Robinson, 1983), while the gap between 2 h and 3 h seems to be filled in the case of magnetic systems (Webbink & Wickramasinghe, 2002). This period gap is explained in the standard theory of the CV evolution as follows: 1) the magnetic braking, which is the mechanism of angular momentum loss, suddenly dies down when the secondary star become fully convective around 3 h, 2) the secondary shrinks into the thermal equilibrium state and the mass transfer stops, 3) the angular-momentum loss is continued by a greatly reduced rate by the gravitational wave radiation, and 4) the secondary fills again its Roche-lobe around 2 h and the CV activity restarts (for a review, King (1988)). Although most of the SU UMa-type dwarf novae are distributed below the period gap, some systems are above (TU Men: Mennickent (1995)) and in (e.g. NY Ser: Nogami et al. (1998b)) the period gap.
The evolution scenario predicts that CVs evolve for the shorter region with the mass transfer rate () reduced, but the orbital period begins to increase after the secondary is degenerated (Paczyński, 1971; Kolb & Baraffe, 1999). Most SU UMa stars are believed to be on this standard path. However, a small group of most active, high- SU UMa stars, called ER UMa stars, has been recently established near the period minimum (Kato & Kunjaya, 1995; Nogami et al., 1995; Kato et al., 1999), and the evolutionary state of ER UMa stars is a serious problem (Nogami, 1998).
Var73 Dra was discovered by Antipin & Pavlenko (2002) on the Moscow archive plates. Their following CCD observations in 2001 August–October proved that this star is an SU UMa-type dwarf nova of at the supermaximum and the recurrence cycle of the normal outburst is 7–8 days. The superhump period () was measured to be 0.0954(1) day, but the possibility of its one-day alias, 0.1053 d, could not be rejected.
Var73 Dra is identified with USNO B1.0 1546–0228545 (), the proper motion of which is not listed in the catalog. The SIMBAD Astronomical Database does not give any cross-identification for this object other than the USNO entry.
We started an intensive photometric-observation campaign of Var73 Dra since 2002 October to reveal behavior of this newly discovered in-the-gap SU UMa-type dwarf nova. The results including two well-covered superoutbursts are reported in this paper.
| Date | HJD-240000 | Exp. Time | N | Comp. | Relative | filter | Instr.† | Superhump | ||
|---|---|---|---|---|---|---|---|---|---|---|
| Start–End | (s) | Star∗ | Mean Mag. | |||||||
| 2002 | August | 29 | 52516.109–52516.257 | 30 | 240 | 1 | 6.5(0.3) | no | A | |
| 30 | 52517.106–52517.206 | 30 | 170 | 1 | 8.0(0.9) | no | A | |||
| September | 1 | 52519.114–52519.213 | 30 | 199 | 1 | 10.7(2.7) | no | A | ||
| 2 | 52520.103–52520.177 | 30 | 105 | 1 | 10.2(2.5) | no | A | |||
| 3 | 52520.104–52520.196 | 30 | 217 | 1 | 10.0(2.4) | no | A | |||
| 4 | 52522.117–52522.215 | 30 | 228 | 1 | 10.5(3.1) | no | A | |||
| 5 | 52523.093–52523.210 | 30 | 277 | 1 | 9.4(2.3) | no | A | |||
| 8 | 52526.088–52526.208 | 30 | 280 | 1 | 9.7(2.0) | no | A | |||
| 9 | 52527.091–52527.190 | 30 | 230 | 1 | 11.6(3.7) | no | A | |||
| 10 | 52528.113–52528.207 | 30 | 216 | 1 | 9.6(2.1) | no | A | |||
| 18 | 52536.052–52536.220 | 30 | 398 | 1 | 11.8(4.2) | no | A | |||
| 19 | 52537.053–52537.135 | 30 | 195 | 1 | 10.1(2.9) | no | A | |||
| 20 | 52538.086–52538.172 | 30 | 203 | 1 | 11.8(4.5) | no | A | |||
| 21 | 52539.123–52539.207 | 30 | 197 | 1 | 9.2(2.0) | no | A | |||
| 24 | 52542.089–52542.214 | 30 | 294 | 1 | 8.0 | no | A | |||
| 25 | 52543.089–52543.128 | 30 | 308 | 1 | 11.2(3.7) | no | A | |||
| October | 2 | 52550.025–52550.117 | 30 | 219 | 1 | 10.6(3.5) | no | A | ||
| 3 | 52551.081–52551.127 | 30 | 106 | 1 | 6.2(1.0) | no | A | |||
| 5 | 52553.023–52553.116 | 30 | 150 | 1 | 5.2(0.2) | no | A | |||
| 9 | 52557.070–52557.130 | 30 | 138 | 1 | 5.2(0.2) | no | A | |||
| 10 | 52557.993–52558.082 | 30 | 211 | 1 | 5.3(0.2) | no | A | |||
| 11 | 52558.993–52559.082 | 30 | 210 | 1 | 5.3(0.3) | no | A | |||
| 12 | 52559.981–52560.081 | 30 | 230 | 1 | 5.4(0.2) | no | A | |||
| 13 | 52560.674–52560.784 | 100 | 80 | 2 | 3.3(0.2) | Clear | B | |||
| 13 | 52560.917–52561.236 | 45 | 309 | 2 | 3.5(0.1) | no | C | |||
| 13 | 52560.931–52561.187 | 40 | 161 | 2 | 3.2(0.2) | no | D | |||
| 13 | 52560.943–52561.238 | 30 | 314 | 2 | 3.0(0.4) | no | E | |||
| 13 | 52560.944–52561.084 | 60 | 139 | 2 | 3.0(0.1) | F | ||||
| 13 | 52560.994–52561.196 | 30 | 477 | 1 | 5.9(0.3) | no | A | |||
| 14 | 52561.600–52561.762 | 120 | 107 | 8 | 1.1(0.1) | G | ||||
| 14 | 52561.885–52562.187 | 60 | 329 | 2 | 3.5(0.1) | F | ||||
| 14 | 52561.926–52562.223 | 40 | 173 | 2 | 3.3(0.4) | no | D | |||
| 14 | 52561.946–52562.225 | 30 | 82 | 2 | 2.9(0.7) | no | E | |||
| 14 | 52562.020–52562.228 | 55 | 151 | 2 | 3.7(0.2) | no | C | |||
| 15 | 52562.532–52562.696 | 120 | 71 | 8 | 1.1(0.1) | G | ||||
| 15 | 52562.616–52562.722 | 60 | 145 | 2 | 3.5(0.1) | Clear | H | |||
| 15 | 52563.044–52563.230 | 30 | 436 | 1 | 6.2(0.3) | no | A | |||
| 15 | 52563.129–52563.266 | 55 | 118 | 2 | 3.7(0.2) | no | C | |||
| 16 | 52563.991–52564.011 | 30 | 45 | 1 | 5.8(0.2) | no | A | |||
| 16 | 52564.147–52564.266 | 115 | 82 | 2 | 3.7(0.3) | no | C | |||
| 17 | 52564.567–52564.666 | 150 | 52 | 8 | 1.3(0.2) | G | ||||
| 17 | 52564.979–52565.174 | 30 | 461 | 1 | 6.4(0.5) | no | A | |||
| 17 | 52565.077–52565.237 | 115 | 103 | 2 | 3.9(0.3) | no | C | |||
| 17 | 52565.401–52565.426 | 120 | 14 | 8 | 16.4(0.1)‡ | K | ||||
| 18 | 52566.202–52566.330 | 90 | 95 | 8 | 16.5(0.1)‡ | K | ||||
| 18 | 52566.256–52566.298 | 70 | 49 | 2 | 3.7(0.1) | I | ||||
| 20 | 52567.541–52567.726 | 150 | 93 | 8 | 2.4(0.2) | G | ||||
| 20 | 52568.236–52568.323 | 180 | 36 | 8 | 18.1(0.2)‡ | K | ||||
| 21 | 52568.979–52569.203 | 30 | 527 | 1 | 9.7(2.4) | no | A | |||
| 21 | 52569.191–52569.227 | 240 | 5 | 8 | 16.7(0.1)‡ | K | ||||
| 24 | 52572.221–52572.242 | 90 | 16 | 8 | 16.7(0.1)‡ | K | ||||
| November | 23 | 52602.066–52602.123 | 30 | 136 | 1 | 10.2(2.7) | no | A | ||
| 26 | 52605.143–52605.150 | 30 | 16 | 1 | 7.4 | no | A | |||
| 27 | 52606.088–52606.105 | 30 | 41 | 1 | 9.8(3.0) | no | A | |||
| 28 | 52607.036–52607.050 | 30 | 34 | 1 | 9.4(2.3) | no | A | |||
| December | 1 | 52609.967–52609.982 | 30 | 36 | 1 | 8.3(1.4) | no | A | ||
| 2 | 52610.977–52610.990 | 30 | 31 | 1 | 8.9(2.1) | no | A | |||
| 6 | 52614.974–52614.993 | 30 | 45 | 1 | 5.3(0.3) | no | A | |||
| 8 | 52617.336–52617.447 | 80 | 97 | 3 | 4.9(0.1) | no | J | |||
| 9 | 52617.528–52617.630 | 150 | 42 | 5 | 0.4(0.1) | G | ||||
| 9 | 52618.173–52618.358 | 200 | 57 | 8 | 15.9(0.1)‡ | K | ||||
| 9 | 52618.241–52618.376 | 80 | 118 | 4 | 3.8(0.1) | no | J | |||
| Date | HJD-240000 | Exp. Time | N | Comp. | Relative | filter | Instr.† | Superhump | ||
| Start–End | (s) | Star∗ | Mean Mag. | |||||||
| 10 | 52618.504–52618.557 | 150 | 30 | 6 | 0.0(0.1) | no | G | |||
| 10 | 52618.871–52619.126 | 60 | 284 | 1 | 5.6(0.3) | no | D | |||
| 10 | 52618.881–52619.097 | 30 | 513 | 1 | 5.4(0.2) | no | A | |||
| 10 | 52619.207–52619.394 | 80 | 175 | 7 | 4.8(0.1) | no | J | |||
| 10 | 52619.235–52619.357 | 200 | 35 | 8 | 15.9(0.1)‡ | K | ||||
| 11 | 52619.856–52619.972 | 60 | 149 | 1 | 5.6(0.3) | no | D | |||
| 11 | 52619.873–52620.099 | 30 | 507 | 1 | 5.4(0.3) | no | A | |||
| 11 | 52620.192–52620.346 | 200 | 56 | 8 | 16.0(0.1)‡ | K | ||||
| 11 | 52620.243–52620.418 | 80 | 157 | 3 | 4.9(0.1) | no | J | |||
| 12 | 52620.872–52621.085 | 60 | 264 | 1 | 5.6(0.3) | no | D | |||
| 12 | 52620.876–52621.099 | 30 | 505 | 1 | 5.4(0.2) | no | A | |||
| 12 | 52621.197–52621.357 | 200 | 59 | 8 | 15.9(0.1)‡ | K | ||||
| 12 | 52621.310–52621.381 | 80 | 58 | 3 | 4.9(0.1) | no | J | |||
| 13 | 52621.882–52622.083 | 60 | 237 | 1 | 5.6(0.3) | no | D | |||
| 14 | 52622.869–52622.970 | 30 | 232 | 1 | 5.5(0.3) | no | A | |||
| 15 | 52623.919–52624.061 | 60 | 50 | 1 | 5.4(0.4) | no | D | |||
| 15 | 52624.158–52624.268 | 120 | 58 | 8 | 16.1(0.2)‡ | L | ||||
| 16 | 52625.173–52625.297 | 180 | 45 | 8 | 16.3(0.2)‡ | L | ||||
| 17 | 52625.919–52626.051 | 60 | 162 | 1 | 6.0(0.3) | no | D | |||
| 18 | 52626.142–52626.153 | 180 | 4 | 8 | 16.2(0.1)‡ | L | ||||
| 23 | 52631.892–52632.049 | 30 | 200 | 1 | 8.3(1.5) | no | A | |||
| 24 | 52632.956–52633.050 | 30 | 73 | 1 | 8.7(2.2) | no | A | |||
| 26 | 52634.923–52635.043 | 30 | 107 | 1 | 10.5(1.7) | no | E | |||
| 27 | 52635.933–52636.038 | 30 | 56 | 1 | 7.5 | no | E | |||
| 30 | 52638.984–52639.023 | 30 | 51 | 1 | 8.6(2.3) | no | A | |||
| 2003 | January | 6 | 52646.000–52646.058 | 30 | 139 | 1 | 7.4 | no | A | |
| 7 | 52646.934–52647.055 | 30 | 130 | 1 | 7.5 | no | A | |||
| 8 | 52647.933–52648.041 | 30 | 115 | 1 | 7.5 | no | A | |||
| 11 | 52650.935–52651.038 | 30 | 73 | 1 | 5.6(0.4) | no | A | |||
| 12 | 52651.982–52652.033 | 30 | 84 | 1 | 6.7(0.9) | no | A | |||
| 13 | 52652.990–52653.042 | 30 | 65 | 1 | 7.3(1.7) | no | A | |||
| 16 | 52656.023–52656.059 | 30 | 85 | 1 | 6.4 | no | A | |||
| 17 | 52656.982–52657.027 | 30 | 29 | 1 | 6.0 | no | A | |||
| 21 | 52660.894–52660.909 | 30 | 16 | 1 | 11.1(3.4) | no | A | |||
| 24 | 52663.931–52663.946 | 30 | 1 | 1 | – | no | A | |||
| 28 | 52667.954–52663.959 | 30 | 2 | 1 | 7.7 | no | A | |||
| February | 4 | 52674.892–52674.898 | 30 | 9 | 1 | 6.9(0.9) | no | A | ||
| 5 | 52675.941–52675.948 | 30 | 3 | 1 | 6.1(0.9) | no | A | |||
| 6 | 52676.900–52676.905 | 30 | 3 | 1 | 8.1 | no | A | |||
| 7 | 52677.903–52677.908 | 30 | 6 | 1 | 7.8(1.2) | no | A | |||
| 11 | 52682.326–52682.368 | 30 | 86 | 1 | 5.3(0.1) | no | A | |||
| 12 | 52683.350–52683.382 | 30 | 75 | 1 | 5.3(0.2) | no | A | |||
| 13 | 52684.296–52684.384 | 30 | 209 | 1 | 5.4(0.2) | no | A | |||
| 14 | 52685.290–52685.383 | 30 | 216 | 1 | 5.4(0.2) | no | A | |||
| 15 | 52685.554–52685.754 | 60 | 225 | 2 | 3.3(0.1) | no | J | |||
| 17 | 52687.615–52687.746 | 80 | 122 | 2 | 3.3(0.2) | no | J | |||
| ∗1: USNO B1.0 4241–00865–1, , 2: USNO B1.0 1546–0228620, , | ||||||||||
| 3: USNO B1.0 4241–01053–1, , 4: USNO B1.0 1545–0231804, , | ||||||||||
| 5: USNO B1.0 1545–0231905, , 6: USNO B1.0 1545–0231894, , | ||||||||||
| 7: USNO B1.0 4241–01806–1, , 8: USNO B1.0 1545–0228537, | ||||||||||
| † A: 30-cm tel. + SBIG ST-7E (Kyoto, Japan), B: 12.5-inch tel. + SBIG ST-7E (Alberta, Canada), C: 30-cm tel. + SBIG ST-9E | ||||||||||
| (Okayama, Japan), D: 25-cm tel. + Apogee AP6E (Saitama, Japan), E: 20-cm tel. + Apogee AP7p (Saitama, Japan), F: 60-cm | ||||||||||
| tel. + PixCellent S/T 00-3194 (SITe 003AB) (Hida, Japan), G: 36-cm tel. + SBIG ST-10XME, (Indiana, USA), H: 44-cm tel. | ||||||||||
| + Genesis 16#90 (KAF 1602e) (California, USA), I: 80-cm tel. + SBIG ST-9 (Campo Catino Observatory, Italy), J: 35-cm tel. | ||||||||||
| + SBIG ST-7 (Landen, Belgium), K: 60-cm tel. + SBIG ST-7 (Crimea, Ukraine), L: 38-cm tel. + SBIG ST-7 (Crimea, Ukraine) | ||||||||||
| ‡ The magnitude is adjusted to the Johnson magnitude, using of the comparison star 9 (Antipin & Pavlenko, 2002). | ||||||||||
2 Observations
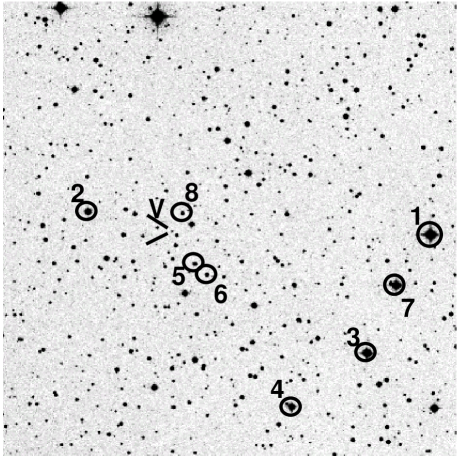
The observations were carried out at ten sites with twelve sets of instruments. The log of the observations and the instruments are summarized in Table 1. Figure 1 is a finding chart where the comparison stars are marked.
All the frames obtained at Hida and Okayama, and frames at Saitama on 2002 October 14 were reduced by the aperture photometry package in IRAF111IRAF is distributed by the National Optical Astronomy Observatories for Research in Astronomy, Inc. under cooperative agreement with the National Science Foundation., after de-biasing (Hida frames) or dark-subtraction (Okayama and Saitama frames), and flat-fielding. The Kyoto frames and the rest of the Saitama frames were processed by the PSF photometry package developed by one of the authors (TK). All frames obtained at the DeKalb Observatory, CBA Belgium, and CBA Concord were reduced by aperture photometry after dark subtraction and flat-fielding, using the AIP4WIN software by Berry and Burnell222http://www.willbell.com/aip/index.htm. The Crimean images were dark subtracted, flat-fielded and analyzed with the profile/aperture photometry package developed by one of the authors (VPG).
3 Results

The long-term light curve is shown Fig. 2. During our monitoring, Var73 Dra gave rise to three superoutbursts: the first was in the rising phase on HJD 2452553, the second began on some day between HJD 2452611 and HJD 2452614 (see Table 1), the precursor of the third superoutburst was caught on HJD 2552674. This fact proves the supercycle of Var73 Dra to be 60 days. While two normal outbursts were caught at the start and around HJD 2452650 in the long-term light curve shown in Fig. 2, our observations reject the possibility of the recurrence cycle of the normal outburst shorter than 15 days.

To search periodic variability in quiescence, a period analysis by the Phase Dispersion Minimization (PDM) method (Stellingwerf, 1978) was performed for the data obtained between 2002 August 30 and October 3, after excluding points over 3 far from the daily mean magnitude and subtracting the daily mean magnitude from the daily data sets. Fig. 3 exhibits the resultant theta diagram. The sharp peak points to the period of 0.10424(3) d. The error of the period was estimated using the Lafler-Kinman class of methods, as applied by Fernie (1989). The folded light curve have a strong peak at and a marginal one around .


Fig. 4 shows examples of superhumps observed during the first superoutburst. After selecting data sets with errors small enough to use for the period analysis (indicated by in Table 1) and subtracting the mean magnitude from each data set, we applied the PDM period analysis to the processed data sets. The theta diagram and the mean superhump light curve is given in Fig. 5. The superhump period of 0.104885(93) d we obtained affirms the longer candidate proposed by Antipin & Pavlenko (2002), and assures that Var73 Dra is an in-the-gap SU UMa-type dwarf nova with the second longest , next to TU Men (Stolz & Schoembs, 1984), almost equal to that of NY Ser (Nogami et al., 1998b).
| HJD2452500 | E | OC1∗ | OC2† |
|---|---|---|---|
| 61.0208(22) | 0 | 0.0012 | 0.0010 |
| 61.1133(18) | 1 | 0.0009 | 0.0011 |
| 61.6372(20) | 6 | 0.0004 | 0.0020 |
| 62.5826(24) | 15 | 0.0028 | 0.0027 |
| 62.6823(16) | 16 | 0.0021 | 0.0016 |
| ∗ Using Eq. (1). | |||
| † Using Eq. (2). | |||

We extracted the timings of the superhump maxima by fitting the average superhump light curve in Fig. 5. The results are listed in Table 2. The cycle count was set to be 0 at the first superhump maximum measured. A linear regression and a parabolic fit to the times give the following equations:
| (1) |
and
| (2) | |||||
The ordinate of Fig. 6 represents the deviation of the observed timing from the expected one by Eq. (1), , and the curve is drawn based on Eq. (2). We could not significantly determine the change rate of the superhump period.

Fig. 7 displays the result of the PDM period analysis for the data obtained during the second superoutburst and the average superhump light curve. We used the data marked by in Table 1 also for this second analysis. The superhump period of 0.10623(16) is slightly longer than that during the first superoutburst. No apparent signal of a secondary hump around the phase of 0.5 is seen.
| HJD2452600 | E | OC1∗ | OC2† |
|---|---|---|---|
| 17.3991(34) | 0 | 0.0525 | 0.0094 |
| 18.5286(11) | 10 | 0.0002 | 0.0070 |
| 19.2918(45) | 17 | 0.0096 | 0.0017 |
| 19.2993(40) | 17 | 0.0171 | 0.0092 |
| 19.9457(56) | 23 | 0.0174 | 0.0038 |
| 20.0461(83) | 24 | 0.0102 | 0.0038 |
| 20.2696(26) | 26 | 0.0183 | 0.0042 |
| 20.3792(39) | 27 | 0.0202 | 0.0063 |
| 20.9048(51) | 32 | 0.0074 | 0.0027 |
| 21.0112(56) | 33 | 0.0061 | 0.0027 |
| 21.2189(26) | 35 | 0.0015 | 0.0073 |
| 21.3281(38) | 36 | 0.0000 | 0.0040 |
| 21.3289(62) | 36 | 0.0008 | 0.0032 |
| 21.9520(84) | 42 | 0.0222 | 0.0115 |
| 22.9117(56) | 51 | 0.0316 | 0.0131 |
| ∗ Using Eq. (3). | |||
| † Using Eq. (4). | |||

The timings of the superhump maxima were obtained for this superoutburst as before (Table 3). A linear regression to these timings yields the following ephemeris:
| (3) |
The calculated using Eq. (3) is displayed in Fig. 8. The diagram clearly shows the decrease in the superhump period. Fit to a quadratic equation of the same timings gives:
| (4) | |||||
The quadratic term means that the superhump period decreased with a rate of = , which is one order of magnitude larger than the largest values known (see Kato et al. (2003c)).
4 Discussion
4.1 Two superhump periods
We obtained two superhump periods: 0.104885(93) d during the first superoutburst (hereafter 1), and 0.10623(16) d during the second superoutburst (hereafter 2). The difference between 1 and 2 must result from difference of the observed phase in the course of the superoutburst.
The first superoutburst is estimated to have attained to its maximum brightness at HJD 2452552.0 (1.0) from Table 1. The data used for the 1 analysis were therefore taken between the 6(1)th day and the 14(1)th day from the supermaximum. In the case of the second superoutburst, the maximum of the outburst was reached somewhen between HJD 2452611.0 and 2452615.0. Thus the data used for the 2 analysis were taken between the 4(2)th day and the 9(2)th day from the onset. Therefore the “mid” day of the observed phase during the second superoutburst (the 7(2)th day) is earlier than that during the first superoutburst (the 10(1) day). The extremely large change rate observed during the second superoutburst can easily yield the difference between two superhump periods.
It should be also noted that seemed to decrease with a larger rate in an earlier phase. This trend is suggested by the fact that the change rate of 2 was derived from the superhump-maximum times between 4(2)th day and 10(2)th day, in contrast to that that of 1 was derived from the timings of the superhump maximum between 9(1)th day and 10(1)th day from the supermaximum.
4.2 Orbital period
We photometrically detected coherent modulations with a period of 0.10424(3) d in quiescence. This period is slightly shorter than the superhump periods 1 and 2, and is naturally attributed to the orbital period, thus. Confirmation by spectroscopic observations is, however, desired, since our quiescence data contain large errors and the actual error of the period derived is perhaps larger than the noted one statistically calculated. The orbital period of 0.10424 d is the second longest among those of SU UMa stars with the orbital period measured, next to 0.1172 d of TU Men (Mennickent, 1995), and places Var73 Dra at the midst of the period gap.
The superhump excess is 0.6% for 1 or 1.9% for 2, respectively. It is generally known that there is a robust relationship that the superhump excess smoothly increases with (see e.g. Patterson (1998)). This relationship is well explainable in the disk instability model in that a large superhump excess suggests a large accretion-disk radius in a long- system with a large mass ratio (). While Var73 Dra is expected to have 5–7% from this relation, the derived values of corresponds to those of SU UMa stars with a period about 0.06 d. This implies that Var73 Dra has a small mass ratio, although theoretical calculations on the CV evolution propose a high mass ratio for a CV in the period gap (e.g. Howell et al. (2001)). Var73 Dra may be the first object which breaks the – relation[Patterson (1998) discusses this relationship after correction of , taking period changes into account, to the value 4 days after superhump emergence. The same correction does not have significant effect on our results.]. This problem urges spectroscopic determination of as well as . Note that the modulations in quiescence may be attributed to permanent superhumps, as discussed later.
4.3 Derivative of the superhump period
Until mid 1990s, the superhump period was considered to monotonically decrease or at least be constant after full development (see e.g. Warner (1985); Patterson et al. (1993)). This phenomenon was basically explained in the disk instability scheme by that the precession frequency of the eccentric accretion disk decreases due to shrinkage of the disk radius Osaki (1985), or propagation of the eccentric wave to the inner disk Lubow (1992). Elongation of was, however, first observed during the 1995 superoutburst of AL Com (Nogami et al., 1997). Following this discovery, similar behavior has been found in several SU UMa stars: V485 Cen (Olech, 1997), EG Cnc (Kato et al., 1997), SW UMa (Semeniuk et al., 1997; Nogami et al., 1998a), V1028 Cyg (Baba et al., 2000), WX Cet (Kato et al., 2001a), and HV Vir (Kato et al., 2001b). These stars are, however, concentrated around the period minimum in the distribution, and SU UMa stars with relatively long have been confirmed to show decrease with a similar rate of (see Kato et al. (2003c)). Very recently, Kato et al. (2003c) reported large negative derivatives of in V877 Ara ( = 1.5(0.2) 10-4, = 0.08411(2) d) and KK Tel ( = 3.7(0.4) 10-4, = 0.08808 d), and pointed out a diversity of in long-period SU UMa-type dwarf novae.
We revealed that in Var73 Dra during the second superoutburst was still about one order of magnitude larger than these two records. Kato et al. (2001a) and Kato et al. (2003c) proposed a possibility that is related to the mass transfer rate: SU UMa stars with larger tend to have larger mass transfer rates, and those with close to and smaller than zero have small . The quite short supercycle length of about 60 d suggests a high in the present object (discussed later), which may support this possiblity. It should be, however, worth noting that Kato et al. (2003a) found in BF Ara, an SU UMa star supposed to have a rather large .
4.4 Outburst behavior
The three superoutbursts we caught suggests that Var73 Dra steadily repeats superoutbursts with a supercycle of 60 d. This value is shorter than the shorterst one known so far in usual SU UMa stars (89.4 d in BF Ara: Kato et al. (2003a)), and close to 19–50 d of ER UMa stars.
The disk instability model predicts that the supercycle is shorter in an SU UMa-type star with a highter . Reproduction of the light curves of ER UM stars was successfully done by Osaki (1995a) by assuming a mass transfer rate about ten times higher than that in ordinary SU UMa stars (see also Osaki (1995b)), although it has not still been clear why ER UMa stars have such high mass transfer rate (Nogami, 1998). Var73 Dra is expected to also have a very high mass transfer rate because of its extraordinary short supercycle (Ichikawa & Osaki, 1994). This condition may be achieved if this star is in the short, high- phase just after getting semi-detached and starting mass transfer. This interpretation provide an explanation to the problem on the evolutionary status of this star that mass transfer is supposed to be stopped (or seriously reduced) for evolution in the period gap in the currently standard evolution theory.
This simple view, however, faces a difficulty of lack of the normal outburst in Var73 Dra. We caught two superoutbursts and two normal outbursts in the course of monitoring. The recurrence cycle of the normal outburst and the supercycle are estimated to be over 15 days and 60 days, respectively. In contrast, the normal-outburst recurrence cycle is expected to be 8 days for an SU UMa star with a supercycle of 60 days based on the model reviewed by Osaki (1996).
The normal-outburst cycle was, however, 7–8 d by Antipin & Pavlenko (2002) from their observations in 2001 August–October. The supercycle at that time was longer than at least 70 d, judging from Fig. 3 in Antipin & Pavlenko (2002). These facts clearly indicate a chage of the outburst activity between 2001 and 2002. Similar changes have been reported in recent years, such as in DI UMa (Fried et al., 1999), SU UMa (Rosenzweig et al. (2000); Kato (2002)), V1113 Cyg (Kato, 2001), V503 Cyg (Kato et al., 2002), and DM Lyr (Nogami et al., 2003). Among thse stars, only DM Lyr showed an anti-correlation: the recurrence cycle of the normal outburst decreased, and the supercycle increased, while Var73 Dra showed a reverse anti-correlation: the recurrence cycle of the normal outburst increased, and the supercycle decreased. Such behavior can not be explained by variation of the mass transfer rate due to e.g. the solar-type cycle of the secondary star (e.g. Ak et al. (2001)). Nogami et al. (2003) proposed for DM Lyr that a machanism to reduce the number of the normal outbursts may work when the superoutbursts more frequently occur and another mechanism to shorten the recurrence time of the normal outburst may work when the superoutburst less frequently takes place. The same idea may be applicable to Var73 Dra. Closer monitoring to avoid to miss rather faint normal outbursts (15 mag) is needed to check variabilities of the recurrence cycles of the normal outburst and superoutburst.
4.5 Related to ER UMa stars?
Two problems regarding ER UMa stars to be solved are the extraordinary large mass transfer rates for their short orbital periods and the evolution path, as mentioned above. One of the keys to the problems is discovery of ER UMa counterparts with longer .
Whether Var73 Dra is an object related to ER UMa stars is in interesting subject. While the supercycle of 60 d is certainly very close to those of ER UMa stars, our observations give a negative support to this question in terms of the duty cycle of the superoutburst and the recurrence cycle of the normal outburst. The duration of the supercycle of Var73 Dra is at most 15 d (Table 1), a normal one for an SU UMa system, and the duty cycle of the superoutburst in one supercycle is 25%, while the duty cycle is 30–50% in ER UMa stars. The normal outburst is 1 or at most a few in one supercycle, quite infrequent for an ER UMa analog.
New interpretations on how ER UMa stars most frequently give rise to superoutbursts have been recently published, which are based on the disk instability scheme, but assuming decoupling of the thermal and tidal instability (Hellier, 2001), or the effects of irradiation (Buat-Ménard & Hameury, 2002). Both models predict superhumps observed in quiescence. The modulations observed here in quiescence may be superhumps, which could give a solution to the problem that the superhump excess in Var73 Dra is too small for this long . A small mass ratio is, however, a basic assumption in both models. Measurement of the orbital period and the mass ratio in this system has a significant effect also on this matter.
Kato et al. (2003b) discovered a peculiar behavior of superhumps in ER UMa which is a phase shift of 0.5 before entering the plateau phase of the superoutburst, and interpreted that the (normal) superhumps are seen at the very early phase of the superoutburst and the modulations observed during the plateau phase correspond to ‘late’ superhumps in SU UMa stars. To trace the superhump evolution throughout a superoutburst is important to clarify the superhumps in Var73 Dra exhibit the normal SU UMa-type behavior or the ER UMa-type one.
Acknowledgements.
This research has made use of the USNOFS Image and Catalogue Archive operated by the United States Naval Observatory, Flagstaff Station (http://www.nofs.navy.mil/data/fchpix/), and the SIMBAD database, operated at CDS, Strasbourg, France (http://simbad.u-strasbg.fr/Simbad). GM acknowledges the support of Software Bisque and Santa Barbara Instrument Group. This work is partly supported by a grant-in aid (13640239) from the Japanese Ministry of Education, Culture, Sports, Science and Technology (TK), and by a Research Fellowship of the Japan Society for the Promotion of Science for Young Scientists (MU).References
- Ak et al. (2001) Ak, T., Ozkan, M. T., & Mattei, J. A. 2001, A&A, 369, 882
- Antipin & Pavlenko (2002) Antipin, S. V. & Pavlenko, E. P. 2002, A&A, 391, 565
- Baba et al. (2000) Baba, H., Kato, T., Nogami, D., et al. 2000, PASJ, 52, 429
- Buat-Ménard & Hameury (2002) Buat-Ménard, V. & Hameury, J.-M. 2002, A&A, 386, 891
- Fernie (1989) Fernie, J. D. 1989, PASP, 101, 225
- Fried et al. (1999) Fried, R. E., Kemp, J., Patterson, J., et al. 1999, PASP, 111, 1275
- Hellier (2001) Hellier, C. 2001, PASP, 113, 469
- Howell et al. (2001) Howell, S. B., Nelson, L. A., & Rappaport, S. 2001, ApJ, 550, 897
- Ichikawa & Osaki (1994) Ichikawa, S. & Osaki, Y. 1994, in Theory of Accretion Disks-2, ed. W. J. Duschl, J. Frank, F. Meyer, E. Meyer-Hofmeister, & W. M. Tscharnuter (Dordrecht: Kluwer Academic Publishers), 169
- Kato (2001) Kato, T. 2001, Inf. Bull. Variable Stars, 5110
- Kato (2002) Kato, T. 2002, A&A, 384, 206
- Kato et al. (2003a) Kato, T., Bolt, G., Nelson, P., et al. 2003a, MNRAS, in press (astro-ph/0301565)
- Kato et al. (2002) Kato, T., Ishioka, R., & Uemura, M. 2002, PASJ, 54, 1029
- Kato & Kunjaya (1995) Kato, T. & Kunjaya, C. 1995, PASJ, 47, 163
- Kato et al. (2001a) Kato, T., Matsumoto, K., Nogami, D., Morikawa, K., & Kiyota, S. 2001a, PASJ, 53, 893
- Kato et al. (1999) Kato, T., Nogami, D., Baba, H., et al. 1999, in Disk Instabilities in Close Binary Systems, ed. S. Mineshige & J. C. Wheeler (Tokyo: Universal Academy Press), 45
- Kato et al. (2003b) Kato, T., Nogami, D., & Masuda, S. 2003b, PASJ, in press (astro-ph/0211520)
- Kato et al. (1997) Kato, T., Nogami, D., Matsumoto, K., & Baba, H. 1997, Tech. rep.
- Kato et al. (2003c) Kato, T., Santallo, S., Bolt, G., et al. 2003c, MNRAS, 339, 861
- Kato et al. (2001b) Kato, T., Sekine, Y., & Hirata, R. 2001b, PASJ, 53, 1191
- King (1988) King, A. R. 1988, QJRAS, 29, 1
- Kolb & Baraffe (1999) Kolb, U. & Baraffe, I. 1999, MNRAS, 309, 1034
- Lubow (1992) Lubow, S. H. 1992, ApJ, 401, 317
- Mennickent (1995) Mennickent, R. E. 1995, A&A, 294, 126
- Nogami (1998) Nogami, D. 1998, in ASP Conf. Ser. 137, Wild Stars in the Old West, ed. S. Howell, E. Kuulkers, & C. Woodward (San Francisco: ASP), 495
- Nogami et al. (1998a) Nogami, D., Baba, H., Kato, T., & Novák, R. 1998a, PASJ, 50, 297
- Nogami et al. (2003) Nogami, D., Baba, H., Matsumoto, K., & Kato, T. 2003, PASJ, in press (astro-ph/0301036)
- Nogami et al. (1998b) Nogami, D., Kato, T., Baba, H., & Masuda, S. 1998b, PASJ, 50, L1
- Nogami et al. (1997) Nogami, D., Kato, T., Baba, H., et al. 1997, ApJ, 490, 840
- Nogami et al. (1995) Nogami, D., Kato, T., Masuda, S., et al. 1995, PASJ, 47, 897
- Olech (1997) Olech, A. 1997, Acta Astron., 47, 281
- Osaki (1985) Osaki, Y. 1985, A&A, 144, 369
- Osaki (1989) Osaki, Y. 1989, PASJ, 41, 1005
- Osaki (1995a) Osaki, Y. 1995a, PASJ, 47, L11
- Osaki (1995b) Osaki, Y. 1995b, PASJ, 47, L25
- Osaki (1996) Osaki, Y. 1996, PASP, 108, 39
- Paczyński (1971) Paczyński, B. 1971, ARA&A, 9, 183
- Patterson (1998) Patterson, J. 1998, PASP, 110, 1132
- Patterson et al. (1993) Patterson, J., Bond, H. E., Grauer, A. D., Shafter, A. W., & Mattei, J. A. 1993, PASP, 105, 69
- Robinson (1983) Robinson, E. L. 1983, in Cataclysmic Variables and Related Objects, ed. M. Livio & G. Shaviv (D. Reidel Publishing Company, Dordrecht), 1
- Rosenzweig et al. (2000) Rosenzweig, P., Mattei, J., Kafka, S., Turner, G. W., & Honeycutt, R. K. 2000, PASP, 112, 632
- Semeniuk et al. (1997) Semeniuk, I., Olech, A., Kwast, T., & Nalezyty, M. 1997, Acta Astron., 47, 201
- Stellingwerf (1978) Stellingwerf, R. F. 1978, ApJ, 224, 953
- Stolz & Schoembs (1984) Stolz, B. & Schoembs, R. 1984, A&A, 132, 187
- Warner (1985) Warner, B. 1985, in Interacting Binaries, ed. P. P. Eggelton & J. E. Pringle (Dordrecht: D. Reidel Publishing Company), 367
- Warner (1995) Warner, B. 1995, Cataclysmic Variable Stars (Cambridge: Cambridge University Press)
- Webbink & Wickramasinghe (2002) Webbink, R. F. & Wickramasinghe, D. T. 2002, MNRAS, 335, 1
- Whitehurst (1988) Whitehurst, R. 1988, MNRAS, 232, 35