DETERMINATION OF REDDENING AND EXTINCTION DUE TO DUST IN GALAXY CLUSTERS
Abstract
Existing observations are consistent with rich clusters of galaxies having no dust on Mpc scales, while galaxy groups most probably do have dust distributed over Mpc scales. Dust in groups accounts for the observed redshift asymmetries of their galaxy distributions, and about mag of reddening. Motivated by these results, we develop a new technique for determining the degree of reddening and extinction due to widely-distributed dust in nearby moderately rich and poor galaxy clusters. The method compares the color-magnitude plane distributions of galaxies from cluster and control regions on the sky, where control regions are assumed to be unaffected by dust. The method is statistical in nature; it can distinguish between uniformly, non-uniformly, and clumpily distributed dust, and can determine the amount of reddening and obscuration without a priori assuming an ratio. We apply the method to nearby, , medium rich and poor APM galaxy clusters. We detect no dust in these on Mpc scales (we assume ), and derive 99% confidence upper limits on extinction of and reddening of which corresponds to . We test the method using clusters whose galaxies have been artificially reddened and obscured by various amounts, and conclude that it robustly recovers the input values for reddening, its distribution, and the ratio of total-to-selective extinction. The method can be applied to any set of galaxy clusters or groups constructed out of homogeneous and uniform two-color galaxy catalogs.
1 Introduction
Dust inside a rich galaxy cluster’s Intracluster Medium (ICM) would be subjected to harsh conditions. Parameters of the hot, X-ray component of the ICM in galaxy clusters have been measured by numerous studies. Typical temperatures are generally observed in the range , which is equivalent to thermal energies of keV (Bahcall, 1999). Grains, which have typical molecular bonding potentials on the order of a few tenths to a few eV, are likely to dissociate by sputtering due to collisions with thermal electrons. The dust grain sputtering timescales are dependent on the size of the grains, and the electron density at a given location in the ICM, :
| (1) |
for graphite, silicate or iron grains (Draine & Salpeter, 1979), Electron densities on the order of have been measured (Jones & Forman, 1992), so typical sputtering timescales are on the order of The shortest sputtering timescales correspond to grains located in the densest regions of the ICM. To estimate whether there will be any dust in rich clusters, dust destruction timescales have to be compared to dust injection timescales. Dust could conceivably be introduced into the ICM through several processes including ram pressure stripping of galaxies as they travel through the ICM, the accretion of primordial dust, galaxy or cluster mergers and collisions, blowout from galaxies that experience multiple supernovæ or intense starbursts, or cooling flows (Popescu et al., 2000). Many of these processes have timescales on the order of , which is comparable to the longest sputtering timescales. Each of these modes of dust insertion affect different spatial scales and locations within clusters. For example, cooling flows occur near the central regions of a cluster’s gravitational potential while accretion processes such as mergers affect the outer portions of the ICM. Furthermore, hydrodynamical processes may allow dust to reside in clumps, which would be self-shielded from ionizing radiation and electron collisions, resulting in a longer effective sputtering timescale and a smaller covering factor. Therefore, the amount and distribution of dust in a rich galaxy cluster may also be dependent on the history of the various deposition processes in an individual cluster.
The nature of the extinction and reddening from dust in clusters may also depend heavily on environment because the lifetimes of grains with some types of chemistries and structures may be longer than the lifetimes of others under the same ambient conditions. In addition, deposition processes could act as filters. Grain acceleration by radiation pressure from starlight, for example, could impose a bias of grain radius and mass on particles entering the ICM, from galaxies. In process, this could result in differences between the initial and resulting extinction curves of the affect grain populations. Certainly, the ratio of total-to-selective extinction, is known to vary in the range within the Milky Way (Mathis, 1990) and more strongly in other galaxies, where (Falco et al., 1999). These facts together with the uncertainties in grain models for dust in the ICM require a search for dust in the ICM to be flexible in terms of detecting combinations of varying degrees of reddening and obscuration.
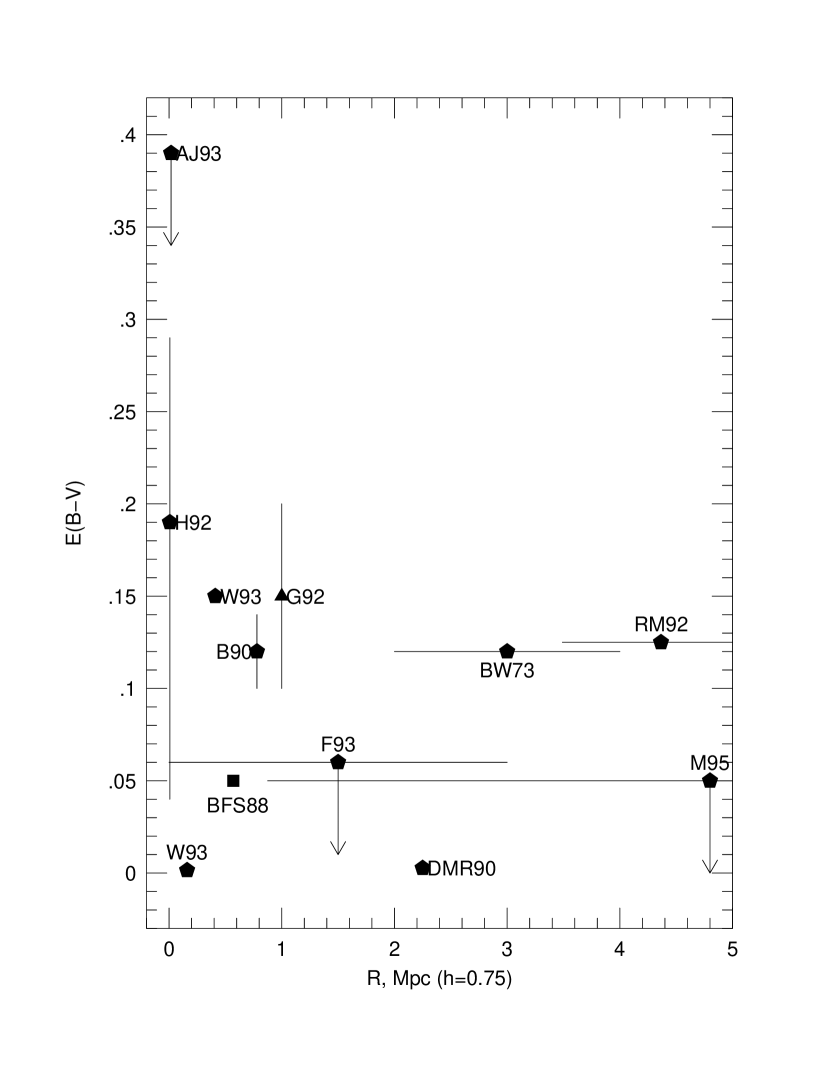
Figure 1 gives a compilation of the results from prior searches for dust in rich and poor galaxy clusters, as well as groups. There is some observational evidence for the existence of dust in the central regions of clusters. For example, using IRAS images of 56 clusters, Wise et al. (1993) found two clusters with Far-IR color excesses that are probably due to dust. Meanwhile, Hu (1992) derived an average value of the differential reddening of on the basis of observed UV-to-optical emission line ratios (LyH) in a sample of 10 Abell cooling flow clusters. Furthermore, measurements of X-ray spectra have indicated surprisingly high metallicities, , in clusters (Bahcall, 1999; Arnaud & Mushotzky, 1998; Voit & Donahue, 1995). Yet it should also be noted that Annis & Jewitt (1993) failed to detect any submillimeter dust emission from the central few tens of kpc in 11 cooling flow clusters.
Evidence for dust in regions outside the central Mpc is inconclusive. Past searches for dust on Mpc scales incorporated several techniques. Zwicky (1962), Karachentsev & Lipovetskii (1969), de Vaucouleurs, de Vaucouleurs & Corwin (1972), and Bogart & Wagoner (1973) looked for the extinction of light from distant galaxy clusters by intervening foreground clusters. The observed depletion in the number density of background clusters led Zwicky (1962) to suggest that there may be as many as 0.4 magnitudes of extinction in the Coma Cluster. Bogart & Wagoner (1973) estimate that to explain the dearth of background clusters, foreground clusters must produce about 0.12 magnitudes of reddening over radii of few Mpc. However, the results of these studies could have been affected by human bias: Distant galaxy clusters are much harder to detect if they are superimposed on foreground clusters, so the apparent depletion of distant clusters in the directions of nearby clusters could be due to causes other than dust.
Romani & Maoz (1992) looked at the apparent anti-correlation of high-redshift QSOs with nearby Abell clusters. They measured a deficit of in the quasar number counts within 60′ of rich clusters and noted that such a dearth of QSOs can be explained by of extinction in these clusters. However, a follow-up work by Maoz (1995) reached a different conclusion. He found no difference in the colors of QSOs found within in projection from Abell clusters to those farther than away and he placed a confidence upper limit on reddening of . Biviano et al. (1990) found that blue Tully-Fisher distances to Virgo cluster spirals correlate tightly with their color excess, while no such correlation was seen in field spirals. They suggest that intracluster dust with reddening of magnitudes would make more distant galaxies within Virgo appear redder. However, Ferguson (1993) analyzed fits to the correlations between colors and the reddening-insensitive Mg2 index (the ratio of the Mg line flux to the adjacent continuum flux that straddles the line) for a sample of elliptical galaxies and found no evidence for reddening in either the Virgo or the Coma clusters. He placed confidence upper limits of and for the Virgo and Coma clusters, respectively. Dwek, Rephaeli & Mather (1990) were unable to detect any IR emission from dust in the Coma Cluster, despite the earlier optical estimates by Zwicky (1962). In fact, the upper limit placed on the emission was times lower than the theoretical estimates of Voshchinnikov & Khersonskij (1984), which were based on the interactions between dust and the hot ICM.
While the amount of dust in extended regions of rich clusters is consistent with zero, there is strong evidence that dust exists in galaxy groups, on Mpc scales. The distributions of group galaxies in redshift are known to be skewed towards positive velocities (Girardi et al., 1992). These redshift asymmetries are most easily explained if galaxy groups are assumed to be in the process of collapse, and the near-side infalling galaxies (redshifted with respect to group center) are less obscured, and hence more numerous, than the far-side (blueshifted) galaxies. The color excess vs. redshift distribution of group galaxies confirms this scenario. A very different type of observation could also suggest the presence of dust in groups. Boyle, Fong & Shanks (1988) find that UV-excess selected sources (mostly QSOs) are anti-correlated with poor galaxy clusters and groups. They estimate that this could be explained by absorption of extending over . These values are compatible with the amount and the range of distribution of dust determined from redshift asymmetries by Girardi et al. (1992). However, the Boyle, Fong & Shanks (1988) observations could well be the result of weak gravitational lensing of faint QSOs with shallow number counts slope (Croom & Shanks, 1999; Myers, A.D. et al., 2002).
Motivated by these observations we decided to search for dust in the population of objects intermediate between rich clusters and groups, i.e. moderately rich and poor clusters of galaxies. To that end we develop a new method for determining the reddening and extinction due to dust in galaxy clusters, and apply it to a set of APM galaxy clusters.
Even a relatively small amount of extinction in galaxy clusters would have profound implications for a wide variety of fields. Significant amounts of extant dust would obscure background objects, and could skew statistics in studies that involve collections of distant galaxies, quasars and supernovæ. Observations of light curves of high-redshift Type Ia Supernovæ, for example, have shown that these supernovæ are generally dimmer in comparison with nearer ones than one would expect if one were to assume an Open or Einstein-de Sitter Universe (Perlmutter et al., 1998; Reiss et al., 1998). This has been attributed to the existence of a cosmological constant, , although Aguirre (1999) has suggested that this could be the result of extinction by intervening grey dust.
Studies of weak lensing (anti-)correlations between foreground galaxies and high redshift QSOs would also be affected. Turner (1980) and Canizares (1981) were the first to point out that magnification bias may create statistical associations between foreground galaxies and high-redshift QSOs. The presence of dust in clusters would tend to decrease the number of background QSOs in a flux limited sample, thus complicating the interpretation of results (Myers, A.D. et al., 2002; Rodrigues-Williams & Hogan, 1994).
2 Data
2.1 APM Catalogue
Our galaxy data originated from APM measurements of 30 UKST sky survey fields. We selected a region of the sky away from the plane of the Galaxy, covering an area that spans and which is roughly a range of and in Galactic coordinates. Each of these UKST fields contain photometry that was measured digitally by the Automated Plate Machine at the University of Cambridge (Irwin, 1996), from the UKST and the UKST SES R sky surveys, which have limiting magnitudes of 22.5 and 21 magnitudes, respectively, and are complete, roughly, to magnitudes of and . Vignetting reduces the plate density of galaxies. Its effects become more pronounced with distance away from plate center, but become severe only beyond from the center. As a result, we selected only those galaxies that lie within of the centers of their respective plates for our analysis. Objects for our study must have been detected and identified as ‘galaxies’ in both the and bands.
2.2 APM Clusters
The APM Galaxy Cluster Catalogue consists of clusters selected on the basis of spatial overdensities in the APM Galaxy Catalogue (Dalton et al., 1997). Centers of galaxy clusters were found using a percolation technique in which all galaxy pairs with angular separations on the fields less than 0.7 times the mean separation were linked and assigned to the same group. The centroid of galaxy groups containing more than 20 galaxies was considered a candidate cluster center. A starting value for the estimated redshift of each cluster was assumed, which gave estimates of various ordinal galaxy magnitudes (e.g. the or the brightest galaxies in the cluster). These were adjusted along with cluster richness, redshift, and centroid in an iterative routine, until convergence was achieved. The result is a catalogue of galaxy clusters in which each cluster was selected on the bases of an impartial empirical algorithm, rather than by human hand.
The APM clusters have a correlation length of approximately Mpc, which is times the correlation length of Abell Clusters (Dalton et al., 1994, 1997). This implies a spatial density of APM clusters times greater than that of Abell clusters, hence APM clusters are moderately rich to poor. We have selected for our sample those clusters that lie on the UKST fields mentioned in Section 2.1 and have estimated redshifts Since all APM clusters have the same assumed physical radius, Mpc (assuming ), their angular size on the sky varies from about to . Clusters which lay sufficiently far from the centers of their APM plates to extend, on the basis of their angular size, beyond the radius described in the last section were not included in our sample.
3 Method
If there is extant dust in nearby galaxy clusters, then more distant galaxies along the same line of sight as the foreground cluster should be reddened and obscured to a degree depending on the characteristics of the intervening dust. Because of issues such as grey dust, for example, mentioned in the Introduction, we have developed a procedure to search for dust in galaxy clusters that is sensitive to any ratio of general to selective extinction, .
Galaxy clusters were selected from the APM Catalogue with redshifts of in order to ensure that the clusters subtended an angle of the sky large enough to contain a significant number of background dust-affected galaxies, and a small number of foreground galaxies, at . The fraction of foreground galaxies is , given our faint magnitude cutoff and empirical estimates of redshift distribution of flux-limited samples of APM galaxies (Maddox et al., 1996). Selecting nearby clusters also ensures that lensing would not be an issue, considering the fact that the background galaxies are relatively nearby as well. For each APM Cluster two apertures were selected, the “Cluster Group” and the “Control Group”; the method determines the obscuration and reddening of the Cluster Group galaxies relative to those of the galaxies in the Control Group. The Cluster Group was either a circular or annular aperture centered on a galaxy cluster’s center (as indicated by the APM Cluster Catalogue) and containing all galaxies that lie within an angular radius equivalent to the physical radius of Mpc at the distance of the cluster. The Control Group contained all of the galaxies located inside a circular annulus concentric with the Cluster Group, with an inner radius of Mpc and an outer radius which ensured that the Cluster and Control Groups had the same sky area. If the Cluster Group of a given cluster extended beyond from plate center, the cluster was not used. If a portion of the Control Group’s annulus fell beyond that radius, then that part of the annulus was removed, and the annular thickness of the remaining portion was increased to ensure equal areas. The Cluster and Control Groups for each individual cluster were confined to the same APM plate to avoid issues relating to plate-to-plate magnitude calibration. Since individual clusters do not have enough galaxies to be analyzed using our procedure, galaxies from many clusters were combined to yield merged Cluster and Control Groups (see Section 4).
It should be noted that despite the equal areas of the Cluster and Control Groups for the complete combined dataset, the Cluster Groups contained more galaxies or roughly 715 per cluster on average than the Control Groups or 627 per cluster on average, because in addition to foreground and background galaxies, the Cluster Groups also contained cluster galaxies. Our method required that the total number of galaxies in the Cluster and Control Groups be about the same. To that end, we tried masking out the central regions of Cluster Groups (which typically have the highest density of galaxies), and adjusting the size of the Control Groups accordingly. However, reducing the fractional difference between the number of galaxies in the Cluster and Control Groups to (from ) had little effect on our determinations of extinction and reddening.
Next, we divided the distribution of galaxies in the color-magnitude (CM) plane of both the Cluster and the Control Groups into pixels of size , and (see top panels of Fig. 2). We present results for . Given the number density of APM galaxies, this is the smallest reasonable pixel size. The CM-plane pixel size determines the sensitivity, or ‘resolution’ of our method. Let and be the observed pixellated CM-plane distributions of galaxies from the Cluster Group and the Control Group, respectively. For the combined analysis, and have maximum values of 44 and 37 galaxies in one pixel, respectively. We have selected rectangular subsets of the distributions, limited on all four sides by the color cut and magnitude cut of . The faint end of the magnitude cut ensures a photometrically complete sample. Dust in galaxy clusters would obscure and redden the light coming from galaxies directly behind them, so that background galaxies in the Cluster Groups would be displaced in the CM plane by the corresponding reddening vector, while galaxies in the Control Group would not. (Since the number of cluster member galaxies and foreground galaxies is small compared to the background galaxies, we assume that all galaxies in the Cluster Group are background.) Therefore it is possible to search for dust by comparing the distributions of galaxies on the CM plane from the Cluster and Control Groups.
In the simplest case of constant reddening vector, the reddening and extinction can be found by sliding the Control Group CM plane distribution with respect to the that of the Cluster Group until the shapes of the two distributions match. The actual values of reddening and extinction would then correspond to the pixel displacements that minimize
| (2) |
where cell combinations in which are not included in the analysis or the value of . The bottom panels of Figure 2 shows two examples of distributions, with specific values of color and magnitude shifts. Note that by applying shifts to the Control Groups, we create regions on all four edges of the CM plane in which pixels from both arrays do not overlap. To compensate for this effect the sum in eq. 2 is over the subset of the CM plane where the and distributions do intersect, and so is a function of the applied shift, . The greater the relative shift between the Cluster and Control Groups, the smaller the overlap area will be. The maximum shifts we apply in and are mag, which is a realistic upper limit on the amount of dust expected to be found in clusters (see Fig. 1). For a maximum shift mag in both CM-plane directions, 4700 pixels out of a total 57600 had to be removed; the fractional decrease in pixel number is small, .
If the minimum of corresponds to pixel shifts of , then the reddening and extinction in the cluster are , and respectively, while the ratio of total-to-selective extinction is
If the distribution of dust in clusters is patchy, so that there is a range of reddening and extinction values, then the procedure described above will recover the distribution of the and values (averaged over the clusters), to within the resolution limit set by the CM pixel size. However, if the dust is perfectly grey, and the galaxy number counts follow a single power law, then the Cluster Group and the Control Group CM distributions will look very similar except for normalization. In that case our method will not be able to detect the presence of dust. Regardless, this method allows the simultaneous detection of multiple dust populations that have different extinction curves, something that is not possible when simply determining the average galaxy color in the sample. In Section 5 we demonstrate this using clusters which have been ‘artificially’ endowed with dust.
Each set of galaxy clusters that we examine using our procedure contains at least 25 clusters, with most samples containing more than 100, which are widely distributed over sq. deg. of high Galactic Latitude. Assuming that the distribution of cirrus dust in our own Galaxy does not mimic the distribution of APM clusters, the effects of reddening and obscuration due to Galactic dust on galaxies in our Cluster and Control Groups should average out.
4 Analysis of APM Clusters
We generated lists of galaxies lying in the Cluster and Control Groups for approximately 140 APM clusters. The algorithm detailed in the previous section was used on three separate sets of clusters: (i) the complete sample, (ii) sample with clusters whose apparent radii are (i.e. ), and (iii) clusters with (). Individual clusters cannot be analyzed using our method due to the small number of galaxies per pixel in the CM plane. In the case of the combined set, the average number of galaxies per pixel is on the order of 10s, whereas the number per pixel for an average cluster would be on the order of 1 at most.
Each of the three sets of clusters were divided even further in order to search for dust on various size scales by removing the central, or the outer regions of the Cluster Groups. We show the results of our analysis in Figures 3 and 4, where we plot contour levels of (eq. 2) as a function of the applied shift in the CM plane, , and . Figure 3 shows the results from selecting various physical scales from our combined data set of roughly 140 APM clusters while Figure 4 shows various subsets of clusters with radii (upper panels) and (lower panels).
In all our analysis of APM clusters, the minima in are always at ; in other words, we detect no extinction or reddening due to dust in any of the cases. Note that the lowest contour level in the plots is not at 0, but typically at , consistent with what one should expect given the definition of (eq. 2) and the level of Poisson noise in the number of galaxies per CM-plane pixel.
To estimate the robustness of our results we implemented a bootstrapping algorithm. We randomly selected 100 sets of galaxy clusters from our sample (keeping the total number of clusters in each set the same, and equal to the original number), performed our analysis of each set separately, and tabulated the and values corresponding to the minima of . By selecting random combinations of clusters we are in effect augmenting some and suppressing other random subsets of the data. The degree to which the various subsets of the data agree serves to test the robustness of our results. We interpret the histogram of the number of times that each pixel on the plane was found to correspond to over 100 permutations of our data as the confidence limits for our sample of galaxy clusters. The bootstrapping results indicate non-detection of widely-distributed dust in each of the trials shown in Figures 3 and 4, with limits of and at a confidence level of , except for the noisy case in the Upper Left panel of Figure 3, which corresponds to no extinction or reddening ( and ) at the level.
We note that in order to determine the average reddening of the Cluster Group compared to the Control Group galaxies, regardless of the ratio of total-to-selective extinction, it would have been sufficient to compute the difference in the average color of the two Groups, instead of using eq. 2 statistic. The former, which uses galaxy counts integrated along the magnitude direction, has the advantage of yielding results of higher statistical significance. The disadvantages are twofold: First, the ratio of total-to-selective extinction, cannot be determined, and second, the properties of non-uniformly distributed dust, of the type considered in the next Section, cannot be easily recovered.
5 Confidence Tests and Sensitivity
In Section 4 we found that the Mpc regions around APM clusters do not appear to have any dust in them, compared to their surrounding Control annuli. Here we examine whether the technique we have developed is sensitive enough to detect reddening and obscuration if they were non-zero. We artificially introduce ‘dust’ into the Cluster Group galaxies, and leave Control Group galaxies unaltered. Several types of dust were used: (i) uniformly distributed dust of constant total-to-selective extinction ratio, ; (ii) non-uniformly distributed dust of constant ratio; (iii) patchily distributed dust, with distinct dust clumps, and unobscured areas. Unless otherwise specified, we used the Rieke & Lebofsky (1985) Interstellar Extinction Law for all types of dust, and their ratios for and to calculate given . Other values of total-to-selective extinction ratio could have been used. Our technique’s ability to determine is independent of its value.
Since uniformly distributed dust would affect all background galaxies, the first type of dust was implemented by shifting all the galaxies in the Cluster Group by the same amount in magnitude and color. We chose , and the corresponding , where subscript stands for ‘artificial’ dust. This example of dust type (i) is shown in the Upper Left panel of Figure 5. Within our resolution, the minimized statistic recovers the correct values of the shifts in reddening and extinction.
Non-uniformly distributed dust would affect background galaxies to various degrees, so for the second type of dust we assumed an average value for extinction , as well as a dispersion in extinction, . The shape of the distribution that we applied was Gaussian. Individual galaxies from the Cluster Groups were assigned values of randomly from the distribution. The corresponding color excess was determined using a fixed ratio or . We present results for case (ii) with , and and in the Upper Right and Lower panels of Figure 5. As before, the corresponding color shift for each galaxy was obtained assuming constant ratio. From these cases, it is clear that the wider the distribution of shifts, the more difficult it is to recover the correct values of the extinction and reddening shifts. This is due to the fact that the signal eventually becomes lost in the noise when implementing wider and wider distributions. Hence, it is necessary to use a deeper catalog with a larger coverage area in order to determine the distribution of extinctions and reddenings inside a set of clusters where dust is distributed non-uniformly.
To implement the third type of dust, which corresponds to dust distributed patchily, i.e. in ‘pockets’ we randomly picked a specified fraction of galaxies from the Cluster Group and assigned them exactly the same ‘dust’ induced shifts in magnitude and color. Other Cluster Group galaxies were assumed to lie behind cluster areas that contained no dust. The fraction of galaxies that were affected by dust is the dust covering factor of the cluster. Figure 6 shows examples of type (iii) dust. The upper right and lower left show results for bimodal dust: a fraction of the sky in Cluster Groups ( and , respectively) is assumed to be devoid of dust and results in a local minimum in the plane at . The rest of the sky area is obscured, and results in the second local minimum at non-zero values of and . The lower right panel shows the expected effect resulting from a cluster that contains unobscured lines of sight as well as two different populations of dust, both having (instead of used in all other tests), but different degrees of concentration.
Figure 6 also tests the ability of our technique to detect dust distributed in ‘pockets’ of small covering factors. It appears that dust with covering factors less than about would be difficult to detect, at least with the present sample of clusters.
Figures 5 and 6 demonstrate that our technique can detect cluster dust, and distinguish various types of its spatial distribution: smooth, non-uniform, or clumpy, as long as the typical values of are not too large, , and the covering factor is not too small, . It is important to note that these limitations as well as the CM-plane resolution are not limitations of the method, but are instead due to the limited number galaxies, and the relatively bright flux limit of the APM galaxies. Our technique works well as long as the dust induced shifts in color and magnitude are of the total CM-plane extent of the and distributions. The extent of these in magnitude are limited on the faint side by the flux limit of the galaxy survey, while on the bright side the distributions are effectively limited by the limited sky coverage.
6 Summary and Conclusions
In this paper we have developed a technique to detect reddening and obscuration due to widely-distributed dust in galaxy clusters. We have applied the method to a sample of low redshift, high Galactic Latitude APM clusters. Our analysis indicates that the reddening and extinction due to dust within Mpc of cluster centers relative to that in annuli immediately surrounding clusters are and , at confidence. Note that corresponds approximately to . Our result is fully consistent with no dust being present on Mpc scales in moderately rich and poor clusters.
There are several possible reasons for the non-detection of dust in our sample. First, it is possible that dust lying in galaxy clusters may in fact be clumped into self-shielded pockets with a small covering factor, . Our analysis would be relatively insensitive to this distribution because only a minority of background galaxies would have been affected. It is also possible that dust is distributed over greater spatial regions then those we have tested in this work. Because we are somewhat limited by the size of the APM plates, we tested dust content at Mpc scales. Another possibility is that dust does not exist in significant quantities in the APM Galaxy Clusters. This stance is consistent with Popescu et al. (2000), who on the basis of estimates of dust insertion rates, anticipated an extinction of only in the Virgo cluster, insomuch as the Virgo cluster is similar to APM clusters.
The most likely interpretation of our results is that APM clusters do not contain any dust. The spatial regions of moderately rich and poor APM clusters that we probe, Mpc, roughly correspond to the same –normalized regions that were probed by earlier studies of rich clusters and galaxy groups: few Mpc regions around rich clusters and Mpc regions around groups. These are beyond the virial radii of these systems, and probably correspond to regions where infall dominates. Combining our results with those of earlier studies, we conclude that rich, moderately rich, and poor clusters contain no dust in their infall regions, while galaxy groups do (Girardi et al., 1992). The physical implications of this finding are beyond the scope of the present paper.
We tested our method by artificially reddening and obscuring galaxies belonging to the Cluster Groups. We applied various types of dust distribution on the sky: uniform, non-uniform, and clumpy, and demonstrated that our technique correctly recovers the amplitude of reddening and obscuration, the value of total-to-selective extinction, and the approximate dust covering factor. The ability of our method to recover these quantities without relying on a priori assumptions about properties of dust makes the method a powerful tool for detecting widely-distributed dust.
Our technique can be applied to any set of clusters or groups constructed from a homogeneous and uniform catalog of galaxies with at least two colors. The performance of the method will improve if the galaxy distributions cover a large range in magnitude and color. As we pointed out in Section 5, dust induced shifts in color and magnitude are easier to detect if they represent a small fraction of the total extent of the CM-plane distribution. Deeper photometric galaxy surveys would extend the faint magnitude end of the distributions, while surveys with large sky coverage would extend the bright end. Larger sky coverage would also enable the use of smaller CM-plane pixels thus improving the resolution of the method. Because of large plate-to-plate magnitude variation of the APM, our current analysis is restricted somewhat by the angular size of the plates. A large homogeneous survey would not have this restriction. Galaxy catalogs with band passes separated to a larger degree than and would provide a longer lever arm which would enable a better estimate of extinction.
References
- Aguirre (1999) Aguirre, A. N. 1999, ApJ, 512, L19
- Annis & Jewitt (1993) Annis, & Jewitt, 1993, MNRAS, 264, 593
- Arnaud & Mushotzky (1998) Arnaud, K. A. & Mushotzky, R. F. 1998, ApJ, 501, 119
- Bahcall (1999) Bahcall, N. A. 1999, in Formation of Structure in the Universe, eds. Dekel, A. & Ostriker, J. P., (Cambridge University Press: Cambridge), p. 135 - 171 and the references therein
- Biviano et al. (1990) Biviano,A., Giurcin, G., Mardirossian, M., & Rephaeli, Y., 1990, in Dusty Objects in the Universe, eds. E. Bussoletti & A. A. Vittone, Kluwer Academic Publishers
- Bogart & Wagoner (1973) Bogart, R. S. & Wagoner, R. V. 1973 ApJ, 181, 609
- Boyle, Fong & Shanks (1988) Boyle, B. J., Fong, R. & Shanks, T. 1988 MNRAS 231, 897
- Burstein & Heiles (1982) Burstein, D., Heiles, C. AJ, 87, 8, 1165
- Canizares (1981) Canizares, C. R., 1981, Nature, 291, 620
- Croom & Shanks (1999) Croom, S. M. & Shanks, T. 1999, MNRAS, 307, L17
- Dalton et al. (1994) Dalton, G. B., Croft, R. A. C., Efstathiou, G., Maddox, S. J. & Sutherland, W. J. 1992, ApJ, 390, L1
- Dalton et al. (1997) Dalton, G. B., Maddox, S. J., Sutherland, W. J. & Efstathiou, G. 1997, MNRAS 289, 263
- Draine & Salpeter (1979) Draine, B. T. & Salpeter, E. E. 1979, ApJ, 231, 77
- Dwek, Rephaeli & Mather (1990) Dwek, E., Rephaeli, Y. & Mather, J. C. 1990, ApJ, 350, 104
- Falco et al. (1999) Falco, E., et al., 1999, ApJ, 523, 617
- Ferguson (1993) Ferguson, H., 1993, MNRAS, 263, 343
- Girardi et al. (1992) Girard, M., Mezzetti, M., Giuricin, G. & Mardirossian, F. 1992, ApJ, 394, 442
- Hu (1992) Hu, E. M., 1992, ApJ, 391, 608
- Irwin (1996) Irwin, M. APM cat http://www.ast.cam.ac.uk/apmcat
- Jones & Forman (1992) Jones, C. & Forman, W., 1992, in Clusters and Superclusters of Galaxies, NATO ASI Series, No. 366, ed. A. C. Fabian (Dordrecht: Kluwer Academic), p. 49
- Karachentsev & Lipovetskii (1969) Karachentsev, I. D. & Lipovetskii, V. A. 1969 Soviet Phys., 12, 909
- Maddox et al. (1996) Maddox, S.J, Efstathiou, G. & Sutherland, W. J. 1996, MNRAS, 283, 1227
- Myers, A.D. et al. (2002) Myers, A.D. et al. 2002, Preprint, http://xxx.lanl.gov/abs/astro-ph/0211624
- Maoz (1995) Maoz, D. 1995, ApJ, 455, L115
- Mathis (1990) Mathis, J., 1990, ARA& A, 28, 38
- Narayan (1989) Narayan, R. 1989, ApJ, 339, L53
- Perlmutter et al. (1998) Perlmutter, S. et al. 1998, Nature, 391, 51
- Popescu et al. (2000) Popescu, C. C., Tuffs, R. J., Fischera, J. & Völk, H. A & A, 354, 480
- Reiss et al. (1998) Reiss, A. G. et al. 1998, AJ, 116, 1009
- Rieke & Lebofsky (1985) Rieke, G. H. & Lebofsky, M. J. 1985, ApJ, 288, 618
- Rodrigues-Williams & Hogan (1994) Rodrigues-Williams, L.L. & Hogan, C.J. 1994, AJ, 107, 451
- Romani & Maoz (1992) Romani, R. W., Maoz, D. 1992, ApJ, 386, 36
- Schlegel, Finkbeiner & Davis (1998) Schlegel, D. J., Finkbeiner, D. P. & Davis, M. ApJ, 500, 525
- Stickel et al. (1998) Stickel, M., Lemke, D., Mattila, K., Haikala, L. K. & Haas, M. A & A, 329, 55
- Turner (1980) Turner, E. L., 1980, ApJ, 242, L135
- Wise et al. (1993) Wise, M. W., O’Connel, R. W., Bregman, J. N. & Roberts, M. S. 1993, ApJ, 405, 94
- de Vaucouleurs, de Vaucouleurs & Corwin (1972) de Vaucouleurs, G., de Vaucouleurs, A. & Corwin, H. G. Jr. 1972, AJ, 77, 4, 285
- Voit & Donahue (1995) Voit, G. M. & Donahue, M. 1995, ApJ, 452, 164
- Voshchinnikov & Khersonskij (1984) Voshchinnikov, N. V. & Khersonskij, V. K. 1984, Astr. Space Sci., 103, 301
- Zwicky (1957) Zwicky, F. 1957, Morphological Astronomy (Berlin: Springer Verlag)
- Zwicky (1962) Zwicky, F. 1962, Problems of Extragalactic Research , ed. G. C. McVittie (New York: Macmillan), p. 149