Extragalactic Astronomy with the VLTI: a new window on the Universe
Abstract
Interferometry in the optical and near infrared has so far played a marginal role in Extragalactic Astronomy. Active Galactic Nuclei are the brightest and most compact extragalactic sources, nonetheless only a very limited number could be studied with speckle interferometry and none with long baseline interferometry. The VLTI will allow the study of moderately faint extragalactic objects with very high spatial resolution thus opening a new window on the universe. With this paper we focus on three scientific cases to show how AMBER and MIDI can be used to tackle open issues in extragalactic astronomy.
keywords:
Interferometry, VLTI, Extragalactic Astronomy, Active Galactic Nuclei, Circumnuclear Tori, Broad Line Regions, Massive Black Holes1 Introduction
Optical and near infrared interferometry has so far played a marginal role in extragalactic astronomy and in particular no multiple aperture observations have ever been performed. The VLTI sensitivity will allow to explore spatial scales which have not been probed so far, thus opening a new window on extragalactic astronomy. Previous observations of extragalactic sources have been limited to speckle interferometry of a few of the brightest Active Galactic Nuclei like NGC 1068 [Meaburn et al. (1982), Chelli et al. (1987), Afanas’ev et al. (1992), Wittkowski et al. (1998), Weinberger et al. (1999)], NGC 1386 [Mauder et al. (1992)] and NGC 4151 [Ebstein et al. (1989), Ayers et al. (1990)]. Even with the use of the 8m telescopes, VLTI observations will be limited to the brightest sources. The objects with the highest flux within the diffraction limit PSF of the 8m telescopes are Active Galactic Nuclei, which, at least initially, will be the only extragalactic targets observed.
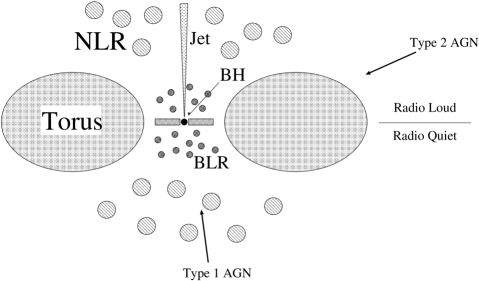
Active Galactic Nuclei are galactic nuclei showing evidence for non-stellar production of energy. The most stringent constraints come from the emitted luminosities (L L⊙), the flat () non-stellar spectra extending from radio to -rays, the high efficiencies of matter-energy conversion (), the rapid time variabilities (observed on scales as short as a few hours in optical and X-rays), the compact source sizes (directly measured in radio sources and smaller than a few light days) and the presence of relativistic jets (e.g. \opencitesaasfee). Observationally all AGNs can be roughly divided into two main classes, type 1 and type 2 (e.g. Seyfert 1 and 2 nuclei). The type 1 AGNs show broad ( km/s) permitted emission lines in their optical and near-IR spectra while type 2 AGNs only show narrow lines ( km/s). The most widely accepted model (see Fig. 1) comprises a central black hole with mass in the range M⊙ surrounded by an accretion disk that converts gravitational energy into radiation and outflows. The radiation emitted in the optical - UV - soft X-rays accounts for most of the AGN bolometric luminosity. Broad emission lines originate in small high density gas clouds ( cm-3) orbiting around the nuclear source. Variability time scales of the broad line fluxes and other theoretical arguments suggest that the BLR size ranges from a few light days for nearby Seyfert 1 galaxies up to a few light years in the most luminous quasars. Plasma jets are emitted perpendicular to the disk. At large radii ( pc), an obscuring torus of cold gas and dust surrounds the nucleus. The orientation of this torus relative to the line of sight naturally accounts for the differences between type 1 and type 2 AGNs (figure 1; see \openciteanto for a review).
Up to now optical and near-IR observations have been able to probe spatial scales larger than the size of the obscuring torus. Interferometric radio observations are able to probe smaller scales, but very little information is available on many constituent of the AGN model, like the torus or the BLR. Thus, in the following, we will show how the VLTI, and in particular AMBER, can be used to tackle open issues on the obscuring torus, the BLR and the central supermassive Black Hole.
2 The Obscuring Torus
The nuclear near-IR luminosity of several AGNs is dominated by emission of hot dust, close to the sublimation limit, which traces the inner walls of the circumnuclear molecular torus. The inner radius of the torus is set by the minimum distance from the nuclear UV source at which dust can survive against sublimation, i.e. pc where is the optical-UV luminosity of the AGN in units of erg/s [Laor & Draine (1993)]. The smallest radius is for large grains and the largest for small grains. Within the torus, the absorbing dust reprocesses the optical-UV primary radiation into the infrared, via heating of the dust grains. Several authors have modeled the infrared spectral energy distribution of AGNs and have shown that, indeed, the nuclear infrared emission can be explained with reprocessing of the nuclear radiation by dust (e.g. \opencitepier; \opencitegrana; \openciteefst). The obscuring dusty medium is expected to extend from the sublimation radius (less than a pc) up to about 100 pc [Granato et al. (1997), Maiolino & Rieke (1995)].
Until a few years ago, the only constraints on the models were the infrared spectral energy distributions and the upper limits on the size of the nuclear H and K band sources obtained from ground-based and HST/NICMOS observations (e.g. \opencitethatte; \opencitemaio98). Without strong constraints on the sizes and geometries of the tori, there is a degeneracy between the model parameters (like dust composition, distribution etc.) meaning that the same spectra and size constraints can be adequately explained with very different torus models. The radiative transfer models have been recently compared with the IR SED of nearby Seyfert galaxies and with high angular resolution near- and mid-IR observations to try to constrain the physics and the geometry of the dusty torus (e.g. \opencitealloin; \opencitebock; \opencitemaio98; \openciterouan) with the finding that the near- and mid-IR emitting dust is somewhat more extended than expected by the early models. The geometry and the physics of the dusty gas in the circumnuclear region of AGN are thus more complex than assumed so far. An additional complication is that the properties of dust in AGNs might be different with respect to the diffuse interstellar medium. More specifically, Maiolino et al. Maiolino et al. (2001a, b) have shown that probably the dust in the circumnuclear region of AGNs is biased in favor of large grains, while in all models for the molecular torus a “standard” Galactic dust mixture has been assumed. A distribution of dust biased in favor of large grains would change significantly the distribution of temperatures and also the location of the dust sublimation radius.
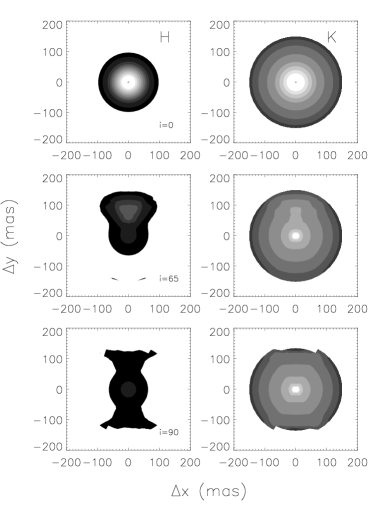
We can consider, for example, the case of the famous Seyfert 2 galaxy NGC 1068 whose luminosity, for an assumed distance of D=14.4 Mpc, is erg/s. The inner radius for a Galactic dust mixture is pc, thus the expected inner radius for the NGC 1068 torus is 0.3pc corresponding to mas. Then, in the model by \inlinecitegrana97, the torus should have a K-band size of mas FWHM (18 mas at 10m). These sizes can be directly measured using AMBER and MIDI at the VLTI. As a zero order approximation, the observed visibilities at different points in the uv plane, in different spectral bands (H, K and 10m) can be fit with a ring model to estimate the inner and outer radii. The measure of the inner radius will directly tell if the dust composition is as in our galaxy or biased toward larger or smaller grains. However one can perform more detailed studies and try to distinguish between different models. A library of models with different parameters (inner radius, thickness, inclination, density, optical depth, mixture of dust grains) can be computed. Then for each model one can compute the expected visibilities and phases for the points in the uv plane covered by the observations. By using AMBER with 3 telescopes and the low spectral resolution mode (), a single observation will provide 3 visibilities and one closure phase in any of the spectral channels present in J, H and K. It is important to remember that the large wavelength coverage (1.0 to 2.4 m) substantially increases the instantaneous coverage of the uv plane which can be further increased taking advantage of Earth rotation. MIDI will similarly provide one visibility point per single observation. Thus, the best model should be able to reproduce at the same time the AMBER and MIDI observations together with the ir spectra. Figure 2 shows the expected spatial distributions and visibilities of H and K emission for the NGC 1068 torus model by \inlinecitegrana97 seen at different inclinations with respect to the line of sight. For a given geometry, different inclinations produce different morphologies which can be distinguished with VLTI.
In conclusion, the AMBER and MIDI data will remove the degeneracy among the model fitting parameters, at variance with previous studies which could compare models only with the IR spectral energy distribution.
3 The Broad Line Region of Active Galactic Nuclei
The BLR (Broad Line Region) is the region where the broad (FWHM km/s) permitted lines observed in the spectra of type 1 AGNs originate (e.g. \opencitesaasfee). Given the small distance from the central super massive black hole (SMBH) the width of the broad lines is likely to originate from the gravitational motion of gas clouds around the SMBH. So far, the size of the BLR could not be directly measured and the only available information is provided by the so-called reverberation mapping technique (e.g. \opencitepeter). The BLR size is estimated as where is the time lag between the continuum and line variation. Clearly this represents an average size weighted over the BLR geometry and physical conditions. In principle the BLR geometry and kinematics can be derived from the detailed behavior of the light curves, but the inversion is not unique mainly because of the correspondence between the 1-dimensional nature of light curves and the 3-dimensional nature of the BLR. Also the non optimal time sampling of the observations strongly reduces the constraints which can be derived. Suggested spatial distribution of the BLR clouds are spherical, disk-like or conical. Dynamically, the BLR might be dominated by gravitational motions (either a virialized system with chaotic motions or a disk in keplerian rotation), or might be part of a radiation pressure driven outflow, or of an inflow. Obtaining a direct measure of the BLR size and constraining its morphology and kinematics is fundamental in order to understand its origins and relationship with AGN activity, and to measure the mass of the SMBH and verify reverberation mapping techniques. BLR sizes determined with the reverberation mapping have been found to correlate with the quasar luminosity. A recent estimate by \inlinecitekaspi gives:
| (1) |
where is the rest-frame monochromatic luminosity at 5100 Å. Assuming a standard cosmology ( km/s/Mpc, and ), can be translated into an apparent size in the plane of the sky obtaining for instance mas for a L⊙ quasar at (we have assumed = L/15). For L⊙ and , mas. These numbers imply that BLRs are not resolvable with the VLTI. However, when a source is not resolved by an interferometer, the differential phase measures the displacement of the photocenter with wavelength along the baseline direction. This is valid even when this displacement is much smaller than the standard resolution limit of the interferometer. The position of the photocenter with wavelength is a powerful constraint for the geometry and kinematics of the BLR and can be obtained by taking advantage of the AMBER spectral resolution.

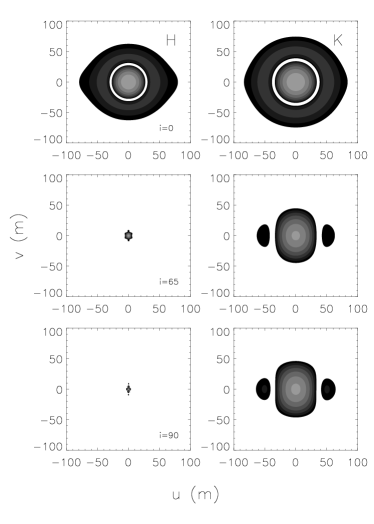
For example, one can consider the case of the famous quasar 3C273. Its BLR radius measured with reverberation mapping by \inlinecitekaspi, lt-days corresponds to 0.13 mas (at the distance of 3C 273, 1 mas corresponds to 2.6 pc) and the inferred BH mass is M⊙. Figure 3 shows the expected isovelocity contours with steps of 400 km/s assuming that the BLR is in a Keplerian disk and that it is inclined of 30 deg with respect to the line of sight. Using AMBER with Medium spectral resolution (), one can measure the differential phase of the broad Pa in the K band and obtain information in 400 km/s velocity bins. At 2.2m, with a projected baseline of 80 m, a photocenter displacement of 0.13 mas will result in a phase shift on the line of rad. Since in each spectral channel we expect Pa photons/sec, the expected accuracy which can be reached in 1 h of observation is rad (arcsec in K with a 80 m baseline), thus allowing to measure the photocenter displacement. Since a given measure with two telescopes yields mainly one component of the photocenter displacement, in order to obtain a full map of the photocenter displacement one should measure the differential phase using observations from two perpendicular baselines.
The differential phase in each velocity bin will provide the position of the photocenter of the part of the disk which is delimited by two contiguous contours in figure 3. In this case, the photocenters will be aligned along the line of nodes of the disk and, combining positional and velocity information, one can directly measure the mass of the central BH. Conversely, if the BLR is composed by a spherically symmetric and isotropic ensemble of clouds the photocenters will all coincide with the position of the continuum photocenter and no differential phase will be measured. Other locations of the photocenters will result in more complicated geometries but, in any case, the amplitude of the photocenter displacement is directly related to the angular size of the BLR. If we are able to establish a relationship between the differential interferometry angular radius and the reverberation mapping linear radius, we can get a direct measurement of the AGN distance. Since, in the best case, this kind of measurement can be made on a magnitude quasar when there is a nearby reference star, this could eventually lead to a new and independent technique to measure cosmological distances.
4 The central Black Hole
It is now clear that a large fraction of local galaxies, if not all, contain a MBH (e.g. \opencitekg). Moreover, there is a suggestion in the data that the hole mass is proportional to the mass (or luminosity) of the host spheroid (e.g. \opencitemf01 and references therein). Recently \inlinecitefm00 and \inlinecitegeb00 have shown that a tighter correlation holds between the BH mass and the velocity dispersion of the bulge. Clearly, any correlation of black hole and spheroid properties would have important implications for theories of galaxy formation in general, and bulge formation in particular. These results have prompted a frantic attempt to understand the physical origin of the observed correlations between BH mass and galaxy properties (e.g. \opencitehk; \opencitecava) and to put constraints on galaxy and BH formation models.
However, there is a caveat which must be taken into account: the so called massive black holes in galactic nuclei are in reality massive dark objects because, at the moment, there is no conclusive proof that they are indeed black holes. The massive dark objects are point-like at the resolution of the observations, which, at most, are of the order of 0.1”. Combining this with typical galaxy distances of 10-20Mpc, one derives that the density of the massive dark objects are not so high that the only plausible alternative is a BH: indeed in most cases they are even smaller than the densities observed in core collapsed globular cluster () which are the most dense star clusters known. Therefore the possibility that these dark masses could be clusters of ”dark” objects (e.g. neutron stars, planets etc.) cannot be excluded. Two notable exceptions are our galactic center (, \opencitegenzel) and NGC 4258 (, \opencite4258) where, given the high densities of the dark matter distribution, the only possibility is that of a massive black hole. In the first case the key point is the closeness (just 8 kpc) while in the second case the high spatial resolution is obtained with VLBI observations of water masers. Unfortunately our galactic center is unique and galaxies with water masers observable with VLBI are just a handful and none of them provides as good an evidence as NGC 4258 Braatz et al. (1997).
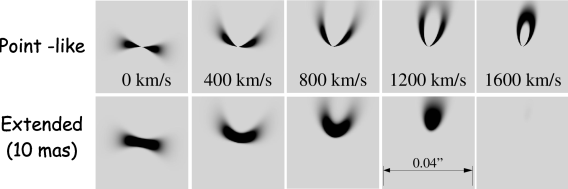
Using the spectral resolution of AMBER it is possible to constrain the size of the dark mass distributions which are found at the galaxy centers to verify if they are indeed black holes. We can consider for example the case of Centaurus A Marconi et al. (2001). In Centaurus A the dark mass is and if it can be constrained within 10mas (i.e. 0.17pc) the density will be . Centaurus A will thus provide a better case for a BH than NGC 4258. Centaurus A has an ionized gas disk rotating around the putative BH. This disk is a strong emitter in H and Fe lines and can be observed with AMBER in Pa and [FeII] 1.26m with medium spectral resolution (, 400 km/s spectral channels). On the spatial scales accessible to AMBER, this disk will rotate with velocities of km/s and the regions at different velocities will have different morphologies if the mass is point like or extended (see Fig. 4). The extreme case is for the velocity bin at 1600 km/s where no disk emission is expected if the mass is extended over 10 mas. The visibility points and differential phases obtained at several locations in the uv plane for each spectral channel can be compared with models of disks rotating around a point mass (BH) or around an extended mass distribution (several different distributions can be tested). By fitting the model to the data one can then determine the free parameters (total mass, PA of disk line of nodes, disk inclination) as well as constrain the region were the dynamical mass must be distributed.
5 Conclusions
The VLTI will allow the study of moderately faint extragalactic objects with very high spatial spatial resolution thus opening a new window on the universe. To show the potentiality of high spatial resolution interferometric observations we have presented three scientific cases which will be tackled with AMBER and MIDI. The combined use of AMBER and MIDI will make possible to spatially resolve the obscuring torus of Active Galactic Nuclei and to solve the degeneracies in torus models. The unique spectroscopic capabilities of AMBER will be able to spatially resolve the BLR and to constrain its geometry and kinematics. By relating the BLR sizes measured with reverberation mapping and those measured with differential interferometry one might directly measure cosmological distances. Finally, it will also be possible to constrain the size of the dark matter distributions found in galaxy nuclei to test if they are really supermassive black holes.
References
- Afanas’ev et al. (1992) Afanas’ev, V. L., I. I. Balega, V. G. Orlov, & V. A. Vasiuk 1992, A&A 266, 15-20
- Alloin et al. (2000) Alloin, D., E. Pantin, P. O. Lagage, & G. L. Granato 2000, A&A 363, 926-932
- Antonucci (1993) Antonucci, R. 1993, ARA&A 31, 473-521
- Ayers et al. (1990) Ayers, G. R., J. Benson, K. Carels, et al. 1990, ApJ 360, 471-473
- Blandford, Netzer & Woltjer (1990) Blandford, R. D., H. Netzer, L. Woltjer 1990, Saas-Fee Advanced Course 20, Lecture Notes 1990, XII, 280 pp. 97 Springer-Verlag
- Bock et al. (2000) Bock, J. J., G. Neugebauer, K. Matthews, et al. 2000, AJ 120, 2904-2919
- Braatz et al. (1997) Braatz, J. A., A. S. Wilson, & C. Henkel 1997, ApJS 110, 321
- Cavaliere & Vittorini (2002) Cavaliere, A. & V. Vittorini 2002, ApJ 570, 114-118
- Chelli et al. (1987) Chelli, A., I. Cruz-Gonzalez, L. Carrasco, & C. Perrier 1987, A&A 177, 51-62
- Ebstein et al. (1989) Ebstein, S. M., N. P. Carleton, & C. Papaliolios 1989, ApJ 336, 103-111
- Efstathiou & Rowan-Robinson (1995) Efstathiou, A. & M. Rowan-Robinson 1995, MNRAS 273, 649-661
- Ferrarese & Merritt (2000) Ferrarese, L. & D. Merritt 2000, ApJ 539, L9-L12
- Gebhardt et al. (2000) Gebhardt, K. et al. 2000, ApJ 539, L13-L16
- Genzel et al. (2000) Genzel, R., C. Pichon, A. Eckart, et al. 2000, MNRAS 317, 348-374
- Granato & Danese (1994) Granato, G. L. & L. Danese 1994, MNRAS 268, 235
- Granato et al. (1997) Granato, G. L., L. Danese, & A. Franceschini 1997, ApJ 486, 147
- Haehnelt & Kauffmann (2000) Haehnelt, M. G. & G. Kauffmann 2000, MNRAS 318, L35-L38
- Kaspi et al. (2000) Kaspi, S., P. S. Smith, H. Netzer, et al. 2000, ApJ 533, 631-649
- Kormendy & Gebhardt (2001) Kormendy, J. & K. Gebhardt 2001, Proc. of 20th Texas Symposium, 363
- Laor & Draine (1993) Laor, A. & B. T. Draine 1993, ApJ 402, 441-468
- Maiolino & Rieke (1995) Maiolino, R. & G. H. Rieke 1995, ApJ 454, 95
- Maiolino et al. (1998) Maiolino, R., A. Krabbe, N. Thatte, & R. Genzel 1998, ApJ 493, 650
- Maiolino et al. (2001a) Maiolino, R., A. Marconi, M. Salvati, et al. 2001a, A&A 365, 28-36
- Maiolino et al. (2001b) Maiolino, R., A. Marconi, & E. Oliva 2001b, A&A 365, 37-48
- Marconi et al. (2001) Marconi, A., A. Capetti, D. J. Axon, et al. 2001, ApJ 549, 915-937
- Mauder et al. (1992) Mauder, W., I. Appenzeller, K.-H. Hofmann, et al. 1992, A&A 264, L9-L12
- Meaburn et al. (1982) Meaburn, J., B. L. Morgan, H. Vine, et al. 1982, Nature 296, 331
- Merritt & Ferrarese (2001) Merritt, D. & L. Ferrarese 2001, ASP Conf. Ser. 249, 335
- Miyoshi et al. (1995) Miyoshi, M., J. Moran, J. Herrnstein, et al. 1995, Nature 373, 127
- Peterson (1994) Peterson, B. M. 1994 ASP Conf. Ser. 69, 1
- Pier & Krolik (1993) Pier, E. A. & J. H. Krolik 1993, ApJ 418, 673
- Rouan et al. (1998) Rouan, D., F. Rigaut, D. Alloin, et al. 1998, A&A 339, 687-692
- Thatte et al. (1997) Thatte, N., A. Quirrenbach, R. Genzel, et al. 1997, ApJ 490, 238
- Weinberger et al. (1999) Weinberger, A. J., G. Neugebauer, & K. Matthews 1999, AJ 117, 2748-2756
- Wittkowski et al. (1998) Wittkowski, M., Y. Balega, T. Beckert, et al. 1998, A&A 329, L45-L48