An X-ray Atlas of Groups of Galaxies
Abstract
A search was conducted for a hot intragroup medium in 109 low-redshift galaxy groups observed with the ROSAT PSPC. Evidence for diffuse, extended X-ray emission is found in at least 61 groups. Approximately one-third of these detections have not been previously reported in the literature. Most of the groups are detected out to less than half of the virial radius with ROSAT. Although some spiral-rich groups do contain an intragroup medium, diffuse emission is restricted to groups that contain at least one early-type galaxy.
1 Introduction
Most galaxies in the local universe, including our own Milky Way, are members of poor galaxy groups (Geller & Huchra, 1983; Tully, 1987; Nolthenius & White, 1987). The realization that many groups are X-ray sources has led to considerable interest in these systems over the last decade (Mulchaey et al., 1993; Ponman & Bertram, 1993; David et al., 1994; Henry et al., 1995; Pildis, Bregman & Evrard, 1995; Doe et al., 1995; Saracco & Ciliegi, 1995; Mulchaey et al., 1996a; Ponman et al., 1996; Mulchaey & Zabludoff, 1998; Helsdon & Ponman, 2000a). The X-ray emission in groups is typically extended on scales of hundreds of kiloparsecs. X-ray spectroscopy suggests the emission mechanism is most likely a combination of thermal bremsstrahlung and line emission. This interpretation requires that the entire volume of groups be filled with a hot, low-density gas often referred to as the intragroup medium in analogy to the intracluster medium found in richer systems.
The existence of an intragroup medium is important for many reasons. The presence of a hot gas halo indicates that many groups are likely real, physical systems and not simply chance superpositions or large-scale filaments viewed edge-on. Assuming the intragroup gas is in hydrostatic equilibrium, the total mass of the group can be estimated (Mulchaey et al., 1993; Ponman & Bertram, 1993; Pildis, Bregman & Evrard, 1995; Mulchaey et al., 1996a). Based on ROSAT data, the typical group mass is approximately one-tenth the mass of a cluster like Virgo. However, because the number density of X-ray detected groups is considerably higher than the number density of clusters like Virgo, the contribution of X-ray detected groups to the total mass density of the universe is comparable to or greater than that of rich clusters. A comparison of the mass in galaxies and intragroup gas to the total group mass indicates that the known baryonic components typically account for only 10–20% of the total mass (Mulchaey et al., 1993; Ponman & Bertram, 1993; Henry et al., 1995; Pildis, Bregman & Evrard, 1995; Mulchaey et al., 1996a). This implies that groups are dominated by dark matter. Extrapolating the X-ray surface brightness profiles to the virial radius suggests that most of the baryonic mass in groups is in the intragroup medium. In fact, the intragroup medium may be the dominant baryonic component in the local universe (Fukugita, Hogan & Peebles, 1998).
The intragroup medium may also hold important clues into the formation and evolution of large-scale structure. Numerical simulations indicate that in the absence of non-gravitational heating, the density profiles of groups and clusters should be nearly identical (Navarro, Frenk & White, 1997). In this simple scenario, the relationships between X-ray luminosity (LX), X-ray temperature (T) and optical velocity dispersion () are expected to be similar for groups and clusters. There is now considerable evidence for departures from such uniformity (Ponman, Cannon & Navarro, 1999; Lloyd-Davies, Ponman & Cannon, 2000; Mahdavi et al., 2000; Helsdon & Ponman, 2000a). The interpretation of these departures is currently a topic of much debate. One possibility is that preheating of the intragroup medium by an early generation of stars can explain the scaling relationships (Cavaliere, Menci & Tozzi, 1998; Ponman, Cannon & Navarro, 1999; Pierre, Bryan & Gastaud, 2000; Finoguenov, David & Ponman, 2000; Bialek, Evrard & Mohr, 2001; Borgani et al., 2001). Alternative explanations include heating by active galaxies (Valageas & Silk, 1999; Fujita & Takahara, 2000; Yamada & Fujita, 2001), internal heating mechanisms (Loewenstein, 2000) and the possibility that galaxy formation is more efficient in groups than in clusters (Bryan, 2000).
Most of our current understanding of the intragroup medium is based on observations of groups with ROSAT. The low internal background, large field of view, and good sensitivity to soft X-rays made the ROSAT PSPC detectors ideal instruments for studies of nearby groups. Unfortunately, large systematic surveys of well-selected groups were not performed during the limited lifetime of the PSPC detectors. However, a large number of groups were observed serendipitously. Although ROSAT results have been reported for many of these groups, a significant fraction of the groups in the ROSAT database have not been previously published. Furthermore, the derived X-ray properties of groups are somewhat sensitive to assumptions made during the data reduction and analysis. For this reason, different authors often derive vastly different results from the same ROSAT dataset. Therefore, constructing large samples from the literature can be problematic. In an attempt to produce a more uniform sample, we have reanalyzed the ROSAT PSPC data for all poor groups previously reported in the literature along with a large number of nearby groups that have not previously been published.
We describe the sample selection in §2 and the data reduction in §3. For those groups with detected diffuse emission, we have extracted an X-ray spectrum (§4). Fits to the surface brightness profiles of the groups are described in §5. In §6 we examine the morphological composition of the X-ray detected groups. Finally, a summary is provided in §7.
2 Sample
The ROSAT mission consisted of two main scientific phases, a six-month, all-sky survey with a mean exposure time of approximately 400 seconds and longer pointings of individual targets (the so-called ‘pointed mode’). While the all-sky survey data are deep enough to detect the most X-ray luminous groups (Ebeling, Voges & Böhringer, 1994; Henry et al., 1995; Mahdavi et al., 1997, 2000), it is not possible to carry-out detailed spatial and spectral studies with this dataset. As the ‘pointed mode’ observations allow more detailed studies, we restrict our analysis to groups observed during this phase of the ROSAT mission.
We select our groups from a number of different sources. We start by including all groups that were in previous ROSAT ‘pointed-mode’ studies. Many of the groups come from the compact group catalog of Hickson (1982) or from the loose group studies of Mulchaey et al. (1996a), Mulchaey & Zabludoff (1998) and Helsdon & Ponman (2000a). Additional targets were found by cross-correlating the ROSAT observation log with the positions of optically-selected groups in the catalogs of Huchra & Geller (1982), Geller & Huchra (1983), Maia, Da Costa & Latham (1989), Nolthenius (1993) and Garcia (1993). These catalogs also include richer galaxy systems (i.e. clusters). For the purpose of this paper, we only include “groups” with velocity dispersions less than 600 km/s or an intragroup medium temperature less than 2 keV. A few of the systems we have encountered satisfy one, but not the other criterion. We have opted to include these systems in our sample. In general, we only include groups whose centers fall within 20′ of the center of the ROSAT field. The only exceptions are a few Hickson Compact Groups, which were previously included in Ponman et al. (1996) and are included here for comparison. We have not included HCG 73 in our sample, as it is right at the edge of the ROSAT field. We also eliminated any groups that are projected in front of or behind rich clusters.
The final sample of 109 groups is given in Table 1. The name of each group is given in the first column, followed by the Right Ascension and Declination (columns 2 and 3), the number of cataloged galaxies (column 4), redshift (column 5) and velocity dispersion (column 6). For groups with extended X-ray emission, the right ascensions and declinations are generally given for the peak of the X-ray emission, which was determined in each case from the ROSAT image smoothed with a Gaussian profile of width 30′′. For a few X-ray detected groups, no clear flux peak exists. In these cases, the coordinates refer to the approximate center of the emission morphology. For the non-detected groups, we adopt the coordinates given in the optical group catalogs. Column 7 gives the spiral fraction, defined as the fraction of cataloged members that are late-type galaxies (i.e. spirals and irregulars). We note that the quantities listed in Table 1 have not been calculated to a single minimum absolute magnitude. For most of the groups, the number of members, velocity dispersion and spiral fractions are based on the few brightest ( L⋆) galaxies in the original redshift surveys. However, a few groups have morphologies and membership data down to significantly lower luminosities (Zabludoff & Mulchaey, 1998; Mahdavi et al., 1999). Therefore, some caution should be used when comparing the optical properties of individual groups. Column 8 gives the references for the quantities in columns 2-7. The last column gives the cross references for the group in optical group catalogs.
3 Data Reduction and Analysis
To search for a hot intragroup medium, we follow the reduction method outlined in Mulchaey & Zabludoff (1998). First, to remove times of high particle background, we discard any data taken when the master veto rate is greater than 170 counts s-1. For each ROSAT observation, six images are created corresponding to the R2-R7 energy bands given in Snowden et al. (1994). Each of these images is corrected for vignetting using energy-dependent exposure maps. These individual images are combined to produce two final images; one corresponding to the “standard” energy range 0.45–2.05 keV used in our previous analysis (Mulchaey et al., 1996a; Mulchaey & Zabludoff, 1998) and one that includes the “softer” energy bands ( 0.15-2.05 keV). We created the softer energy band images with the hope of detecting very cool intragroup gas not visible in the standard images. However, in all cases where emission was found in the softer images, it was also detected in the standard image. Given that the background level is much higher in the softer energy bands, all the analysis presented in this paper is based on the standard images.
Before searching for diffuse intragroup gas, we remove emission associated with point sources. Point sources are identified using the task “DETECT” in the Extended Object and X-ray Background Analysis software (Snowden et al., 1994). We note that in the present context, “point source” refers to a source that appears point-like at the resolution of the ROSAT PSPC (FWHM 30′′ on-axis and considerably worse off-axis). Emission from point sources is removed by excluding a circular region around each source with a radius 1.5 times the radius that encircles 90% of the source flux. This exclusion radius corresponds to 1.5′ for sources on-axis (Hassinger et al., 1992). In a few cases, it was necessary to use a slightly larger aperture to remove the flux of more extended sources in the field (such as a very nearby galaxy or a background cluster of galaxies). In most cases where diffuse emission is detected, the emission is centered on a luminous elliptical or S0 galaxy. While the “DETECT” software will usually identify the peak of the extended emission as a “point source” we do not exclude the emission in these cases.
A small fraction of the groups were observed by ROSAT in multiple pointings. In these cases, we reduced the data for each pointing as described above and then combined the images before running the task “DETECT” .
Once the point source emission is removed, the unsmoothed images are examined to determine if a diffuse emission component is present. In addition to a visual inspection, we also create an azimuthally-averaged surface brightness profile for each group to determine if there is excess emission above the background level. Finally, we estimate the excess group counts by adding up the total counts within a radius of 200 h kpc of the group center and subtracting the vignetting-corrected background counts estimated from an outer region of the field. In all cases where the visual inspection implied the presence of diffuse emission, both the surface brightness profile and excess count rate are consistent with the existence of intragroup gas. Furthermore, in all cases where the surface brightness profile suggested the presence of diffuse gas, the visual inspection also indicated a diffuse component.
The results of our diffuse emission search and the spectral properties of the diffuse gas are summarized for each group in Table 2. The second column in Table 2 gives the total useful ROSAT exposure time in seconds. The third column indicates whether diffuse emission was detected or not. Groups that clearly show evidence for diffuse emission are labeled “DE” (for diffuse emission), while the non-detected groups are labeled “UL” (for upper limit). A few of the groups that contain a diffuse component also contain a significant contribution from a central AGN. These hybrid objects are labeled “DE/AGN” in Table 2. For a few groups, emission is detected, but the nature of the emission is such that it might not be associated with the group or might not be truly diffuse. These cases are labeled “DE?” in column 3. In HCG 33, a very faint diffuse component is detected, but it is offset from the optical center of the group by nearly 18.5′ (approximately 400 kpc). Thus, it is unclear whether this emission is associated with the group or a foreground/background object. There are several patches of diffuse emission in the field of HCG 22, but the brightest emission is centered on the background galaxy NGC 1192 and therefore most likely not associated with HCG 22. Several other groups (HCG 15, HCG 35, HCG 48, HCG 57) are clearly detected in the ROSAT image, but are so far off-axis that it is not possible to cleanly separate an intragroup gas component from emission associated with individual galaxies. Column 4 in Table 2 lists the Galactic neutral column density towards the line of site as given in Dickey & Lockman (1990), while column 5 gives the maximum radius of X-ray detection determined from examining the surface brightness profile of each group. Columns 6 and 7 give the temperature and metal abundance, respectively, derived from fits to the ROSAT spectra (see §4). The distance to each group (column 8) has been calculated from the recessional velocity with a correction for infall to Virgo and the Great Attractor (Fixsen et al., 1996). Finally, the bolometric luminosity is given in the last column in Table 2.
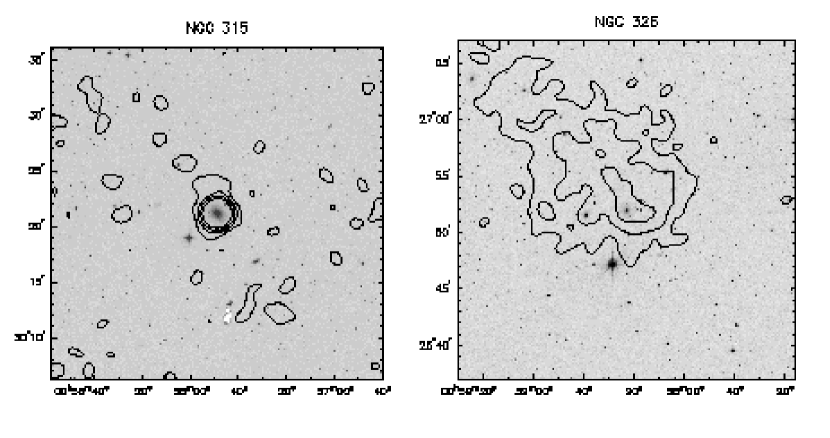
In Figure 1, we overlay contours of the X-ray emission on the STScI Digitized Sky Survey images for all groups that show evidence for diffuse emission. As has been noted in previous studies (Mulchaey et al., 1996a; Mulchaey & Zabludoff, 1998; Helsdon & Ponman, 2000a), the diffuse X-ray emission in groups is almost always peaked on an elliptical or S0 galaxy. The emission associated with the central galaxy has been included in Figure 1 except for the cases where an AGN component clearly dominates. All other emission due to point sources in the field has been removed.
Most of the groups in our survey have round, symmetrical morphologies. These morphologies are consistent with the groups being virialized. However, some groups have very irregular, clumpy morphologies that are not centered on any particular galaxy (e.g. HCG 16, HCG 37, SHK 202, NGC 7777). These groups are likely not virialized (Zabludoff & Mulchaey, 1998; Dos Santos & Mamon, 1999). Five groups have clearly defined bi-modal X-ray distributions (NGC 507, NGC 1407, NGC 3607, NGC 4065 and NGC 7619). In all these cases, the second X-ray peak is also centered on a luminous early-type galaxy. These objects could be groups in the process of merging. Several of the high redshift X-ray groups discovered in the deep Chandra pointing of the Hubble Deep Field North also show evidence for bi-modal X-ray morphologies (Bauer et al., 2002). Although the number of high redshift groups is too small to make any concrete statements, the HDF North data suggests that bi-modal groups may be more common at high redshift (bi-modal groups make up less than 10% of our X-ray detected groups). This idea should be testable in the near future as many more high redshift groups are discovered in deep Chandra and XMM-Newton pointings.
4 Spectral Analysis
For each group with a diffuse emission component, we have attempted to extract a spectrum. The spectra are extracted using a radius that corresponds to the maximum radius of detection determined from examining the surface brightness profile of each group (RX; see column 5 in Table 2). Point sources are excluded from the spectrum using the exclusion radii described above (§3). The vignetting-corrected background is estimated in most cases from an annulus with inner radius 36′ and outer radius 42′. In a few cases, a different background region is used to avoid the presence of a luminous cluster of galaxies.
To derive the spectral properties of the diffuse gas, we fit the spectra using the software package XSPEC. For those groups with multiple ROSAT pointings, we fit the individual spectra from each pointing simultaneously. We fit the spectra with an absorbed MEKAL plasma model (Mewe, Gronenschild & van den Oord, 1985; Kaastra & Mewe, 1993; Liedahl, Osterheld & Goldstein, 1995). We fix the absorbing column at the Galactic value given in Dickey & Lockman (1990). For most of the groups, we are unable to constrain the metallicity of the gas with the ROSAT data. In these cases, we fix the gas metallicity to 0.3 solar. For consistency with previous X-ray studies, we adopt the old photospheric value for the solar Fe abundance. To renormalize to the meteoritic value, our metallicity measurements should be increased by a factor of approximately 1.44. For those groups with sufficient data to fit the metallicity explicitly, we also perform spectral fits with the metallicity fixed at 0.3 solar.
The quoted errors on the temperature and metallicity measurements are at the 90% confidence level. In the UGC 1651 group, the temperature cannot be adequately constrained and no errors are given. The derived temperatures range from 0.3 keV to over 2 keV ( 3.5 106K - 2.3 107 K), with the vast majority of groups centered around 1 keV ( 1.2 107 K; see Figure 2). Groups cooler than 0.3 keV would be difficult to detect with ROSAT because of the high surface brightness of the X-ray background at these soft energies and heavy absorption by Galactic HI (Mulchaey et al., 1996b). Most systems above 2 keV would normally be considered clusters and were thus eliminated from our original sample. To examine how the derived temperatures depend on the assumed metallicity, we compare the derived temperatures for the groups where both a fixed metallicity and variable metallicity model were used (Figure 3). In general, the temperatures are not very sensitive to the assumed metallicity. An exception to this is the NGC 383 group. In this case, fixing the metallicity at a value of 0.3 solar leads to a temperature over twice that found in the variable abundance case.
In general, there is good agreement between the temperatures we derive and previous studies of the same groups with ROSAT. Figure 4 shows a comparison of the temperatures from our survey with the temperatures in Helsdon & Ponman (2000b). The agreement is good despite the fact that different apertures were used for the spectral extractions in many cases. In particular, the Helsdon & Ponman (2000b) temperatures for most of the Hickson Compact Groups were derived using a fixed physical size on the sky, while we use the maximum radius of detection for our extractions.
There is less agreement between our derived temperatures and those measured with the ASCA X-ray telescope. Figure 5 compares the temperatures derived from these two telescopes for all groups in our survey with published ASCA measurements. While the ROSAT and ASCA measurements are similar for cool groups, there are big differences for hotter systems. Above 1 keV, the ASCA temperatures tend to be higher than the ROSAT temperatures by as much as 50%. This trend has been previously noted by Hwang et al. (1999) and Horner (2001). Given the higher energy resolution and bandpass of ASCA, it seems likely the temperatures from this instrument are more reliable. Future observations with Chandra and XMM-Newton should allow more accurate measurements of the X-ray temperatures in hotter groups.
In Figure 6 we compare the metal abundances derived in our ROSAT survey with abundances derived from ASCA observations. While there is considerable scatter in the plot, both the ROSAT and ASCA data are consistent with sub-solar abundances in most cases. However, the reliability of metallicity measurements with these telescopes have been called into question (Bauer & Bregman, 1996; Buote, 1999, 2000).
The bolometric luminosity of each detected group was estimated from the best-fit MEKAL model assuming the distance to the group given in column 8 of Table 2. To estimate the errors on the luminosities, we varied the temperature and metallicity over their 90% confidence ranges. For those groups without a metallicity measurement, we assume a metallicity range from 0.0 to 1.0 solar. The luminosities are calculated out to the radius used in the spectral extractions. As this radius is usually a fraction of the virial radius of each group, the true bolometric luminosities for these groups could be substantially higher (Helsdon & Ponman, 2000a; Mulchaey, 2000; Horner, 2001). The bolometric luminosities for the X-ray detected groups in our sample span four orders of magnitude (from 1040 to 1044 h100-2 ergs s-1; see Figure 7). A comparison of our estimated bolometric luminosities with the common groups in Helsdon & Ponman (2000b) reveals good agreement (see Figure 8). We also compare our bolometric luminosities with luminosities derived from ASCA observations (Figure 9). In general, the ASCA luminosities are somewhat lower than the ROSAT-derived luminosities. This result is not surprising given that the ASCA luminosities are generally derived from smaller apertures.
Figure 10 plots the virial fraction versus the temperature of the system for the X-ray detected groups in our sample (groups with poorly constrained temperatures have been excluded). This plot indicates that the majority of groups are detected to less than half of the virial radius. There is also a trend for the hotter groups to be detected to a larger fraction of the virial radius (Mulchaey, 2000). This trend is important because it suggests that a larger fraction of the gas mass, and thus, X-ray luminosity is detected in the hotter systems. This trend continues to rich clusters of galaxies which are in general detected out to approximately the virial radius (Mulchaey, 2000).
For the groups that were not detected, we estimate upper limits on the X-ray luminosities using a method similar to that described in Mulchaey et al. (1996a). First, we measure the net counts (N) and rms error () in a region 200 h-1 kpc in radius centered on each group (for a few nearby groups it was necessary to adopt a radius smaller than 200 h-1 kpc; see Table 2). We then calculate the flux a MEKAL plasma of temperature 1 keV and abundance 0.3 solar would need to produce N+3 (if N0) or 3 (if N 0) counts.
5 Spatial Analysis
For each group with a detected diffuse component we have fit the two-dimensional surface brightness profile using a modified King function (the so-called ‘-model’):
S(R)=So (1.0 + (R/Rcore)2)-3β+0.5.
The model is first convolved with the 1 keV ROSAT PSPC point spread function, and then fit to the data with So, Rcore, and the position of the center of the emission as free parameters. Following Helsdon & Ponman (2000a), we also fit both circular and elliptical fits. In the latter fits, the ellipticity and position angle are additional free parameters. The results of the elliptical fits are given in Table 3. During the fits, each free parameter was allowed to vary between a reasonable lower and upper bound. For a large number of groups, the best-fit core radius was at the lower bound value (0.1′). This value is smaller than the resolution of the ROSAT PSPC. In these cases, the core radius is listed as ‘0.1’ in Table 3. To determine what effect this lower bound might have on the other derived parameters, we fit a number of groups again without the lower bound. These fits suggest that removing the lower bound on Rcore has a minimal impact on the derived values of and ellipticity (see also the similar finding of Helsdon & Ponman (2000a)).
The goodness of each fit was estimated using -squared statistics. Because the number of counts in each bin is small, we use the prescription of Gehrels (1986) to calculate the standard deviation. While the single- models fits provide an adequate description of the images in some cases, in general the fits are poor. Previous studies of X-ray luminous groups indicate that the surface brightness profiles of groups are complicated, often requiring multiple components to adequately describe the data (Mulchaey & Zabludoff, 1998; Helsdon & Ponman, 2000a). In particular, single King models tend to underestimate the flux at the very centers of luminous groups. Mulchaey & Zabludoff (1998) suggested that groups contain two components, one associated with the central galaxy (the ‘central’ component) and a second component associated with the group as a whole (the ‘extended’ component). For those groups in our sample with a sufficient number of counts ( 1000), we fit the two-dimensional surface brightness profiles with a two-component model. Initially, we experimented with allowing both components to be elliptical in shape (i.e. let the ellipticity and position angle be free parameters). We found, however, that it was not possible to constrain these fits in most cases. Next, we adapted the proceedure used by Helsdon & Ponman (2000a) and allowed one of the components to be elliptical and required the other to be circular. While these models provided adequate fits to some groups, it was often necessary to restrict the number of free parameters even further in some cases. In particular, the values for the circular models often reached unphysically high values. When this occurred, we fit the surface brightness profiles again with the value of the core component fixed at a value of 1.0 (Helsdon & Ponman (2000a) encountered a similar problem in their fits; Stephen Helsdon, private communication). In those cases where a double -model fit was performed, the results are given in Table 3. Note that for the double -model fits, the elliptical component is always listed first (i.e. the elliptical component is identified as the ‘extended component’). In a few cases, this results in the core radius of the ‘extended component’ being smaller than the core radius of the ‘central component’.
Figure 11 shows the distribution of extended component values for our group sample (we adopt the two component fits where available). The mean value of for the sample is 0.47. This value is in excellent agreement with the weighted mean that Helsdon & Ponman (2000a) find for their sample (0.46) and is somewhat lower than the typical value found for rich clusters (Arnaud & Evrard, 1999; Mohr, Mathiesen & Evrard, 1999).
6 Detection Statistics
The existence of a hot intragroup medium in poor groups of galaxies has been firmly established over the past decade. However, the frequency of diffuse X-ray emission in groups is still rather uncertain. Most previous studies using ROSAT ‘pointed mode’ data have been restricted to rather small samples selected in a potentially biased way. For example, many of the targets in these surveys were a priori known to be bright X-ray sources based on previous detection (i.e. in the ROSAT All-Sky Survey). Furthermore, a significant fraction of the groups studied to date come from the Hickson Compact Group catalog, which may not be representative of groups in general (see, however Helsdon & Ponman (2000b)). Mahdavi et al. (2000) attempted to overcome these problems by looking for X-ray emission in the ROSAT All-Sky Survey data for a large sample of groups selected from the CfA redshift survey. Correcting for selection effects, Mahdavi et al. (2000) estimate that approximately 40% of groups are extended X-ray sources.
Our present survey represents the largest sample of groups studied to date with ROSAT PSPC ‘pointed mode’ data. Diffuse emission is detected in at least 61 of the 109 groups (56%) in our sample (not counting the 6 questionable detections) down to the detection limits of our survey. Unfortunately, our sample is plagued by the same biasing issues that effect the earlier pointed mode studies. A deep X-ray survey of a large, optically-selected group sample should be a priority for the current generation of X-ray telescopes.
Early studies of groups with ROSAT suggested that X-ray emission is largely restricted to systems with low spiral fractions (Ebeling, Voges & Böhringer, 1994; Pildis, Bregman & Evrard, 1995; Mulchaey et al., 1996a). However, Ponman et al. (1996) found that some spiral-rich groups do indeed contain X-ray emission. Figure 12 shows the distribution of spiral-fractions for our entire sample and for the X-ray detected groups. This figure is consistent with Ponman et al. (1996)’s suggestion that some spiral-rich groups are X-ray detected. Interestingly, however, all of the groups with a detectable intragroup medium contain at least one early-type galaxy. Therefore, the ROSAT data are consistent with no spiral-only groups containing a detectable hot intragroup medium.
Several explanations for the failure to detect spiral groups in X-rays have been proposed. One possibility is that spiral-only groups are not real, physical systems, but rather chance superpositions of galaxies along the sight. However, our own Local Group would be defined as “spiral-only” if it was placed at the distance typical of the groups in our survey (Zabludoff & Mulchaey, 1998). Therefore, this possibility seems unlikely. Another possibility is that the gas density is significantly lower in spiral-only groups. Lower gas density in spiral groups may in fact be consistent with expectations from recent preheating models (Ponman, Cannon & Navarro, 1999). The temperature of the gas in spiral-only groups may also be too cool to produce detectable X-ray emission (Mulchaey et al., 1996b). Based on their velocity dispersions, the virial temperatures of spiral-only groups do tend to be lower than those of their early-type dominated counterparts. A “warm” intragroup medium might produce detectable features in the far-ultraviolet or X-ray spectra of background quasars (Mulchaey et al., 1996b; Perna & Loeb, 1998; Hellsten, Gnedin & Miralda-Escude, 1998). High-ionization absorption line features consistent with cooler groups have recently been reported. For example, Fang et al. (2002) have reported the detection of an O VIII Ly absorption line associated with a spiral group along the sightline towards PKS 2155-304. Similarly, some of the O VI systems found with HST and FUSE may be consistent with an origin in small galaxy groups (Savage et al., 2002). Further absorption studies should provide insight into the presence of warm intragroup gas in spiral-only groups.
7 Summary
We have searched for diffuse X-ray emission in 109 nearby galaxy groups using data taken with the ROSAT PSPC during its ‘pointed mode’ phase. We find evidence for a hot intragroup medium in approximately half of the groups in our sample. Although we detect many spiral-rich groups, none of the spiral-only groups in our survey show clear evidence for the presence of diffuse X-ray emission. Spiral-only groups may contain intragroup gas, but the temperature or gas density may be too low to produce appreciable X-ray emission.
In general, nearby groups are detected to only a fraction of the virial radius with the ROSAT PSPC. Therefore, a significant amount of the gas mass likely occurs beyond the current X-ray detection radius. Future observations with Chandra and XMM-Newton should provide further insight into the distribution of hot gas in these cosmologically-important systems.
References
- Arnaud & Evrard (1999) Arnaud, M., and Evrard, A. E. 1999, MNRAS, 305, 631
- Bauer & Bregman (1996) Bauer, F., and Bregman, J. N. 1996, ApJ, 457, 382
- Bauer et al. (2002) Bauer, F. E., et al. 2002, ApJ, in press
- Bialek, Evrard & Mohr (2001) Bialek, J. J., Evrard, A. E., and Mohr, J. J. 2001, ApJ, 555, 597
- Buote (1999) Buote, D. A. 1999, MNRAS, 309, 685
- Buote (2000) Buote, D. A. 2000, MNRAS, 311, 176
- Borgani et al. (2001) Borgani, S. et al. 2001, ApJ, 559, 71
- Bryan (2000) Bryan, G. L. 2000, ApJ, 544, L1
- Cavaliere, Menci & Tozzi (1998) Cavaliere, A., Menci, N., and Tozzi, P. 1998, ApJ, 501, 493
- Cowie, Henriksen & Mushotzky (1987) Cowie, L. L., Henriksen, M., and Mushotzky, R. F. 1987, ApJ, 317, 593
- David et al. (1994) David, L. P., Jones, C., Forman, W., and Daines, S. 1994, ApJ, 428, 544
- Davis et al. (1995) Davis, D. S., Mushotzky, R. F., Mulchaey, J. S., Worrall, D. M., Birkinshaw, M., and Burstein, D. 1995, ApJ, 444, 582
- Dickey & Lockman (1990) Dickey, J. M., and Lockman, F. J. 1990, ARA&A, 28, 215
- Doe et al. (1995) Doe, S. M., Ledlow, M. J., Burns, J. O., and White, R. A. 1995, AJ, 110, 46
- Dos Santos & Mamon (1999) Dos Santos, S., and Mamon, G. A. 1999, A&A, 352, 1
- Ebeling, Voges & Böhringer (1994) Ebeling, H., Voges, W., Böhringer, H. 1994, ApJ, 436, 44
- Evrard, Metzler & Navarro (1996) Evrard, A. E., Metzler, C. A., Navarro, J. F. 1996, ApJ, 469, 494
- Fabricant & Gorenstein (1983) Fabricant, D., and Gorenstein, P. 1983, ApJ, 267, 535
- Fabricant et al. (1980) Fabricant, D., Lecar, M., and Gorenstein, P. 1980, ApJ, 241, 552
- Fabricant et al. (1984) Fabricant, D., Rybicki, G., and Gorenstein, P. 1984, ApJ, 286, 186
- Fang et al. (2002) Fang, T., Marshall, H. L., Lee, J. C., Davis, D. S., and Canizares, C. R. 2002, ApJ, in press
- Finoguenov, David & Ponman (2000) Finoguenov,A., David, L. P., Ponman, T. J. 2000, ApJ, 544, 188
- Fixsen et al. (1996) Fixsen, D. J., Cheng, E. S., Gales, J. M., Mather, J. C., Shafer, R. A., Wright, E. L. 1996, ApJ, 473, 576
- Fujita & Takahara (2000) Fujita, Y., and Takahara, F. 2000, ApJ, 536, 523
- Fukugita, Hogan & Peebles (1998) Fukugita, M., Hogan, C. J., and Peebles, P. J. E. 1998, ApJ, 503, 518
- Garcia (1993) Garcia, A. M. 1993, A&AS, 100, 47
- Gehrels (1986) Gehrels, N. 1986, ApJ, 303, 336
- Geller & Huchra (1983) Geller, M. J., and Huchra, J. P. 1983, ApJS, 52, 61
- Hassinger et al. (1992) Hasinger, G., Turner, T. J., George, I. M., and Boese, G. 1992, NASA/GSFC Office of Guest Investigator Programs, Calibration Memo CAL/ROS92-001
- Hellsten, Gnedin & Miralda-Escude (1998) Hellsten, U., Gnedin, N.Y., and Miralda-Escude, J. 1998, ApJ, 509, 56
- Helsdon & Ponman (2000a) Helsdon, S. F., and Ponman, T. J. 2000a, MNRAS, 315, 356
- Helsdon & Ponman (2000b) Helsdon, S. F., and Ponman, T. J. 2000b, MNRAS, 319, 933
- Henry et al. (1995) Henry, J. P., Gioia, I. M., Huchra, J. P., Burg, R., McLean, B., et al. 1995, ApJ, 449, 422
- Hickson (1982) Hickson, P. 1982, ApJ, 255, 382
- Hickson, Kindl & Auman (1989) Hickson, P., Huchra, J., and Kindl, E. 1989, ApJS, 70, 687
- Hickson et al. (1992) Hickson, P., Mendes de Oliveira, C., Huchra, J. P., and Palumbo, G. G. 1992, ApJ, 399, 353
- Horner (2001) Horner, D. J. 2001, Ph D thesis, U. of Maryland
- Huchra & Geller (1982) Huchra, J. P., and Geller, M. J. 1982, ApJ, 257, 423
- Hwang et al. (1999) Hwang, U., Mushotzky, R. F., Burns, J. O., Fukazawa, Y, White, R. A. 1999, ApJ, 516, 604
- Kaastra & Mewe (1993) Kaastra, J. S., and Mewe, R. 1993, A&AS, 97, 443
- Liedahl, Osterheld & Goldstein (1995) Liedahl, D. A., Osterheld, A. L., and Goldstein, W. H. 1995, ApJ, 438, L 115
- Lloyd-Davies, Ponman & Cannon (2000) Lloyd-Davies, E. J., Ponman, T. J., and Cannon, D. B. 2000, MNRAS, 315, 689
- Loewenstein (2000) Loewenstein, M. 2000, ApJ, 532, 17
- Maia, Da Costa & Latham (1989) Maia, M. A. G., da Costa, L. M., Latham, D. W. 1989, ApJS, 69, 809
- Mahdavi et al. (1997) Mahdavi, A., Böhringer, H., Geller, M. J., and Ramella, M. 1997, ApJ, 483, 68
- Mahdavi et al. (1999) Mahdavi, A., Geller, M. J., Böhringer, H., Kurtz, M. J., and Ramella, M. 1999, ApJ, 518, 69
- Mahdavi et al. (2000) Mahdavi, A., Böhringer, H., Geller, M. J., and Ramella, M. 2000, ApJ, 534, 114
- Mewe, Gronenschild & van den Oord (1985) Mewe, R., Gronenschild, E. H. B. M., and van den Oord, G. H. J. 1985, A&AS, 35, 503
- Mohr, Mathiesen & Evrard (1999) Mohr, J. J., Mathiesen, B., and Evrard, A. E. 1999, ApJ, 517, 627
- Mulchaey (2000) Mulchaey, J. S. 2000, ARA&A, 38, 289
- Mulchaey et al. (1993) Mulchaey, J. S., Davis, D. S., Mushotzky, R. F., and Burstein, D. 1993, ApJ, 404, L9
- Mulchaey et al. (1996a) Mulchaey, J. S., Davis, D. S., Mushotzky, R. F., and Burstein, D. 1996a, ApJ, 456, 80
- Mulchaey et al. (1996b) Mulchaey, J. S., Mushotzky, R. F., Burstein, D., and Davis, D. S. 1996b, ApJ, 456, L5
- Mulchaey & Zabludoff (1998) Mulchaey, J. S., and Zabludoff, A. I. 1998, ApJ, 496, 73
- Navarro, Frenk & White (1997) Navarro, J. F., Frenk, C. S., and White, S. D. M. 1997, ApJ, 490, 493
- Nolthenius (1993) Nolthenius, R. 1993, ApJS, 85, 1
- Nolthenius & White (1987) Nolthenius, R., and White, S. D. M. 1987, MNRAS, 225, 505
- Perna & Loeb (1998) Perna, R., and Loeb, A. 1998, ApJ, 503, L135
- Pierre, Bryan & Gastaud (2000) Pierre, M., Bryan, G., and Gastaud, R. 2000, A&A, 356, 403
- Pildis, Bregman & Evrard (1995) Pildis, R. A., Bregman, J. N., and Evrard, A. E. 1995, ApJ, 443, 514
- Ponman & Bertram (1993) Ponman, T. J., and Bertram 1993, Nature, 363, 51
- Ponman et al. (1996) Ponman, T. J., Bourner, P. D. J., Ebeling, H., Böhringer, H. 1996, MNRAS, 283, 690
- Ponman, Cannon & Navarro (1999) Ponman, T. J., Cannon, D. B., and Navarro, J. F. 1999, Nature, 397, 135
- Ribeiro et al. (1998) Ribeiro, A. L., de Carvalho, R. R., Capelato, H. V., and Zepf, S. E. 1998, ApJ, 497, 72
- Saracco & Ciliegi (1995) Saracco, P., and Ciliegi, P. 1995, A&A, 301, 348
- Savage et al. (2002) Savage, B. D., Sembach, K. R., Tripp, T. M., and Richter, P. 2002, ApJ, 564, 631
- Snowden et al. (1994) Snowden, S. L., McCammon, D., Burrows, D. N., and Mendehall, J. A. 1994, ApJ, 424, 714
- Tully (1987) Tully, R. B. 1987, ApJ, 321, 280
- Valageas & Silk (1999) Valageas, P., and Silk, J. 1999, A&A, 350, 725
- Werner, Worrall & Birkinshaw (1999) Werner, P. N., Worrall, D. M., and Birkinshaw, M. 1999, MNRAS, 307, 722
- Willmer et al. (1991) Willmer, C. N. A., Focardi, P., Chan, R., Pellegrini, P. S., da Costa, N. L. 1991, AJ, 101, 57
- Willmer et al. (1999) Willmer, C. N. A., Maia, M. A. G., Mendes, S. O., Alonso, M. V., Rios, L. A., Chaves, O. L., and de Mello, D. F. 1999, AJ, 118, 1131
- Yamada & Fujita (2001) Yamada, M., and Fujita, Y. 2001, ApJ, 553, L145
- Zabludoff & Mulchaey (1998) Zabludoff, A. I., and Mulchaey, J. S. 1998, ApJ, 496, 39
- Zabludoff & Mulchaey (2000) Zabludoff, A. I., and Mulchaey, J. S. 2000, ApJ, 539, 136
- Zimer, Zabludoff, & Mulchaey (2002) Zimer, M., Zabludoff, A. I., and Mulchaey, J. S. 2002, in preparation


| Group | RA | Dec | Ngal | z | fspiral | ref | Catalog | |
|---|---|---|---|---|---|---|---|---|
| (J2000) | (J2000) | km/s | Name1 | |||||
| NGC 7805 | 00 02 28.0 | +31 28 42.1 | 3 | 0.0164 | 71 | 0.66 | 1 | G1/GH176/N173 |
| NGC 43 | 00 13 05.8 | +30 58 40.8 | 3 | 0.0160 | 63 | 0.33 | 1 | G1/N1 |
| HCG 2 | 00 31 30.0 | +08 25 52.5 | 3 | 0.0144 | 55 | 1.00 | 2,3 | H2 |
| HCG 4 | 00 34 16.0 | -21 26 48.0 | 5 | 0.0245 | 775 | 0.66 | 4,5 | H4 |
| HCG 3 | 00 34 27.5 | -07 35 34.2 | 3 | 0.0255 | 251 | 0.33 | 2,3 | H3 |
| IC 1559 | 00 36 38.3 | +23 58 30.2 | 3 | 0.0158 | 470 | 0.33 | 6 | GH5 |
| NGC 315 | 00 57 48.9 | +30 21 08.8 | 4 | 0.0164 | 122 | 0.25 | 1 | G14/GH8/N6 |
| NGC 326 | 00 58 22.3 | +26 52 03.7 | 9 | 0.0477 | 674 | 0.00 | 5,7 | - |
| NGC 383 | 01 07 25.0 | +32 24 45.2 | 40 | 0.0173 | 567 | 0.50 | 8,6 | G18/GH9 |
| NGC 491 | 01 20 42.3 | -34 01 17.3 | 6 | 0.0126 | 86 | 1.00 | 9 | MDL58 |
| NGC 507 | 01 23 40.0 | +33 15 20.0 | 21 | 0.0170 | 179 | 0.82 | 10 | G26 |
| NGC 524 | 01 24 47.8 | +09 32 19.0 | 8 | 0.0083 | 205 | 0.50 | 1 | G23/GH13/N11 |
| NGC 533 | 01 25 31.4 | +01 45 32.8 | 36 | 0.0181 | 464 | 0.39 | 9 | GH14 |
| HCG 10 | 01 26 07.4 | +34 41 27.4 | 4 | 0.0161 | 209 | 0.75 | 2,3 | G26/H10 |
| HCG 12 | 01 27 33.2 | -04 40 40.3 | 5 | 0.0485 | 240 | 0.20 | 2,3 | H12 |
| NGC 584 | 01 33 21.5 | -07 01 16.5 | 4 | 0.0066 | 107 | 0.63 | 10 | G27/HG45 |
| NGC 664 | 01 44 02.7 | +04 19 02 | 6 | 0.0180 | 130 | 1.00 | 9 | - |
| NGC 720 | 01 53 00.5 | -13 44 18.4 | 4 | 0.0059 | 161 | 0.75 | 10 | G38 |
| NGC 741 | 01 56 21.0 | +05 37 44.2 | 41 | 0.0185 | 432 | 0.44 | 9 | N20 |
| HCG 15 | 02 07 37.6 | +02 10 40.8 | 6 | 0.0228 | 427 | 0.50 | 2,3 | H15 |
| HCG 16 | 02 09 27.1 | -10 07 37.2 | 9 | 0.0131 | 85 | 0.86 | 8,4,5 | G49/H16 |
| UGC 1651 | 02 09 38.2 | +35 47 49.8 | 3 | 0.0363 | 111 | 0.00 | 5 | - |
| HCG 18 | 02 39 06.8 | +18 22 59.1 | 3 | 0.0137 | 31 | 1.00 | 5 | H18 |
| NGC 1044 | 02 41 06.3 | +08 44 18.2 | 13 | 0.0205 | 325 | 0.66 | 5 | - |
| IC 1860 | 02 49 33.4 | -31 11 27.1 | 28 | 0.0231 | 452 | 0.32 | 5 | MDL67 |
| HCG 22 | 03 03 31.3 | -15 40 32.5 | 8 | 0.0090 | 183 | 0.75 | 4,5,8 | G81/H22 |
| IC 1880 | 03 06 28.4 | -09 43 42.5 | 7 | 0.0338 | 208 | 0.50 | 5 | - |
| HCG 23 | 03 07 06.5 | -09 35 07.7 | 14 | 0.0152 | 339 | 0.40 | 8,4,5 | H23 |
| HCG 26 | 03 21 54.2 | -13 38 45.1 | 7 | 0.0316 | 200 | 0.57 | 2,3 | H26 |
| NGC 1332 | 03 26 17.1 | -21 20 05.1 | 6 | 0.0052 | 347 | 0.50 | 5 | G97/HG32 |
| UGC 2755 | 03 29 24.0 | +39 47 35.2 | 5 | 0.0230 | 406 | 0.66 | 5 | - |
| NGC 1399 | 03 38 29.3 | -35 27 02.3 | 55 | 0.0036 | 312 | 0.55 | 11 | G96/HG17/MDL52 |
| NGC 1407 | 03 40 16.4 | -18 35 41.7 | 8 | 0.0057 | 145 | 0.25 | 10 | G100/HG32 |
| NGC 1587 | 04 30 40.6 | +00 40 00.6 | 4 | 0.0122 | 106 | 0.50 | 1 | G117/N33 |
| HCG 31 | 05 01 40.3 | -01 15 24.3 | 11 | 0.0131 | 141 | 1.00 | 8,2,3 | G123/H31 |
| HCG 33 | 05 10 47.9 | +18 02 04.7 | 4 | 0.0260 | 155 | 0.25 | 2,3 | H33 |
| NGC 1961 | 05 43 51.8 | +69 18 09.4 | 4 | 0.0139 | 139 | 1.00 | 10 | G132 |
| NGC 2300 | 07 32 14.2 | +85 42 33.7 | 13 | 0.0069 | 228 | 0.66 | 5,8 | G145/HG92 |
| NGC 2484 | 07 58 28.2 | +37 47 12.9 | 2 | 0.0415 | - | 0.00 | 5 | - |
| NGC 2563 | 08 20 35.7 | +21 04 03.9 | 44 | 0.0159 | 419 | 0.72 | 12 | G158 |
| HCG 35 | 08 45 19.0 | +44 30 54.7 | 6 | 0.0542 | 316 | 0.20 | 2,3 | H35 |
| NGC 2769 | 09 10 22.8 | +50 23 45.3 | 3 | 0.0166 | 125 | 1.00 | 1 | G168/N35 |
| HCG 37 | 09 13 47.3 | +30 00 37.1 | 5 | 0.0223 | 398 | 0.40 | 2,3 | GH42/H37 |
| NGC 2805 | 09 23 12.8 | +63 47 09.0 | 4 | 0.0055 | 69 | 0.50 | 1 | G186/GH46/N36 |
| HCG 38 | 09 27 38.9 | +12 16 50.9 | 3 | 0.0292 | 13 | 1.00 | 2,3 | H38 |
| HCG 40 | 09 38 54.5 | -04 51 05.1 | 7 | 0.0221 | 280 | 0.50 | 4,5 | H40 |
| HCG 42 | 10 00 14.3 | -19 38 13.3 | 35 | 0.0128 | 266 | 0.57 | 12 | G186/HG37/H42 |
| HCG 44 | 10 18 00.5 | +21 48 44.1 | 4 | 0.0046 | 135 | 0.50 | 2,3 | G194/H44/N43 |
| MKW 2 | 10 30 10.4 | -03 09 55.0 | 33 | 0.0365 | 603 | 0.20 | 5 | - |
| HCG 48 | 10 37 50.0 | -27 07 17.5 | 3 | 0.0094 | 302 | 0.33 | 2,3 | G210/H48 |
| CGCG154-041 | 10 43 18.7 | +31 31 07.0 | 4 | 0.0350 | 312 | - | 5 | - |
| NGC 3396 | 10 50 41.1 | +33 13 17.3 | 6 | 0.0053 | 73 | 1.00 | 10 | G218/GH67/HG65/N 55 |
| NGC 3557 | 11 09 57.4 | -37 32 17.1 | 22 | 0.0095 | 282 | 0.63 | 5,12 | G229 |
| NGC 3607 | 11 16 54.1 | +18 03 18.9 | 7 | 0.0037 | 92 | 0.86 | 1 | N66 |
| HCG 50 | 11 17 06.1 | +54 55 06.7 | 5 | 0.1391 | 468 | 0.00 | 2,3 | H50 |
| NGC 3647 | 11 21 45.8 | +02 51 40.0 | 6 | 0.0495 | 383 | 0.00 | 5 | - |
| NGC 3665 | 11 24 43.5 | +38 45 43.4 | 4 | 0.0069 | 29 | 0.25 | 1 | G236/GH79/N68 |
| HCG 57 | 11 37 52.9 | +21 58 17.8 | 7 | 0.0304 | 269 | 0.43 | 2,3 | H57 |
| HCG 58 | 11 42 10.8 | +10 18 24.0 | 5 | 0.0206 | 215 | 0.60 | 1 | H58/N82 |
| NGC 3923 | 11 51 01.6 | -28 48 19.9 | 5 | 0.0046 | 98 | 0.40 | 10 | G255 |
| NGC 4065 | 12 04 09.1 | +20 17 06.0 | 7 | 0.0232 | 482 | 0.43 | 1 | N91 |
| NGC 4073 | 12 04 27.4 | +01 53 42.4 | 19 | 0.0201 | 698 | 0.22 | 5 | - |
| NGC 4104 | 12 06 45.4 | +28 10 11.9 | 8 | 0.0286 | 423 | 0.14 | 5 | - |
| NGC 4125 | 12 08 06.6 | +65 10 28.9 | 3 | 0.0050 | 58 | 0.66 | 10 | G274/GH94 |
| NGC 4168 | 12 13 38.9 | +13 01 19.3 | 4 | 0.0077 | 152 | 0.50 | 1 | N98 |
| NGC 4261 | 12 19 23.5 | +05 49 36.4 | 8 | 0.0068 | 108 | 0.50 | 10 | G278/GH106/HG41/N99 |
| SHK 202 | 12 19 44.2 | +28 26 35.2 | 5 | 0.0267 | 600 | 0.00 | 5 | - |
| NGC 4278 | 12 20 06.8 | +29 16 50.7 | 17 | 0.0032 | 191 | 0.71 | 10 | G279/GH94/HG60/N100 |
| NGC 4357 | 12 20 51.1 | +49 18 21.7 | 3 | 0.0142 | 273 | 0.66 | 6 | GH103 |
| NGC 4325 | 12 23 06.6 | +10 37 13.2 | 26 | 0.0254 | 328 | 0.66 | 12 | - |
| NGC 4291 | 12 24 41.2 | +75 19 56.4 | 11 | 0.0068 | 132 | 0.73 | 10 | G284/GH107/HG88 |
| NGC 4615 | 12 41 16.0 | +26 13 33.1 | 3 | 0.0158 | 47 | 0.33 | 1 | N108 |
| NGC 4636 | 12 42 49.8 | +02 41 14.3 | 12 | 0.0044 | 463 | 0.83 | 1 | N104 |
| HCG 62 | 12 53 06.1 | -09 12 16.3 | 63 | 0.0145 | 390 | 0.47 | 12 | H62 |
| NGC 5044 | 13 15 26.1 | -16 23 01.7 | 9 | 0.0082 | 119 | 0.56 | 10 | G338 |
| NGC 5101 | 13 18 57.0 | -26 53 39.5 | 10 | 0.0062 | 144 | 0.80 | 10 | G341/HG31 |
| NGC 5129 | 13 24 10.0 | +13 58 42.3 | 38 | 0.0233 | 304 | 0.65 | 12 | GH117/N117 |
| NGC 5171 | 13 29 24.3 | +11 44 11.9 | 15 | 0.0232 | 477 | 0.00 | 5 | - |
| NGC 5218 | 13 32 42.3 | +62 34 41.5 | 3 | 0.0103 | 132 | 0.66 | 10 | G354/GH122/N120 |
| IC 4296 | 13 36 41.5 | -34 00 32.4 | 29 | 0.0125 | 228 | 0.69 | 13 | - |
| HCG 67 | 13 49 12.3 | -07 12 34.3 | 14 | 0.0248 | 351 | 0.50 | 4,5 | H67 |
| NGC 5322 | 13 49 14.7 | +60 11 27.4 | 8 | 0.0065 | 196 | 0.37 | 1 | G360/N123 |
| HCG 68 | 13 53 27.1 | +40 16 55.9 | 5 | 0.0080 | 155 | 0.20 | 2,3 | G363/H68/N124 |
| NGC 5374 | 13 58 00.1 | +06 15 25.0 | 3 | 0.0143 | 9 | 0.33 | 1 | G368/GH127/N129 |
| NGC 5775 | 14 53 24.9 | +03 29 47.5 | 5 | 0.0051 | 88 | 0.80 | 1 | G387/GH148/N143 |
| NGC 5846 | 15 06 29.4 | +01 36 12.3 | 20 | 0.0063 | 368 | 0.73 | 9 | G393/GH150/HG50/N146 |
| NGC 5866 | 15 16 23.7 | +56 25 01.9 | 4 | 0.0022 | 74 | 0.75 | 1 | G396/GH152/HG78/N147 |
| NGC 5929 | 15 26 18.1 | +41 05 34.2 | 3 | 0.0086 | 66 | 1.00 | 1 | G399/GH153/N150 |
| NGC 5970 | 15 36 16.2 | +12 02 07.7 | 3 | 0.0064 | 81 | 1.00 | 1 | G401/GH157/N154 |
| NGC 6052 | 15 59 31.1 | +20 32 33.0 | 11 | 0.0154 | 183 | 0.82 | 10 | G403/GH161/N158 |
| NGC 6109 | 16 17 26.9 | +34 55 23.5 | 53 | 0.0312 | 563 | 0.53 | 15 | - |
| NGC 6251 | 16 32 32.3 | +82 32 15.0 | 2 | 0.0221 | - | 0.00 | 5 | - |
| HCG 84 | 16 44 08.1 | +77 50 09.3 | 5 | 0.0556 | 204 | 0.20 | 2,3 | H84 |
| ARP 330 | 16 49 11.8 | +53 25 12.0 | 8 | 0.0298 | 369 | 0.20 | 5 | - |
| NGC 6269 | 16 57 54.4 | +27 52 17.8 | 46 | 0.0353 | 586 | 0.35 | 8,5 | - |
| NGC 6329 | 17 14 14.4 | +43 41 01.2 | 13 | 0.0274 | 419 | 0.83 | 5 | - |
| NGC 6338 | 17 15 22.9 | +57 24 38.1 | 11 | 0.0284 | 538 | 0.38 | 5 | - |
| HCG 90 | 22 01 59.5 | -31 57 50.4 | 16 | 0.0085 | 193 | 0.75 | 9 | H90/G450/MDL59 |
| UGC 12064 | 22 31 21.3 | +39 21 21.7 | 9 | 0.0166 | 399 | 0.75 | 5 | - |
| HCG 92 | 22 35 59.0 | +33 57 11.9 | 4 | 0.0215 | 389 | 0.75 | 2,3 | G459/H92 |
| NGC 7358 | 22 46 44.2 | -65 04 10.5 | 3 | 0.0098 | 113 | 0.00 | 11 | G462/MDL5 |
| IC 1459 | 22 57 10.4 | -36 27 37.4 | 5 | 0.0057 | 80 | 0.80 | 10 | G466/HG15 |
| NGC 7448 | 23 01 04.9 | +15 52 07.9 | 6 | 0.0068 | 116 | 0.33 | 1 | G469/N160 |
| HCG 93 | 23 15 24.2 | +18 58 59.2 | 4 | 0.0168 | 209 | 0.50 | 2,3 | H93 |
| NGC 7582 | 23 18 15.3 | -42 31 08.2 | 8 | 0.0054 | 38 | 1.00 | 9 | G472/HG12 |
| NGC 7619 | 23 20 14.8 | +08 12 27.7 | 7 | 0.0116 | 253 | 0.14 | 1 | G473/GH166/N164 |
| HCG 96 | 23 27 58.3 | +08 46 26.6 | 4 | 0.0292 | 132 | 0.75 | 2,3 | H96 |
| HCG 97 | 23 47 23.2 | -02 18 07.4 | 14 | 0.0221 | 425 | 0.50 | 4,5 | H97 |
| NGC 7777 | 23 53 09.1 | +28 15 44.3 | 4 | 0.0229 | 116 | 0.25 | 1 | N170 |
Note. — 1 G=Garcia (1993), GH=Geller & Huchra (1983), H=Hickson (1982), HG=Huchra & Geller (1982), MDL=Maia, Da Costa & Latham (1989 ), N=Noltenius (1993)
Note. — references: 1) Nolthenius 1993, 2) Hickson et al. 1992, 3) Hickson, Kindl and Auman 1989, 4) Ribeiro et al. 1998 5) NASA Extragalactic Database (NED), 6) Geller and Huchra 1983, 7) Werner et al. 1999, 8) Zimer, Zabludoff and Mulchaey (2002), 9) Zabludoff and Mulchaey (1998), 10) Garcia 1993, 11) Maia, Da Costa and Latham 1989, 12) Zabludoff and Mulchaey (2000), 13) Willmer et al. 1999, 14) Willmer et al. 1991, 15) Mahdavi et al. 1999.
| Group | Exposure | Detection | NH | RX | T | Abundance | D | Log Lx |
|---|---|---|---|---|---|---|---|---|
| (sec) | (cm-2) | (arcmin/kpc) | (keV) | (solar) | (Mpc) | (erg/s) | ||
| NGC 7805 | 13,995 | UL | 5.6 | - | - | - | 46.4 | 40.31 |
| NGC 43 | 7,822 | UL | 5.5 | - | - | - | 45.2 | 40.85 |
| HCG 2 | 18,633 | UL | 4.3 | - | - | - | 40.0 | 40.85 |
| HCG 4 | 8,852 | UL | 1.6 | - | - | - | 71.7 | 41.11 |
| HCG 3 | 7,156 | UL | 3.6 | - | - | - | 78.6 | 41.54 |
| IC 1559 | 6,841 | UL | 3.4 | - | - | - | 44.5 | 40.90 |
| NGC 315 | 25,939 | DE/AGN | 5.9 | 5/66 | 0.80 | 0.06 | 46.6 | 41.57 |
| 0.81 | (0.3) | |||||||
| NGC 326 | 19,680 | DE | 5.8 | 19/734 | 1.41 | 0.32 | 144.8 | 42.97 |
| 1.41 | (0.3) | |||||||
| NGC 383 | 28,220 | DE | 5.4 | 30/442 | 1.51 | 0.12 | 49.5 | 42.72 |
| 3.37 | (0.3) | |||||||
| NGC 491 | 10,450 | UL | 2.3 | - | - | - | 35.7 | 40.70 |
| NGC 507 | 17,878 | DE | 5.2 | 33/455 | 1.25 | 0.22 | 48.7 | 42.95 |
| 1.30 | (0.3) | |||||||
| NGC 524 | 10,560 | DE | 4.5 | 9/57 | 0.47 | (0.3) | 21.9 | 40.53 |
| NGC 533 | 11,779 | DE | 3.1 | 18/263 | 1.03 | 0.59 | 51.8 | 42.37 |
| 1.00 | (0.3) | |||||||
| HCG 10 | 14,131 | UL | 4.9 | - | - | - | 46.0 | 40.67 |
| HCG 12 | 8,923 | DE | 3.6 | 5/197 | 0.67 | (0.3) | 147.5 | 41.88 |
| NGC 584 | 3,706 | UL | 3.8 | - | - | - | 16.9 | 40.51 |
| NGC 664 | 7,531 | UL | 3.4 | - | - | - | 52.3 | 40.98 |
| NGC 720 | 22,487 | DE | 1.5 | 9/39 | 0.51 | 0.09 | 15.1 | 40.86 |
| 0.53 | (0.3) | |||||||
| NGC 741 | 12,865 | DE | 4.5 | 16/240 | 1.06 | 0.22 | 53.4 | 42.14 |
| 1.08 | (0.3) | |||||||
| HCG 15 | 13,228 | DE? | 3.2 | 9/168 | 1.26 | (0.3) | 66.8 | 41.72 |
| HCG 16 | 14,000 | DE | 2.2 | 11/118 | 0.37 | (0.3) | 37.1 | 40.74 |
| UGC 1651 | 13,424 | DE | 6.1 | 11/328 | 1.43* | (0.3) | 109.3 | 42.15 |
| HCG 18 | 2,942 | UL | 8.6 | - | - | 39.1 | 41.04 | |
| NGC 1044 | 16,184 | DE | 8.8 | 8/141 | 0.87 | 0.06 | 62.8 | 41.69 |
| 0.99 | (0.3) | |||||||
| IC 1860 | 9,180 | DE | 2.1 | 18/345 | 1.14 | 0.17 | 68.8 | 42.75 |
| 1.26 | (0.3) | |||||||
| HCG 22 | 12,298 | DE? | 4.2 | - | - | - | 25.4 | 40.37 |
| IC 1880 | 4,122 | DE | 6.5 | 7/196 | 1.13 | (0.3) | 102.0 | 42.34 |
| HCG 23 | 4,122 | UL | 6.5 | - | - | - | 44.3 | 40.96 |
| HCG 26 | 5,011 | UL | 5.4 | - | - | - | 95.4 | 41.26 |
| NGC 1332 | 25,051 | UL | 2.2 | - | - | - | 14.2 | 40.04 |
| UGC 2755 | 16,826 | DE | 14.3 | 7/134 | 0.66 | (0.3) | 68.6 | 41.60 |
| NGC 1399 | 26,954 | DE | 1.3 | 40/115 | 1.38 | 0.28 | 9.9 | 41.94 |
| 1.39 | (0.3) | |||||||
| NGC 1407 | 18,222 | DE | 5.4 | 15/69 | 0.95 | 0.14 | 15.9 | 41.23 |
| 1.02 | (0.3) | |||||||
| NGC 1587 | 8,080 | DE | 6.5 | 6/62 | 0.90 | (0.3) | 36.2 | 40.92 |
| HCG 31 | 1,584 | UL | 6.0 | - | - | - | 39.5 | 40.97 |
| HCG 33 | 4,081 | DE? | 22.0 | - | - | - | 79.3 | 41.45 |
| NGC 1961 | 10,703 | UL | 8.3 | - | - | - | 41.8 | 40.84 |
| NGC 2300 | 17,232 | DE | 5.1 | 25/135 | 0.87 | 0.04 | 20.5 | 41.62 |
| 1.05 | (0.3) | |||||||
| NGC 2484 | 15,504 | DE/AGN | 5.1 | 7/249 | 0.86 | 0.04 | 130.1 | 42.41 |
| 1.04 | (0.3) | |||||||
| NGC 2563 | 21,155 | DE | 4.3 | 18/258 | 1.09 | 0.18 | 50.6 | 42.16 |
| 1.11 | (0.3) | |||||||
| HCG 35 | 15,262 | DE? | 2.8 | - | - | - | 171.1 | 41.84 |
| NGC 2769 | 8,773 | UL | 1.6 | - | - | - | 52.1 | 40.82 |
| HCG 37 | 4,884 | DE | 1.6 | 8/157 | 0.65 | (0.3) | 70.6 | 41.63 |
| NGC 2805 | 5,931 | UL | 3.9 | - | - | - | 17.6 | 40.46 |
| HCG 38 | 7,692 | UL | 3.5 | - | - | - | 92.8 | 41.40 |
| HCG 40 | 9,459 | UL | 3.5 | - | - | - | 70.9 | 41.05 |
| HCG 42 | 11,799 | DE | 4.8 | 9/108 | 0.73 | (0.3) | 42.3 | 41.59 |
| HCG 44 | 4,543 | UL | 2.1 | - | - | - | 17.0 | 40.70 |
| MKW 2 | 9,017 | DE | 4.4 | 9/286 | 1.31 | (0.3) | 116.3 | 42.32 |
| HCG 48 | 17,972 | DE? | 5.1 | 6/54 | 2.56 | (0.3) | 31.9 | 41.39 |
| CGCG154-041 | 20,581 | DE | 1.9 | 8/242 | 1.05 | (0.3) | 110.7 | 41.99 |
| NGC 3396 | 15,493 | UL | 2.0 | - | - | - | 18.8 | 40.491 |
| NGC 3557 | 19,219 | DE | 7.4 | 8/73 | 0.25 | (0.3) | 31.9 | 41.12 |
| NGC 3607 | 23,143 | DE | 1.6 | 10/42 | 0.40 | (0.3) | 14.5 | 40.53 |
| HCG 50 | 1,175 | UL | 0.8 | - | - | - | 461.9 | 42.55 |
| NGC 3647 | 13,691 | DE | 4.3 | 18/759 | 1.46 | 0.02 | 157.9 | 43.37 |
| 2.21 | (0.3) | |||||||
| NGC 3665 | 6,613 | DE | 2.1 | 6/40 | 0.33 | (0.3) | 23.4 | 40.63 |
| HCG 57 | 10,640 | DE? | 2.0 | 8/203 | 1.14 | (0.3) | 96.6 | 41.92 |
| HCG 58 | 11,321 | UL | 3.2 | - | - | - | 66.4 | 40.881 |
| NGC 3923 | 36,697 | DE | 6.2 | 8/40 | 0.52 | (0.3) | 17.3 | 40.29 |
| NGC 4065 | 15,422 | DE | 2.4 | 17/351 | 1.20 | (0.3) | 74.1 | 42.40 |
| NGC 4073 | 9,697 | DE | 1.9 | 22/404 | 1.75 | 1.14 | 64.9 | 43.04 |
| 1.44 | (0.3) | |||||||
| NGC 4104 | 13,891 | DE | 1.7 | 17/427 | 1.46 | 0.29 | 90.7 | 42.77 |
| 1.48 | (0.3) | |||||||
| NGC 4125 | 3,900 | DE | 1.9 | 6/28 | 0.44 | (0.3) | 16.1 | 40.54 |
| NGC 4168 | 13,824 | UL | 2.6 | - | - | - | 26.6 | 40.56 |
| NGC 4261 | 19,163 | DE | 1.5 | 27/187 | 0.91 | 0.03 | 24.0 | 41.89 |
| 1.29 | (0.3) | |||||||
| SHK 202 | 11,563 | DE | 1.9 | 15/340 | 0.77 | (0.3) | 81.6 | 42.01 |
| NGC 4278 | 3,228 | UL | 1.8 | - | - | - | 12.5 | 40.831 |
| NGC 4357 | 3,139 | UL | 1.3 | - | - | - | 45.0 | 41.37 |
| NGC 4325 | 4,984 | DE | 2.2 | 9/203 | 0.81 | 0.45 | 81.1 | 42.80 |
| 0.81 | (0.3) | |||||||
| NGC 4291 | 11,502 | DE | 2.8 | 14/84 | 0.49 | (0.3) | 20.9 | 40.74 |
| NGC 4615 | 4,845 | UL | 1.2 | - | - | - | 50.9 | 41.00 |
| NGC 4636 | 11,737 | DE | 1.8 | 22/105 | 0.74 | 0.41 | 16.6 | 41.88 |
| 0.73 | (0.3) | |||||||
| HCG 62 | 17,711 | DE | 3.0 | 29/389 | 0.96 | 0.09 | 47.4 | 42.69 |
| 1.08 | (0.3) | |||||||
| NGC 5044 | 26,097 | DE | 5.0 | 36/287 | 1.02 | 0.20 | 27.9 | 42.81 |
| 1.05 | (0.3) | |||||||
| NGC 5101 | 5,278 | UL | 5.7 | - | - | - | 21.7 | 40.77 |
| NGC 5129 | 5,568 | DE | 1.8 | 9/187 | 0.81 | (0.3) | 74.1 | 42.16 |
| NGC 5171 | 4,616 | DE | 1.9 | 14/288 | 1.25 | (0.3) | 73.8 | 42.35 |
| NGC 5218 | 5,653 | UL | 2.0 | - | - | - | 32.1 | 40.93 |
| IC 4296 | 3,774 | DE | 4.1 | 15/173 | 0.85 | (0.3) | 40.6 | 41.85 |
| HCG 67 | 15,093 | DE | 2.5 | 10/219 | 0.78 | (0.3) | 78.8 | 41.65 |
| NGC 5322 | 26,585 | DE | 1.8 | 5/29 | 0.33 | (0.3) | 20.6 | 40.10 |
| HCG 68 | 11,780 | DE | 1.0 | 10/75 | 0.59 | (0.3) | 26.0 | 40.99 |
| NGC 5374 | 5,556 | UL | 2.1 | - | - | - | 46.1 | 41.05 |
| NGC 5775 | 5,913 | UL | 3.5 | - | - | - | 17.4 | 40.62 |
| NGC 5846 | 6,979 | DE | 4.2 | 15/90 | 0.70 | 0.31 | 20.9 | 41.71 |
| 0.70 | (0.3) | |||||||
| NGC 5866 | 16,332 | UL | 1.5 | - | - | - | 7.2 | 39.481 |
| NGC 5929 | 10,347 | UL | 2.0 | - | - | - | 26.9 | 40.50 |
| NGC 5970 | 6,866 | UL | 3.5 | - | - | - | 20.6 | 41.37 |
| NGC 6052 | 4,728 | UL | 4.0 | - | - | - | 47.6 | 41.13 |
| NGC 6109 | 6,020 | DE | 1.4 | 25/662 | 2.22 | 0.13 | 96.2 | 43.21 |
| 2.43 | (0.3) | |||||||
| NGC 6251 | 13,699 | DE/AGN | 5.5 | 10/187 | 0.87 | (0.3) | 67.0 | 41.82 |
| HCG 84 | 35,363 | UL | 4.0 | - | - | - | 173.3 | 41.93 |
| ARP 330 | 6,794 | DE | 2.7 | 10/252 | 1.29 | (0.3) | 91.2 | 42.57 |
| NGC 6269 | 10,345 | DE | 4.7 | 23/703 | 1.83 | 0.27 | 108.7 | 43.20 |
| 1.92 | (0.3) | |||||||
| NGC 6329 | 17,995 | DE | 2.1 | 16/370 | 0.99 | 0.16 | 83.5 | 42.45 |
| 1.03 | (0.3) | |||||||
| NGC 6338 | 4,006 | DE | 2.6 | 15/359 | 1.82 | 0.19 | 86.6 | 43.25 |
| 2.02 | (0.3) | |||||||
| HCG 90 | 17,146 | DE | 1.6 | 10/66 | 0.51 | (0.3) | 22.9 | 40.60 |
| UGC 12064 | 9,068 | DE | 11.8 | 15/200 | 1.03 | (0.3) | 47.2 | 42.17 |
| HCG 92 | 18,695 | DE | 8.3 | 5/92 | 1.05 | (0.3) | 65.2 | 41.31 |
| NGC 7358 | 11,064 | UL | 2.5 | - | - | - | 28.4 | 40.59 |
| IC 1459 | 31,139 | DE | 1.2 | 12/50 | 0.63 | (0.3) | 14.4 | 40.52 |
| NGC 7448 | 6,762 | UL | 6.1 | - | - | - | 17.8 | 40.40 |
| HCG 93 | 15,022 | UL | 4.7 | - | - | - | 47.3 | 40.65 |
| NGC 7582 | 7,028 | UL | 1.9 | - | - | - | 13.7 | 40.741 |
| NGC 7619 | 17,943 | DE | 5.0 | 23/96 | 0.98 | 0.12 | 31.3 | 42.05 |
| 1.05 | (0.3) | |||||||
| HCG 96 | 2,480 | UL | 5.2 | - | - | - | 85.6 | 41.64 |
| HCG 97 | 12,092 | DE | 3.7 | 11/196 | 0.97 | 0.16 | 63.6 | 42.06 |
| 1.02 | (0.3) | |||||||
| NGC 7777 | 16,924 | DE | 5.0 | 7/130 | 0.63 | (0.3) | 66.3 | 41.28 |
Note. — 1 Extraction radius for the X-ray luminosity is less than 200 kpc: NGC 3396 (194 kpc), HCG 58 (83 kpc), NGC 4278 (148 kpc), NGC 5866 (76 kpc), NGC 7582 (120 kpc).
| Group | Extended Component | Central Component | |||
|---|---|---|---|---|---|
| Rcore | ellipticity | Rcore | |||
| (arcminute) | (arcminute) | ||||
| NGC 315 | 0.23 | 0.77 | 0.00 | - | - |
| NGC 326 | 2.00 | 0.36 | 0.05 | - | - |
| 2.22 | 0.35 | 0.09 | 0.11 | 0.50 | |
| NGC383 | 0.1 | 0.32 | 0.13 | - | - |
| 0.1 | 0.42 | 0.12 | 0.22 | (1.0) | |
| NGC 507 | 1.28 | 0.46 | 0.09 | - | - |
| 1.27 | 0.42 | 0.09 | 0.1 | (1.0) | |
| NGC 524 | 0.1 | 0.41 | 0.15 | - | - |
| NGC 533 | 0.1 | 0.46 | 0.10 | - | - |
| 0.42 | 0.95 | 0.21 | 0.1 | 0.36 | |
| HCG 12 | 0.1 | 0.34 | 0.53 | - | - |
| NGC 720 | 0.1 | 0.41 | 0.15 | - | - |
| 0.44 | 0.65 | 0.14 | 0.1 | 0.31 | |
| NGC 741 | 0.1 | 0.43 | 0.00 | - | - |
| 0.1 | 0.43 | 0.00 | 0.1 | (1.0) | |
| HCG 15 | 0.1 | 0.34 | 0.18 | - | - |
| HCG 16 | 0.1 | 0.35 | (0.00) | - | - |
| UGC 1651 | 0.1 | 0.33 | 0.21 | - | - |
| 0.1 | 0.38 | 0.19 | 0.14 | 0.77 | |
| NGC 1044 | 0.1 | 0.38 | 0.26 | - | - |
| IC 1860 | 0.22 | 0.46 | 0.00 | - | - |
| 0.32 | 0.47 | 0.00 | 0.30 | (1.0) | |
| IC 1880 | 0.1 | (1.00) | (0.00) | - | - |
| UGC 2755 | 0.1 | 0.36 | 0.11 | - | - |
| 0.1 | 0.48 | 0.22 | 0.1 | 0.31 | |
| NGC 1399 | 0.1 | 0.39 | 0.03 | - | - |
| 0.1 | 0.38 | 0.02 | 0.32 | (1.0) | |
| NGC 1407 | 0.20 | 0.34 | 0.23 | - | - |
| 0.60 | 0.37 | 0.22 | 0.1 | (1.0) | |
| NGC 1587 | 0.1 | 0.42 | (0.00) | - | - |
| NGC 2300 | 0.1 | (1.0) | 0.39 | - | - |
| NGC 2484 | 0.1 | 0.53 | 0.11 | - | - |
| NGC 2563 | 1.28 | 0.33 | 0.15 | - | - |
| 1.29 | 0.42 | 0.14 | 0.1 | (1.0) | |
| HCG 37 | 0.1 | 0.31 | (0.00) | - | - |
| HCG 42 | 0.13 | 0.35 | (0.00) | - | - |
| 1.75 | 0.41 | (0.00) | 0.84 | (1.00) | |
| MKW 2 | 0.1 | 0.34 | 0.00 | - | - |
| 0.1 | 0.33 | 0.17 | 0.1 | (1.0) | |
| HCG 48 | 0.85 | 0.56 | 0.00 | - | - |
| CGCG154-041 | 0.1 | 0.38 | 0.14 | - | - |
| 0.1 | 0.36 | 0.15 | 0.23 | (1.0) | |
| NGC 3557 | 0.1 | 0.44 | 0.00 | - | - |
| NGC 3607 | 0.1 | 0.43 | 0.20 | - | - |
| 0.1 | 0.42 | (0.00) | 0.1 | 0.50 | |
| NGC 3647 | 2.51 | 0.40 | 0.00 | - | - |
| 4.34 | 0.46 | 0.10 | 0.1 | (1.00) | |
| NGC 3665 | 0.1 | 0.42 | (0.00) | - | - |
| HCG 57 | 0.25 | 0.34 | (0.00) | - | - |
| NGC 3923 | 0.1 | 0.56 | 0.00 | - | - |
| 0.34 | 0.89 | (0.00) | 0.1 | 0.35 | |
| NGC 4065 | 3.75 | 0.42 | (0.00) | - | - |
| 2.52 | 0.46 | 0.45 | 0.1 | 0.31 | |
| NGC 4073 | 0.1 | 0.44 | 0.15 | - | - |
| 0.1 | 0.43 | 0.19 | 0.61 | (1.00) | |
| NGC 4104 | 0.95 | 0.38 | 0.00 | - | - |
| 0.95 | 0.42 | 0.00 | 0.1 | 0.36 | |
| NGC 4125 | 0.1 | 0.47 | (0.00) | - | - |
| NGC 4261 | 0.1 | (1.00) | (0.00) | - | - |
| NGC 4325 | 0.40 | 0.65 | 0.00 | - | - |
| 0.90 | 1.13 | (0.00) | 0.1 | 0.43 | |
| NGC 4636 | 0.16 | 0.43 | 0.00 | - | - |
| 0.77 | 0.76 | (0.00) | 0.1 | 0.33 | |
| HCG 62 | 0.1 | 1.76 | 0.00 | - | - |
| 0.1 | 0.35 | 0.18 | 1.34 | 2.17 | |
| NGC 5044 | 1.28 | 0.52 | 0.00 | - | - |
| 0.76 | 0.43 | 0.14 | 3.88 | 1.14 | |
| NGC 5129 | 0.1 | 0.39 | 0.00 | - | - |
| NGC 5171 | 0.28 | 0.32 | 0.29 | - | - |
| IC 4296 | 3.47 | 0.35 | (0.00) | - | - |
| HCG 67 | 0.1 | 0.36 | 0.00 | - | - |
| NGC 5322 | 0.1 | 0.38 | 0.41 | - | - |
| HCG 68 | 0.1 | 0.43 | 0.32 | - | - |
| NGC 5846 | 0.90 | 0.56 | 0.00 | - | - |
| 0.1 | 0.52 | 0.26 | 2.31 | (1.0) | |
| NGC 6109 | 2.48 | 0.43 | 0.00 | - | - |
| 2.03 | 0.41 | 0.43 | 1.33 | (1.00) | |
| NGC 6251 | 0.1 | 0.63 | 0.00 | - | - |
| 0.1 | 0.39 | 0.13 | 0.23 | (1.0) | |
| ARP 330 | 0.1 | 0.35 | 0.00 | - | - |
| NGC 6269 | 1.95 | 0.48 | 0.00 | - | - |
| 2.03 | 0.47 | 0.03 | 0.1 | (1.0) | |
| NGC 6329 | 1.02 | 0.45 | 0.00 | - | - |
| 1.04 | 0.44 | 0.00 | 0.1 | (1.0) | |
| NGC 6338 | 0.1 | 0.44 | 0.07 | - | - |
| 0.1 | 0.50 | 0.00 | 0.38 | (1.0) | |
| HCG 90 | 0.84 | 0.95 | 0.22 | - | - |
| UGC 12064 | 0.1 | 0.38 | 0.04 | - | - |
| 0.1 | 0.43 | 0.00 | 0.1 | (1.0) | |
| HCG 92 | 0.1 | 0.43 | 0.35 | - | - |
| IC 1459 | 0.17 | 0.66 | 0.00 | - | - |
| 0.15 | 0.42 | 0.17 | 0.32 | (1.0) | |
| NGC 7619 | 0.51 | 0.44 | 0.00 | - | - |
| 0.57 | 0.54 | 0.19 | 0.1 | (1.00) | |
| HCG 97 | 0.1 | 0.41 | 0.00 | - | - |
| 0.1 | 0.48 | 0.48 | 0.41 | 0.77 | |
| NGC 7777 | 0.1 | 0.33 | (0.00) | - | - |