H Rotation Curves of Galaxies:
Unraveling
the Evolution of the Tully-Fisher Relation11affiliation: Based on observations collected at the European Southern
Observatory, Cerro Paranal, Chile
Abstract
We describe the first results of a programme to obtain rotation curves of disc galaxies in the near-infrared using the H emission line in order to study the Tully-Fisher relationship. To put any observed evolution into perspective and to investigate any possible selection biases, we constructed a control sample of low redshift galaxies that had rotation velocities and images available for measuring their dynamical, photometric, and morphological properties. Compared to local objects with isophotal sizes similar to the high redshift targets, we find that our sample of galaxies with spatially resolved rotation curves, the most distant sample so far (), clearly reveals a brightening of mag in the rest-frame B-band. The observed offset can be explained by a combination of increasing surface brightness, decreasing rotation speeds, and slightly smaller disc scale lengths of the high redshift galaxies.
1 Introduction
Like the fundamental plane for early type galaxies (Dressler et al., 1987) the Tully-Fisher relation for disc galaxies (Tully and Fisher, 1977) embodies fundamental implications for the relationship between the mass of the galaxy, its star-formation history, specific angular momentum and dark matter content and distribution.
Broadly speaking, there are two competing models to explain the Tully-Fisher relation. The first of these is that it is a consequence of self-regulated star formation in discs with different masses (e.g., Silk, 1997), i.e., the competition of disc instability (which promotes star formation) with supernovae induced porosity (which inhibits star-formation). The model is not the complete answer, however, since it does not explain the mass-to-light ratios or the scale-lengths of the discs. In the second model the Tully-Fisher relation is a direct consequence of the cosmological equivalence between mass and circular velocity (e.g., Mo et al., 1998; Steinmetz and Navarro, 1999). This formalism is part of what has become the standard model for the growth of structure - the hierarchical merging model in which the gravitational effects of dark matter drive the evolution of galaxies and large-scale structure (e.g., Kauffmann et al., 1993). Models of this type have the advantage of providing testable predictions about the sizes, surface densities, and rotation curves of galaxies as a function of redshift. However, as emphasized by Steinmetz and Navarro (1999), although the Tully-Fisher relation can naturally be explained by hierarchical merging models, the normalization and evolution of the Tully-Fisher relation depend strongly on the prescription used for the star formation and on the cosmological parameters.
It is now well established that massive disc galaxies exist out to redshifts (Vogt et al., 1996, 1997; Schade et al., 1996; Lilly et al., 1998). For a given size scale, the number density of these disc galaxies is approximately the same at as is observed locally. Overall, the results at moderate redshift () are rather mixed. Depending on the sample selection, the technique used to estimate the rotation speed, the median redshift of the sample, and the wavelength at which comparisons are made, there are claims in the literature that the Tully-Fisher relation either brightens or dims with redshift (see e.g., Vogt et al., 1996, 1997; Simard and Pritchet, 1998; Rix et al., 1997; Ziegler et al., 2002). To help resolve this controversy and to push to higher redshift where evidence for evolution of disc galaxies will likely be stronger and more obvious, we set out to obtain spatially resolved rotation curves at the highest redshifts where large samples are available. Obtaining spatially resolved rotation curves becomes quite difficult at such high redshifts since [OII]3727 is redshifted into a region with many strong night sky lines and the sensitivity of CCDs declines rapidly. Instead we have chosen to observe the H line, reshifted to the infrared J-band. H is typically 2.5 times stronger than [OII] (Kennicutt, 1992) and being at longer wavelength, is less affected by dust extinction.
2 Sample Selection
To gauge the evolution of the Tully-Fisher relation we compare a local with a high redshift sample of highly inclined, “normal” spiral galaxies. The high redshift sample consists of objects with measured spectroscopic redshifts. To be able to measure H in the near-infrared we required . Targets were selected from the CFRS / LDSS redshift surveys, the clusters MS1054, AC103 and the Hawaii deep field SSA22 (Lilly et al., 1995; Glazebrook et al., 1995; van Dokkum, 1999; Couch et al., 1998; Cowie et al., 1996, respectively, and references therein). Furthermore, we included two targets from the VLT science archive. For the majority of these sources we have HST I-band111Based on observations made with the NASA/ESA Hubble Space Telescope, obtained from the data archive at the Space Telescope Institute. STScI is operated by the association of Universities for Research in Astronomy, Inc. under the NASA contract NAS 5-26555. or at least VLT J-band images. For all of them we have obtained H ISAAC long-slit spectra to determine spatially resolved rotation curves. For this purpose we have selected these sources to be spatially extended on the images (diameters mainly 2”) and to have high inclination angles (, ). Furthermore, we chose only objects with exponential light profiles to ensure that we were observing disc galaxies. The mean redshift of our high-z sample is (see Tab. 1).
To construct a complementary sample of local galaxies we searched the literature for objects with accessible CCD B-band images (obtained from the NASA Extragalactic Database, NED, or ESO science archive), published distances based on primary distance indicators or mean group velocities (Freedman et al., 2001; Pierce and Tully, 1992; Puche and Carignan, 1988; Tully and Pierce, 2000; Ferrarese et al., 2000; Giuricin et al., 2000; Drozdovsky and Karachentsev, 2000; Karachentsev and Sharina, 1997; Karachentsev et al., 2000; Distefano et al., 1990; Abell et al., 1989; Duval and Monnet, 1985, LEDA database222The Lyon Meudon extragalactic database (http://leda.univ-lyon1.fr)) and an estimate for the rotation speed based on either an HI or a resolved H rotation curve (Prugniel et al., 1998, and references therein). Total magnitudes for all local sample galaxies where obtained from RC3 (de Vaucouleurs et al., 1991) or LEDA. As a consistency check, the object magnitudes, sizes, rotation speeds and the resulting Tully-Fisher relation were compared to the RC3 catalogue and the data from Tully and Pierce (2000). From this comparison, we conclude that our sample of low redshift galaxies is in good agreement with a random subsample of a magnitude limited complete sample from the RC3.
3 Observations
We obtained J- and H-band spectroscopy during four observing runs with the facility near-infrared spectrometer ISAAC at the VLT (Moorwood, 1997; Moorwood et al., 1998). We used the medium resolution spectroscopic mode with a slit-width resolution product of and a spatial pixel scale of 0.1484”.
In ESO-period 65 and 66 (April - September 2000 and October 2000 - March 2001 respectively) we obtained the first set of data in service mode. With total integration times of 3 hours and a 0.6”-slit (), which we rotated according to the position angle of the objects, we could successfully observe four targets. The target selection and successive estimation of position angles for this set we performed on 1” resolution images acquired in the J-band with ISAAC (20min integration time) before the spectroscopic observations. In addition to these J-band images, we obtained I-band images taken with the Canada France Hawaii Telescope (CFHT) from that telescope’s archive.
Furthermore, we conducted three other runs in visitor mode in February and September 2001 and September 2002. This time the set-up included a 1”-slit () and integration times varied, depending on the H flux of the targets, between 1 and 3 hours. Moreover, we selected targets on the basis of HST/WFPC2 F814W images, which we also used to orient the slit along the galaxy major axis. Since most of the targets were too faint to be acquired directly we used a blind off-set from a“bright” star, calculated from the HST images. Using this prescription we observed another 17 objects successfully. The seeing during these four runs ranged from 0.4” to 0.8”.
4 Data Reduction and Analysis
To reduce the ISAAC spectra we used standard data reduction packages (ESO eclipse & IRAF). The data were flat fielded and dark-subtracted. After dark-subtraction and cosmic ray rejection we checked all frames individually for shifts in the wavelength direction due to flexure and applied a reverse shift if necessary. Before combining the frames we calculated a wavelength solution and distortion correction. Finally, we subtracted a background and smoothed the spectra with a Gaussian of FWHM approximately equal to the number of pixels per resolution element.
Firstly, we extracted one dimensional H-profiles across the spectral and spatial regions of the array that contained H-flux. Typically, even with the increased signal-to-noise gained in the continuum by summing up the flux in this way, we could not detect the continuum significantly. We then fitted the one dimensional H-profiles (typically assuming no galaxy continuum) by one or two (in the case of a double horned profile) Gaussians. At the level where of the total integrated flux was reached we measured the width of the profile. Applying the corrections given by Tully and Fouque (1985) we obtained a first estimate for the terminal rotation velocity of our sample galaxies.
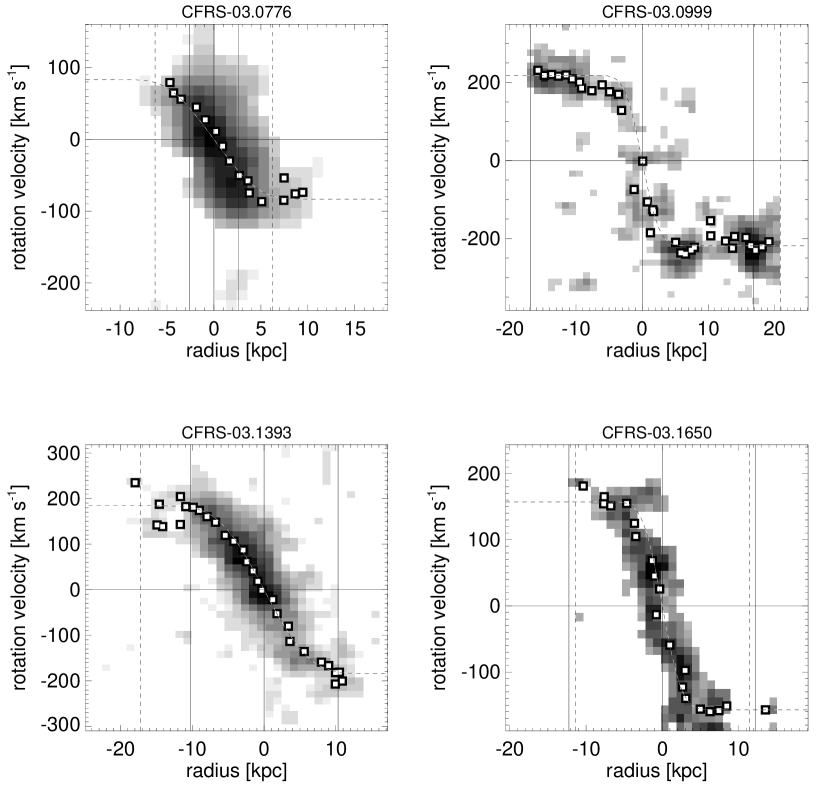
In all cases but one, however, we could derive a terminal rotation velocity from a resolved rotation curve model. To extract the data points for the model rotation curve we developed a special adaptive curve tracing algorithm. We then fitted the resulting position-velocity diagram with a simple model of a flat rotation curve (which is appropriate for not too-late disc galaxies). This step-function we convolved with a Gaussian with a full-width at half maximum of the seeing. Moreover, the convolution included weighting with an exponential function with a scale-length as measured from our disc surface brightness fits on the HST or VLT images assuming that line and continuum have the same light distribution. Tests show that our modeling delivers robust rotation velocities, which are not very sensitive to the exact weighting scheme, the impact of nuclear bulges, the signal-to-noise ratio and in particular, how well the observationally “flat part” of the rotation curve is sampled by the data. We have measured the seeing from the J-band acquisition images taken before the observations, the acquisition images of a subsequent target, and the values from the visible seeing monitor. Given our long integration times and the limited sampling of the seeing at the observing wavelength, the seeing is somewhat uncertain. We have therefore let it be a free parameter in the fitting process. The values obtained from an unconstrained fit correlate well with the seeing values estimated from the acquisition images and seeing monitor, though. Some of the final fits to the data are shown in Fig. 1. Although only of the data show a clear turn-over or extend out to 2.2 disc scale lengths (which is were the rotation curve of a self-gravitating thin disc reaches its maximum, see Binney and Tremaine, 1987) the remaining data do not exclusively consist of slow rotators only. In fact, the distributions of rotation speeds of high and low quality data can not be distinguished from each other (see Barden et al. 2003). Furthermore, the rotation speeds derived from the two dimensional data are not significantly smaller than the ones from the one dimensional spectra, which have much higher signal-to-noise (see Barden et al. 2003). Moreover, according to the parametric fits to over 2000 local disc galaxies of Giovanelli and Haynes (2002) at radii varying from one should already measure at least of the asymptotic rotation velocity. Since the majority of our high galaxies extend further out we estimate rotation velocities within . Therefore, we are confident that we do not underestimate the rotation velocities significantly. Finally, the rotation velocities have to be corrected for the inclination of the galaxies. We have derived inclinations from surface brightness profile fits to our HST or ISAAC images.
To estimate rest-frame B-band magnitudes we compiled all available photometric information for our sources (two to five independent measurements). For each magnitude we calculated the corresponding rest-frame wavelength and corrected the magnitudes for galactic foreground extinction (Schlegel et al., 1998). Then we fitted the extinction corrected magnitudes and corresponding rest-wavelengths with spectra from the atlas of Kinney et al. (1996). We note that our final rest-frame B-band magnitudes are relatively insensitive to the models used since all of the galaxies had a photometric band available that was very near to the B-band rest wavelength. Finally, we corrected the resulting rest-frame B-band magnitudes for inclination dependent internal extinction according to the method of Tully and Fouque (1985) and determined a face-on B-magnitude (Table 1).
The parameters for the local comparison sample were determined and corrected in exactly the same manner as for the high redshift galaxies. Rotation speeds were extracted from HI or optical rotation curves. Only one object was included where a spatially-resolved rotation curve was not available. Comparison of the resolved data with the HI line width from RC3 usually agree within km s-1 (see Barden et al. 2003). We calculated inclination corrections based on inclinations from our own profile fits in agreement with the values from RC3 or LEDA. Total magnitudes were obtained directly from RC3 or LEDA and were corrected for galactic foreground extinction and internal extinction. Since differences in the isophotal extent between the images of the local and high redshift galaxies can be quite dramatic (up to two magnitudes), the light profiles of the local galaxy sample were fit only out to a characteristic limiting radius, which was approximately the average isophotal depth of the images of the high redshift galaxies (taking into account cosmic surface brightness dimming; see Barden et al. 2003).
5 The Tully-Fisher Relation at
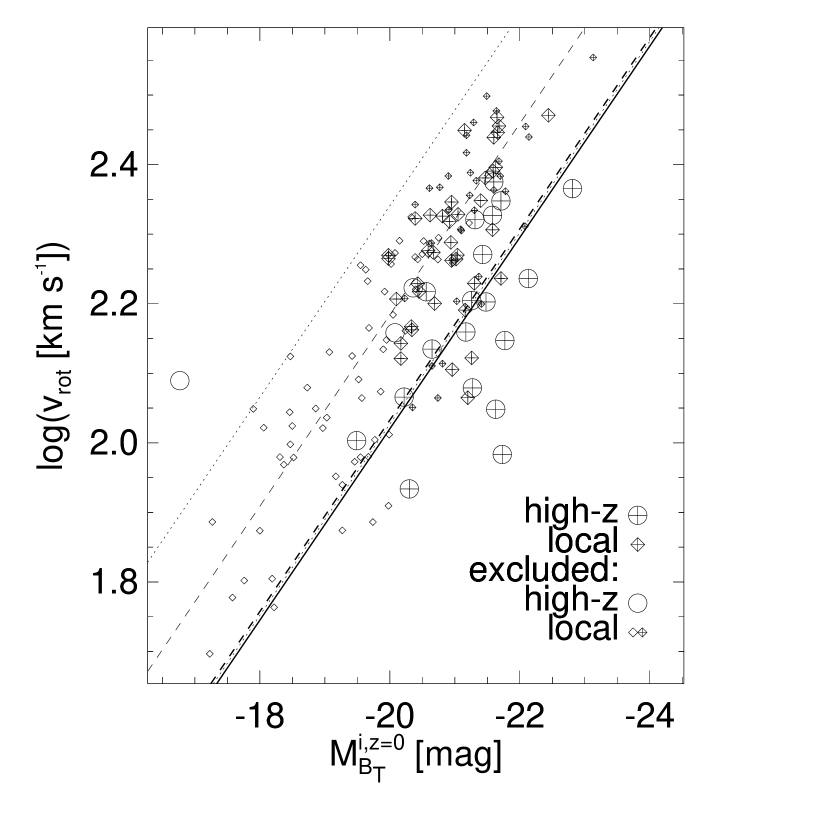
Comparing the isophotal-size-culled local (our comparison sample) and high redshift galaxy samples (see Barden et al. 2003) we find an offset for the high-z data from the Tully-Fisher relation of magnitudes in a -dominated universe (, , ; Fig. 2). This “brightening” of the distant galaxies is significant and holds for any reasonable cosmology ( for and ; for and ). The limited range in isophotal size makes measuring a slope of the Tully-Fisher relation impossible.
6 Discussion and Conclusions
The observed offset in the Tully-Fisher relation at for large galaxies is partially a consequence of the fact that we observe an increase of central surface brightness of 1.7 mag arcsec-2 and a slight decrease of in the disc scale lengths of the high redshift sample compared to the local control sample (see Barden et al. 2003). Using the relationship between disc magnitude, central surface brightness, and disc scale length, namely, , we find that the differences in average central surface brightness and average disc scale lengths imply an offset in the zero-point of the T-F relation between the two samples of about magnitudes. In addition, by comparing the rotation speeds of the high redshift galaxies and the local comparison sample, we find an average offset of km s-1 of the high redshift sample (see Barden et al. 2003). Thus, between and 0 the mean mass of galaxies has increased by a factor of (assuming mass , and estimating the total mass out to 2.2 disc scale lengths measured from fitting the light profile). Therefore, if we use a parameterization of the Tully-Fisher relation as given by Tully and Pierce (2000), adjusting the zero-points by -0.3 mag to account for the average differences in surface brightness and disc scale length and decreasing the average rotation speed by yields an offset from the local Tully-Fisher relation consistent with that observed ( mag).
Having the highest redshift sample puts us in a unique position to discuss the evolution of the Tully-Fisher relation from a new perspective. All of the studies to date have found a significantly smaller amount of evolution compared to the results presented here. The most obvious way to reconcile this difference is that the offset in the Tully-Fisher relation grows with increasing redshift. The studies with the highest median redshift currently are Ziegler et al. (2002) and Vogt et al. (1996) with a mean redshift of , compared with our mean redshift of . The time difference is therefore about 2-3 Gyrs for any reasonable cosmology, clearly sufficient for galaxies to undergo significant evolution.
Unfortunately, comparing these results with model predictions is not very straight-forward since the exact offset predicted depends on the assumed physics and phenomenology, such as the details of star-formation (e.g., Steinmetz and Navarro, 1999; Mo et al., 1998). Recently, within the frame work of galaxy evolution (e.g., White and Rees, 1978), a number of authors have made predictions about the general evolution of the galaxy population. For example, Nagamine et al. (2001) predict that from to 1, using the cosmological parameters we have assumed here, that the overall luminosity function of galaxies in the B-band will brighten by about 1.15 mag and that the characteristic mass of galaxies will decline by about a factor of 2.4. Assuming that the galaxies selected for study here are a subset of this population, our numbers are in reasonable agreement with the predicted values. Unfortunately, the resolution of the simulations by Nagamine et al. (2001) are too low to check whether the sizes of discs evolve self-consistently in this context.
We conclude that large disc galaxies have undergone substantial evolution from to the present. The offset in the Tully-Fisher relation is about mag in the rest-frame B-band, and is related to an overall increase in the central surface brightnesses of disc galaxies and a decrease in rotation speed. We also find that the slope of the Tully-Fisher relation, due to size constraints that inevitably result from needing to obtain spatially-resolved rotation curves, cannot meaningfully be estimated. In a subsequent paper (Barden et al. 2003), we will discuss in detail the change in rotation speeds, disc masses, disc scale lengths, and disc angular momenta of this sample of high redshift galaxies relative to the local comparison sample, and make quantitative comparisons with theoretical models of galaxy evolution.
References
- Abell et al. (1989) Abell, G. O., Corwin, H. G., and Olowin, R. P.: 1989, ApJS 70, 1
- Binney and Tremaine (1987) Binney, J. and Tremaine, S.: 1987, Galactic dynamics, Princeton, NJ, Princeton University Press, 1987, 747 p.
- Couch et al. (1998) Couch, W. J., Barger, A. J., Smail, I., Ellis, R. S., and Sharples, R. M.: 1998, ApJ 497, 188+
- Cowie et al. (1996) Cowie, L. L., Songaila, A., Hu, E. M., and Cohen, J. G.: 1996, AJ 112, 839+
- de Vaucouleurs et al. (1991) de Vaucouleurs, G., de Vaucouleurs, A., Corwin, J. R., Buta, R. J., Paturel, G., and Fouque, P.: 1991, in Third reference catalogue of Bright galaxies, 1991, New York : Springer-Verlag., pp 0+
- Distefano et al. (1990) Distefano, A., Rampazzo, R., Chincarini, G., and de Souza, R.: 1990, A&AS 86, 7
- Dressler et al. (1987) Dressler, A., Lynden-Bell, D., Burstein, D., Davies, R. L., Faber, S. M., Terlevich, R., and Wegner, G.: 1987, ApJ 313, 42
- Drozdovsky and Karachentsev (2000) Drozdovsky, I. O. and Karachentsev, I. D.: 2000, A&AS 142, 425
- Duval and Monnet (1985) Duval, M. F. and Monnet, G.: 1985, A&AS 61, 141
- Ferrarese et al. (2000) Ferrarese, L., Ford, H. C., Huchra, J., Kennicutt, R. C., Mould, J. R., Sakai, S., Freedman, W. L., Stetson, P. B., Madore, B. F., Gibson, B. K., Graham, J. A., Hughes, S. M., Illingworth, G. D., Kelson, D. D., Macri, L., Sebo, K., and Silbermann, N. A.: 2000, ApJS 128, 431
- Freedman et al. (2001) Freedman, W. L., Madore, B. F., Gibson, B. K., Ferrarese, L., Kelson, D. D., Sakai, S., Mould, J. R., Kennicutt, R. C., Ford, H. C., Graham, J. A., Huchra, J. P., Hughes, S. M. G., Illingworth, G. D., Macri, L. M., and Stetson, P. B.: 2001, ApJ 553, 47
- Giovanelli and Haynes (2002) Giovanelli, R. and Haynes, M. P.: 2002, ApJ 571, L107
- Giuricin et al. (2000) Giuricin, G., Marinoni, C., Ceriani, L., and Pisani, A.: 2000, ApJ 543, 178
- Glazebrook et al. (1995) Glazebrook, K., Ellis, R., Colless, M., Broadhurst, T., Allington-Smith, J., and Tanvir, N.: 1995, MNRAS 273, 157
- Karachentsev and Sharina (1997) Karachentsev, I. D. and Sharina, M. E.: 1997, A&A 324, 457
- Karachentsev et al. (2000) Karachentsev, I. D., Sharina, M. E., and Huchtmeier, W. K.: 2000, A&A 362, 544
- Kauffmann et al. (1993) Kauffmann, G., White, S. D. M., and Guiderdoni, B.: 1993, MNRAS 264, 201+
- Kennicutt (1992) Kennicutt, R. C.: 1992, ApJ 388, 310
- Kinney et al. (1996) Kinney, A. L., Calzetti, D., Bohlin, R. C., McQuade, K., Storchi-Bergmann, T., and Schmitt, H. R.: 1996, ApJ 467, 38+
- Lilly et al. (1998) Lilly, S., Schade, D., Ellis, R., Le Fevre, O., Brinchmann, J., Tresse, L., Abraham, R., Hammer, F., Crampton, D., Colless, M., Glazebrook, K., Mallen-Ornelas, G., and Broadhurst, T.: 1998, ApJ 500, 75+
- Lilly et al. (1995) Lilly, S. J., Le Fevre, O., Crampton, D., Hammer, F., and Tresse, L.: 1995, ApJ 455, 50+
- Mo et al. (1998) Mo, H. J., Mao, S., and White, S. D. M.: 1998, MNRAS 295, 319
- Moorwood et al. (1998) Moorwood, A., Cuby, J.-G., Biereichel, P., Brynnel, J., Delabre, B., Devillard, N., van Dijsseldonk, A., Finger, G., Gemperlein, H., Gilmozzi, R., Herlin, T., Huster, G., Knudstrup, J., Lidman, C., Lizon, J.-L., Mehrgan, H., Meyer, M., Nicolini, G., Petr, M., Spyromilio, J., and Stegmeier, J.: 1998, The Messenger 94, 7
- Moorwood (1997) Moorwood, A. F.: 1997, in Proc. SPIE Vol. 2871, p. 1146-1151, Optical Telescopes of Today and Tomorrow, Arne L. Ardeberg; Ed., Vol. 2871, pp 1146–1151
- Nagamine et al. (2001) Nagamine, K., Fukugita, M., Cen, R., and Ostriker, J. P.: 2001, MNRAS 327, L10
- Pierce and Tully (1992) Pierce, M. J. and Tully, R. B.: 1992, ApJ 387, 47
- Prugniel et al. (1998) Prugniel, P., Zasov, A., Busarello, G., and Simien, F.: 1998, A&AS 127, 117
- Puche and Carignan (1988) Puche, D. and Carignan, C.: 1988, AJ 95, 1025
- Rix et al. (1997) Rix, H., Guhathakurta, P., Colless, M., and Ing, K.: 1997, MNRAS 285, 779
- Schade et al. (1996) Schade, D., Carlberg, R. G., Yee, H. K. C., Lopez-Cruz, O., and Ellingson, E.: 1996, ApJ 465, L103
- Schlegel et al. (1998) Schlegel, D. J., Finkbeiner, D. P., and Davis, M.: 1998, ApJ 500, 525+
- Silk (1997) Silk, J.: 1997, ApJ 481, 703+
- Simard and Pritchet (1998) Simard, L. and Pritchet, C. J.: 1998, ApJ 505, 96
- Steinmetz and Navarro (1999) Steinmetz, M. and Navarro, J. F.: 1999, ApJ 513, 555
- Tully and Fisher (1977) Tully, R. B. and Fisher, J. R.: 1977, A&A 54, 661
- Tully and Fouque (1985) Tully, R. B. and Fouque, P.: 1985, ApJS 58, 67
- Tully and Pierce (2000) Tully, R. B. and Pierce, M. J.: 2000, ApJ 533, 744
- van Dokkum (1999) van Dokkum, P. G.: 1999, Ph.D. thesis, Rijksuniversiteit Groningen, Kapteyn Institute for Astronomy
- Vogt et al. (1996) Vogt, N. P., Forbes, D. A., Phillips, A. C., Gronwall, C., Faber, S. M., Illingworth, G. D., and Koo, D. C.: 1996, ApJ 465, L15
- Vogt et al. (1997) Vogt, N. P., Phillips, A. C., Faber, S. M., Gallego, J., Gronwall, C., Guzman, R., Illingworth, G. D., Koo, D. C., and Lowenthal, J. D.: 1997, ApJ 479, L121
- White and Rees (1978) White, S. D. M. and Rees, M. J.: 1978, MNRAS 183, 341
- Ziegler et al. (2002) Ziegler, B. L., Böhm, A., Fricke, K. J., Jäger, K., Nicklas, H., Bender, R., Drory, N., Gabasch, A., Saglia, R. P., Seitz, S., Heidt, J., Mehlert, D., Möllenhoff, C., Noll, S., and Sutorius, E.: 2002, ApJ 564, L69
| ID | z | r25 | i | mB | M | vrot | |||
|---|---|---|---|---|---|---|---|---|---|
| [kpc] | [deg] | [mag] | [mag] | [mag] | [mag] | [km s-1] | |||
| (1) | (2) | (3) | (4) | (5) | (6) | (7) | (8) | (9) | (10) |
| CFRS-00.0174 | 0.7838 | 12.9 | 3.58 | 79 | 0.11 | 0.14 | 23.22 | -20.220.15 | 11640 |
| CFRS-00.0308 | 0.9704 | 17.8 | 1.33 | 43 | 0.06 | 0.13 | 23.72 | -20.300.20 | 8620 |
| MS1054-1403 | 0.8133 | 40.7 | 3.21 | 76 | 0.54 | 0.15 | 20.74 | -22.810.10 | 23250 |
| MS1054-1733 | 0.8347 | 14.9 | 1.88 | 60 | 0.22 | 0.15 | 22.97 | -20.650.10 | 13620 |
| LDSS2-03.219 | 0.6024 | 13.9 | 1.73 | 57 | 0.18 | 0.34 | 23.25 | -19.490.20 | 10150 |
| CFRS-03.0999 | 0.7049 | 30.3 | 3.53 | 78 | 0.62 | 0.42 | 21.45 | -21.710.30 | 22310 |
| CFRS-03.1393 | 0.8554 | 22.6 | 4.23 | 83 | 0.69 | 0.42 | 22.26 | -21.430.10 | 18710 |
| CFRS-03.1650 | 0.6341 | 19.6 | 2.78 | 72 | 0.43 | 0.42 | 22.33 | -20.560.20 | 16540 |
| CFRS-22.0953 | 0.9787 | 23.9 | 2.41 | 68 | 0.34 | 0.28 | 22.87 | -21.170.10 | 14430 |
| CFRS-22.1313 | 0.8173 | 23.9 | 2.92 | 74 | 0.47 | 0.28 | 22.29 | -21.270.10 | 12010 |
| CN84-023 | 0.6389 | 25.4 | 1.47 | 49 | 0.12 | 0.17 | 20.78 | -22.130.35 | 17250 |
| CN84-123 | 0.6776 | 20.3 | 1.98 | 62 | 0.24 | 0.17 | 21.48 | -21.580.10 | 21240 |
| CSH96-68 | 1.5625 | 17.5 | 1.87 | 60 | 0.22 | 0.29 | 23.56 | -21.730.35 | 9650 |
| HDFS-0620aagalaxy observed by White et al. (ESO proposal ID: 63.O-0372(A)) | 1.2850 | 3.6 | 1.49 | 49 | 0.12 | 0.12 | 28.00 | -16.770.90 | 12320 |
| SA68-5155aagalaxy observed by White et al. (ESO proposal ID: 63.O-0372(A)) | 1.0521 | 25.1 | 2.35 | 68 | 0.33 | 0.22 | 22.98 | -21.260.10 | 16050 |
| CFRS-00.0137 | 0.9512 | 18.1 | 1.39 | 45 | 0.06 | 0.14 | 22.37 | -21.600.10 | 23740 |
| CSH96-32 | 1.0215 | 13.1 | 1.49 | 49 | 0.12 | 0.30 | 22.85 | -21.310.10 | 20920 |
| CSH96-74 | 1.3633 | 25.8 | 3.78 | 80 | 0.68 | 0.29 | 23.30 | -21.630.10 | 11230 |
| CFRS-03.0776 | 0.8835 | 7.6 | 1.22 | 36 | 0.06 | 0.42 | 23.69 | -20.080.10 | 14410 |
| CFRS-03.1056 | 0.9392 | 13.8 | 1.50 | 50 | 0.13 | 0.42 | 22.16 | -21.770.10 | 14010 |
| CFRS-03.1284 | 0.9393 | 8.1 | 1.18 | 33 | 0.04 | 0.42 | 23.58 | -20.360.10 | 16720 |
| CFRS-22.0599 | 0.8856 | 13.9 | 1.76 | 57 | 0.19 | 0.29 | 22.29 | -21.480.10 | 15930 |
Note. — (1) galaxy identification (Lilly et al., 1995; Glazebrook et al., 1995; van Dokkum, 1999; Couch et al., 1998; Cowie et al., 1996) (2) redshift, (3) isophotal radius at a surface brightness of 25 mag arcsec-2, (4) ratio of major over minor half axis, (5) inclination, (6) internal extinction (Tully and Fouque, 1985), (7) galactic extinction (Schlegel et al., 1998), (8) total rest-frame B-band magnitude, (9) total absolute rest-frame magnitude plus error (assuming , , ), (10) rotation speed corrected for inclination plus error