Discrete X-ray Signatures of a Photoionized Plasma Above the Accretion Disk of the Neutron Star EXO 0748-676
Abstract
During the disk-mediated accretion phase, the high-resolution X-ray spectrum of the low-mass X-ray binary system EXO 0748-676 reveals a photoionized plasma which is orbiting the neutron star. Our observations with the Chandra High Energy Transmission Grating Spectrometer (HETGS) constrain the structure of the upper layers of the accretion disk, by means of the recombination emission lines from the H-like and He-like ions of O, Ne, and Mg, which have a mean velocity broadening . The Mg XI emission region has density and is located within cm of the neutron star, while the temperature of the Ne X region is eV. These lines favor a vertically stratified distribution of ions in the disk. The spectra show that the line region is spatially extended and unabsorbed, while the continuum region is compact and heavily absorbed. The absorber has variable column density and is composed of both neutral and ionized gas, which can explain the stochastic and periodic X-ray intensity dips, the X-ray continuum evolution, and the O VII and Mg XI K-shell absorption edges. The absorber is located 8∘–15∘ above the disk midplane, inclusive of two bulges near the disk edge. This outer disk gas may participate in the outflow of ionized plasma which was previously identified in XMM-Newton grating spectra obtained during type I bursts. The thickened photoionized region above the disk can be produced by heating from the neutron star X-rays and by the impact of the accretion stream.
1 Introduction
EXO 0748-676 provides a unique view of a photoionized plasma in the region near an accretion disk. EXO 0748-676 is a Low-Mass X-ray Binary (LMXB) which exhibits eclipses, type I X-ray bursts, and intensity dips Parmar et al. (1985); Parmar, White, Giommi, & Gottwald (1986). The X-ray eclipses have a period hr and last for 8.3 min. Assuming Roche lobe overflow and a primary accretor with , Parmar et al. obtained a companion mass of . They found that the largest corresponds to a main-sequence companion, with a system inclination of 75∘∘. As we will see below, this inclination is favorable for X-ray spectroscopic studies of the accretion flow. The type I bursts are due to a thermonuclear flash on the surface of an accreting neutron star, which requires a magnetic field G (Lewin, van Paradijs, & Taam, 1995, and references therein). The X-ray burst luminosity is near the Eddington limit, for a distance to EXO 0748-676 of kpc, so we will assume this value of . The low implies that the accretion disk can extend all the way in, down to the neutron star surface. The persistent X-ray luminosity is , and most of this power is released in the innermost radii of the accretion disk and in the boundary layer of the neutron star.
Intensity dips are often present in LMXB observed at high-inclination Frank, King, & Lasota (1987). Frank et al. attributed the X-ray intensity dips to absorption from photoionized clouds in a two-phase medium above the outer accretion disk. In EXO 0748-676, dips are associated with X-ray spectral evolution. The dips are observed to precede eclipses at orbital phase , or to occur during mid-orbit at . The depth and duty cycle of the dips varies with each orbit. During the dips, the spectrum hardens, as would be expected if they are caused by increased photoelectric absorption Parmar, White, Giommi, & Gottwald (1986). A soft X-ray excess was observed at Å with ASCA and ROSAT Thomas et al. (1997); Schulz (1999). This excess was presumed to be associated with the existence of two emission components, or with the “partial covering” of the X-ray source by a rapidly variable low-metallicity absorber Parmar, White, Giommi, & Gottwald (1986); Church, Balucinska-Church, Dotani, & Asai (1998).
High-resolution 10–23 Å spectra of EXO 0748-676 showed broad X-ray line emission and drastic spectral variability. Cottam et al. (2001, hereafter C01) found recombination lines from N VII, O VII, O VIII, Ne IX, and Ne X, using the XMM-Newton Reflection Grating Spectrometer (RGS). The K edges of O VII and O VIII were visible during the rapid variation periods, but they faded as the soft continuum dimmed. The velocity broadening of the recombination lines was , and it was found to be correlated with the ionization parameter. C01 concluded that both emission and absorption features originate from an extended, oblate structure above the accretion disk.
A 335 ks-long exposure of EXO 0748-676 obtained with the XMM-Newton RGS also revealed that the cumulative spectrum of 28 type I bursts contains absorption lines which may be identified with Fe XXV and Fe XXVI at a redshift of Cottam, Paerels & Mendez (2002). These spectral features could represent the first measurement of a gravitational redshift from the surface of a neutron star, constraining and the nuclear equation of state at high density. The spectra of the 5 type I bursts detected with the Chandra High Energy Transmission Spectrometer (HETGS) will be presented elsewhere (Marshall et al., in preparation).
In this work, we use the Chandra HETGS to perform a spectroscopic analysis of EXO 0748-676 during epochs exclusive of bursts in order to study the circumsource medium of the neutron star, and to constrain the elemental abundances of the accreting matter. The broadband high-resolution spectra of the HETGS, from Å, allows us to identify the nature of the absorber which produces the intensity dips. We measure the density, location, and kinematics of the recombination line region, which constrain models of accretion disk structure.
2 Chandra HETGS Data Reduction
The observation was performed on 2001 April 14, with a 47.7 ks exposure (starting at Modified Julian Day 52013.052). Our data was obtained with the HETGS Canizares et al. (2000), which provides two independent spectra: the high-energy grating (HEG) spectrum has a resolution of Å (FWHM), and the medium-energy grating (MEG) spectrum has a Å. We restrict our attention to the Å portion of the HEG spectrum and the Å portion of the MEG spectrum. The photons were detected with the Advanced CCD Imaging Spectrometer (ACIS-S) detector. The data were processed to level 2 with the CIAO tools version 2.2.1, 111CIAO is the Chandra Interactive Analysis of Observations, a software system developed by the Chandra X-Ray Center. using the default spatial and pulse-height extraction regions for the HEG and MEG spectra. We used the lightcurve tool to histogram the count rate as a function of event time. We used the dmcopy tool to select time cuts from the event list. We produced event lists for two different states which were selected by count rate. We generated an effective area for each event list selection, as well as the exposure maps needed to obtain fluxed spectra using mkgarf. The rebinning and fitting of spectra were performed using the ISIS program Houck & Denicola (2000). Spectra from the and grating orders were combined to obtain the total HEG and MEG spectra. These spectra are fit simultaneously with phenomenological models. The HEG and MEG spectra are summed for display purposes only, since their line response functions differ considerably.
We performed continuum fits on the HETGS spectra and searched for discrete features. Our criteria for the identification of a discrete spectral feature are that 1) the number of counts in the line represents a deviation from the continuum level, 2) the equivalent width (EW) of the feature is consistent in both HEG and MEG spectra when both gratings have sufficient counts, or else that the feature is observed in the and orders of the grating with the largest effective area, 3) the feature does not fall within a chip gap, and 4) the identified feature is spectroscopically tenable. We determined limits on some of the expected features. The unidentified residuals may, in some cases, be due to instrumental effects. Effective area systematic errors are not included in our plots. Systematic errors are occasionally visible in the 5.4 to 6.2 Å region due to uncertainties at the Ir M-shell edges.
3 Light curves
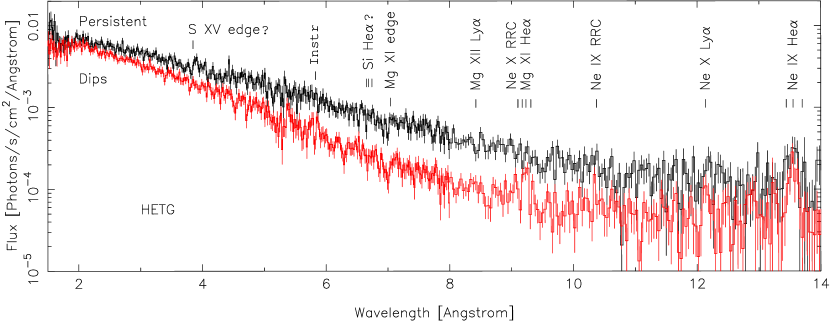
The X-ray light curve of EXO 0748-676 exhibits eclipses, intensity dips, and type I bursts. Previous observations of EXO 0748-676 with low spectral resolution instruments Parmar, White, Giommi, & Gottwald (1986); Thomas et al. (1997) yielded light curves which resemble the HETGS broadband light curve in Figure 1. We split the HETGS light curve into three wavebands. The HETGS wavebands have sharp, resolution-limited boundaries ( Å).
The appearance of the light curve varies from one waveband to another (as shown in Figure 2). Both the behavior of the light curves and the spectroscopic data presented below indicate that this variation is mainly due to intensity dips. In the 1.5 to 3 Å band, the X-ray flux is nearly constant outside the eclipse and burst epochs, and only traces of dips are discernible. Most of the variability in the hard band of the persistent light curve is statistical. Significant changes in the accretion rate are not discernible in the light curve. We observe four eclipses, each lasting s. We find five type I X-ray bursts which are each s in duration. At least some of the variation of burst brightness appears to be due to a variable absorbing column of gas in the line-of-sight, since the dimmest burst (the fifth in time order) occurs during a pre-eclipse dip phase. The second-dimmest burst (also the second in time) occurs just before a pre-eclipse dip. In the 3 to 6 Å band, there are two types of dips, stochastic and periodic. The periodic dips occur at mid-orbit () and before eclipse ingress (). The light curve evolves with each successive binary orbit. The evolution of the dips from one binary orbit to the next indicates that the accretion flow geometry is changing at the outer edge of the accretion disk. Above 6 Å, the light curve appears to have “soft flare” events (Bonnet-Bidaud et al., 2001, C01), one of which is in our data near the 8 ks mark. Alternatively, these “soft flares” can be explained by the variability of the absorber column, which is found in the high-resolution spectra (§4). Above 6 Å, the eclipse ingresses appear to fade away because of deep pre-eclipse dips. In contrast, the eclipse egresses do appear in the Å light curve because dips are shallow at those times.
The intensity dip timescale is shorter than the size of the bins in the HETGS light curve ( s). There are rapid intensity fluctuations which drive the count rate from maximum to minimum, or an order of magnitude change in the soft ( Å) band, as shown in Figure 2. These fluctuations are common in the data and are statistically significant.
We obtain spectra for selected time intervals, with cuts based on the light curve, to isolate events during the deep dip state, the persistent (or shallow dip) state, the eclipses, and the burst events. To make the cuts, we use the light curve for Å in Figure 2. First, we exclude the times during bursts and eclipses. Then, we set a fiducial cut at 0.3 , below which we obtain the dip state with an exposure of 29.5 ks, and above which we obtain the persistent state, with 15.7 ks.
4 High-Resolution X-ray Spectroscopy of Dip and Persistent States
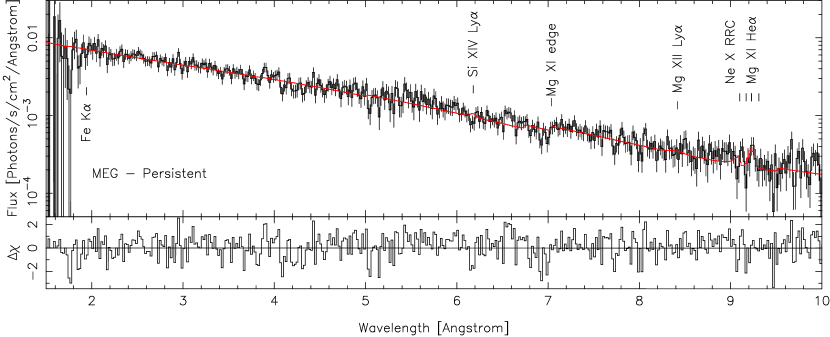
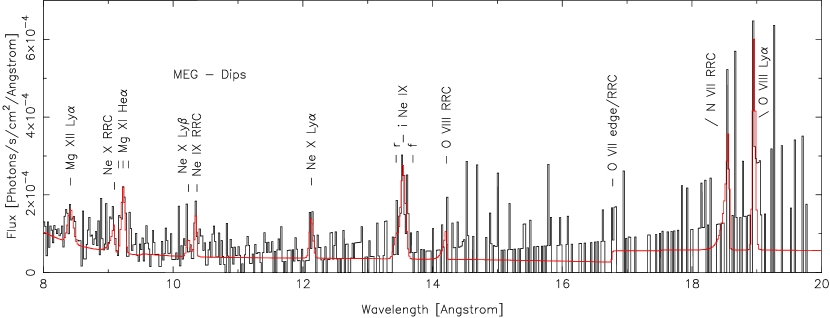
The HETGS X-ray spectra reveal emission and absorption features which evolve with the soft X-ray intensity. The EW of the lines and the edge depths are larger during the dip state than during the persistent state. However, the line fluxes remain constant. The intensity dip spectra are best fit by an absorber composed of both neutral and ionized gas. Figure 3 shows the combined HEG and MEG spectra. The spectra require three emission components: (1) a bright, hard, power-law continuum; (2) a dim, soft continuum; and (3) a recombination emission component with resolved velocity broadening. Components 2 and 3 have a smaller absorbing column than component 1.
The observed discrete emission is produced by electron-ion recombination in a photoionized plasma. The lines detected with the largest statistical significance, as well as upper limits for selected lines, are listed in Table 1. The recombination features consist of lines from H-like and He-like ions plus radiative recombination continua (RRC). The most prominent lines in the HETGS spectra are the Mg XI and the Ne IX intercombination () lines, and O VIII Ly. Mg XII Ly, Ne X Ly, Ne X RRC, Ne IX RRC, and O VII are weaker but still detected with a significance . Possible detections include Si XIV Ly, Ne X Ly, N VII RRC, and O VIII RRC. Collectively, these features reveal the presence of a photoionized plasma, which also produces absorption edges of O VII and Mg XI in the spectra. The fluorescence lines (Si K, S K, and Fe K) are not detected at the 3 level. The recombination lines have larger EWs during dips, because the X-ray continuum is weaker during the dip states than during the persistent states.
In the following, we constrain the density, temperature, and dynamics of the photoionized plasma. We measure the elemental abundance ratios in the emitting plasma. We also test continuum models for the dip and persistent state spectra, and we identify the ionization level of the absorber.
4.1 Diagnostics with Helium-like ion lines
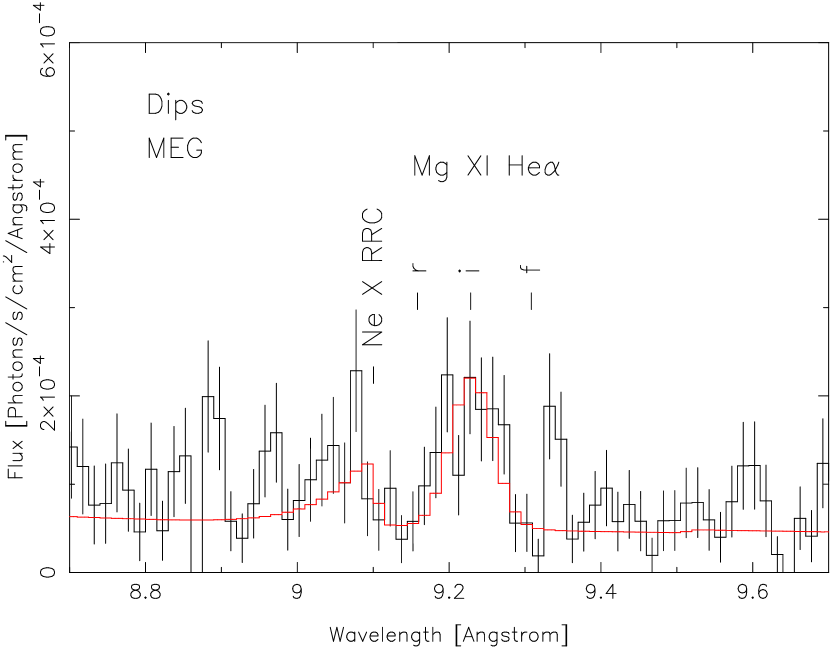
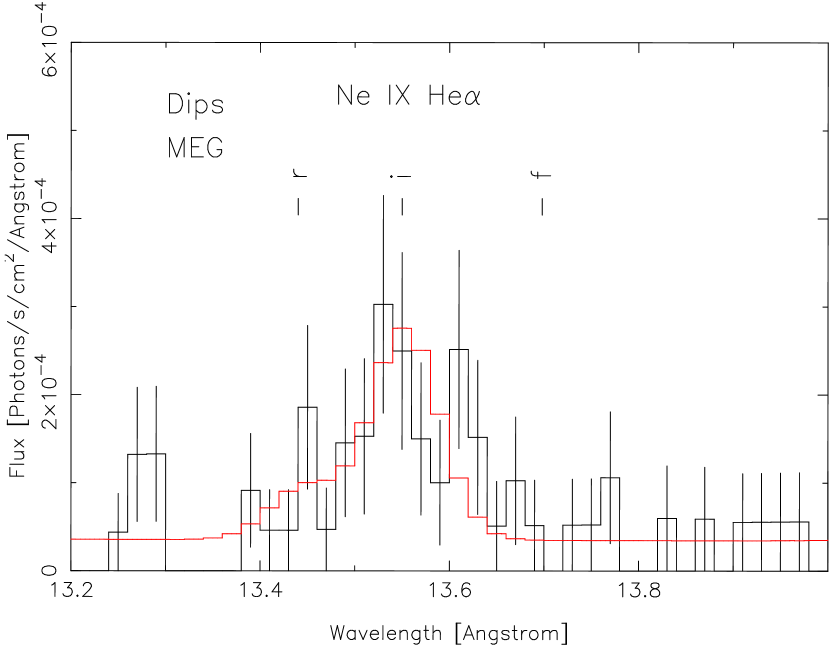
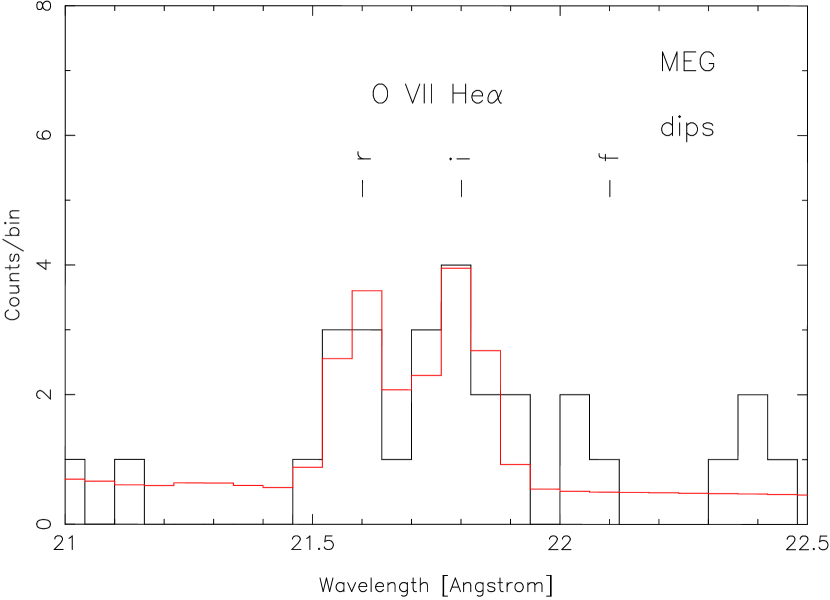
We detect emission from three He-like ions: O VII, Ne IX, and Mg XI. The He lines are shown in Figures 8, 9, and 10. The He line ratios can be used to determine the dominant heating mechanism in the plasma Liedahl (1999). The He line complex can also be used to constrain the electron density () and/or the ambient UV flux Gabriel & Jordan (1969); Blumenthal, Drake, & Tucker (1972). Three lines in the He complex are resolvable with the HETGS: the resonance line ( denotes ), the intercombination line ( denotes the two blended transitions ), and the forbidden line ( denotes ). The notation identifies each two-electron atomic state, with quantum numbers , , , and . Weak satellite lines are also present in the He complex.
In EXO 0748-676, the line dominates all the He complexes. The and lines are not detected, perhaps with the exception of the line of O VII, for which a few photons are detected. We now discuss the consequences of the observed He line ratios.
The plasma must be heated by photoionization. In a photoionized plasma, recombination is usually followed by RRC emission, and the subsequent bound electron cascades produce the line emission. This contrasts with collisionally ionized gases, for which line emission is predominantly produced after resonant excitation by electron impact. This difference is measurable by the line ratio , which is for photoionized gas and for collisionally ionized gas Liedahl (1999); Porquet & Dubau (2000). The ratios of O VII and Ne IX measured with XMM-Newton RGS were interpreted by C01 as a signature of a recombining plasma. The Chandra HETGS data in Table Discrete X-ray Signatures of a Photoionized Plasma Above the Accretion Disk of the Neutron Star EXO 0748-676 show that the ratios of O VII and Ne IX are consistent with the C01 measurements, and similarly, that for Mg XI. These ratios indicate that photoionization is the dominant heating mechanism for a wide range of ionization parameters.
The plasma density is very high, or the UV field is very intense near the He emission region, or both. This is based on the upper limits we set on the line ratio from helium-like ions (Table Discrete X-ray Signatures of a Photoionized Plasma Above the Accretion Disk of the Neutron Star EXO 0748-676). The ratio of the plasma depends on the effects of electron-impact excitation at high density and/or photoexcitation by an intense UV field Gabriel & Jordan (1969); Blumenthal, Drake, & Tucker (1972); Mewe & Schrijver (1978). In the limit of a weak UV field (), the density is constrained to be above a critical value . Conversely, in the low density limit (), the net UV flux is constrained to be above a critical value at Å, 1270 Å, and 1033 Å, which correspond to the (or ) transitions of O VII, Ne IX, and Mg XI, respectively. Note is the UV flux local to the He emission region in units of Å. We conservatively estimate by equating , where is the decay rate from Drake (1971), and is the photoexcitation rate. Kahn et al. (2001) used a similar procedure to set limits on the distance from the He emission region to the UV source. The photoexcitation rate is
| (1) |
where , are the electron charge and mass, is the speed of light, and is Planck’s constant. We calculate by using the oscillator strengths for the transitions in O VII and Ne XI from Cann & Thakkar (1992) and in Mg XI from Duane Liedahl (private communication, 2002). C01 attributed the ratio in O VII and Ne IX observed in EXO 0748-676 to electron-impact excitation, thereby setting lower limits to the density. We set both density and UV flux limits, as shown in Table Discrete X-ray Signatures of a Photoionized Plasma Above the Accretion Disk of the Neutron Star EXO 0748-676. Photoexcitation may be important for N VI through Mg XI, and the limits we set on the UV field make up for the absence of UV spectral data. A detailed calculation of the electron populations in the shell of He-like ions in photoionization equilibrium is needed to determine accurate limits on the space of allowed values of .
In EXO 0748-676, the electron temperature is low compared to that of a collisionally excited gas of equivalent ionization. The ratio of Mg XI implies an electron temperature K. Similarly, for Ne IX we get K and for O VII we get K. In §4.2, we improve upon the above limits by use of the RRC.
4.2 Temperature diagnostics
We detect Ne IX RRC and Ne X RRC, at a 3 and 4 level respectively, which confirms that the plasma is photoionized and allows us to constrain . Free electrons recombining with ions produce an RRC width proportional to Liedahl & Paerels (1996). In EXO 0748-676, the velocity broadening observed in the recombination lines implies that for the RRC, velocity and temperature broadening are of the same order. We fit the RRC profiles neglecting velocity broadening, and the resulting 3 upper limit is eV or K for these ions. This is in the expected range calculated using the XSTAR Kallman & McCray (1982) photoionized plasma equilibrium model.
4.3 Line profiles
The measured velocity broadening of the three brightest lines is consistent with a constant value of (see Table 1). EXO 0748-676 and 4U 1626-67 Schulz et al. (2001) are the only LMXB known to exhibit broadening in their soft X-ray emission lines, which are likely indicative of Kepler motion in the accretion disk. We fit the lines with Gaussian profiles using the Cash (1979) statistic, which is appropriate for Poisson errors. The statistical error on the velocity broadening is , where is the number of photons in the line. Due to the small number of counts, the remaining lines are not included in the computation of above, and instead we fix their . This is done since the Poisson fluctuations in the continuum dominate the profiles of the weakest lines.
The HETGS spectra show that the velocity broadenings () of the lines from one ionic species to another are equal within . Observations of N VII, O VIII, and Ne X with the XMM-Newton RGS revealed a trend in with ionization state, with differences as large as (C01). Our HETGS data for Ne IX, Ne X, and Mg XI, show smaller line widths than those measured with RGS and smaller differences in from one line to another (Table 1).
4.4 An absorbing medium composed of ionized and neutral gas
Our fits of the HETGS spectra show that dips can be produced by an absorbing medium composed of both neutral and ionized gas (or “warm absorber”). The medium selectively absorbs the hard X-ray continuum, but not the recombination emission, which is only absorbed by interstellar gas. We assume Solar abundances for the neutral component of the absorber.
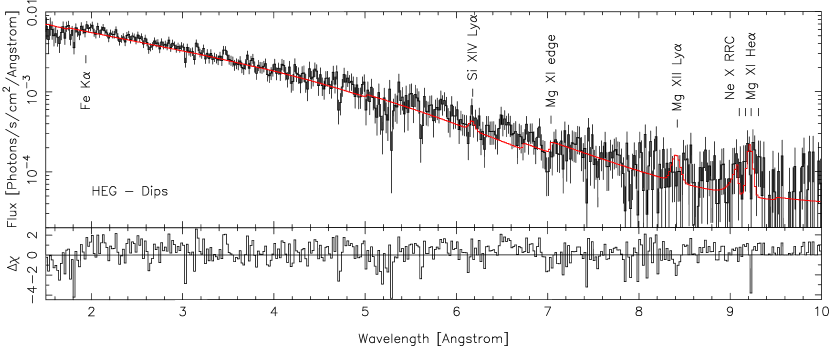
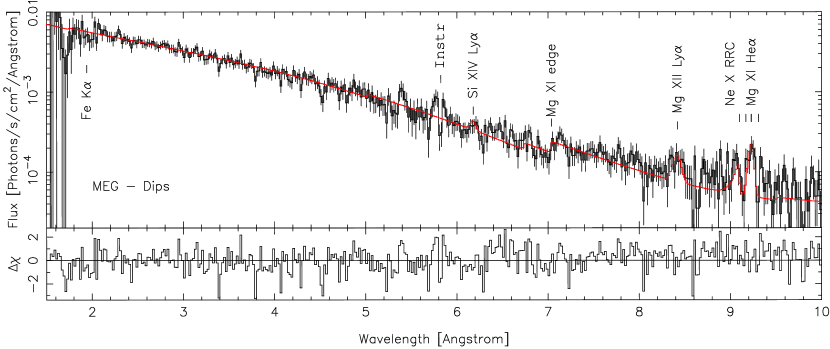
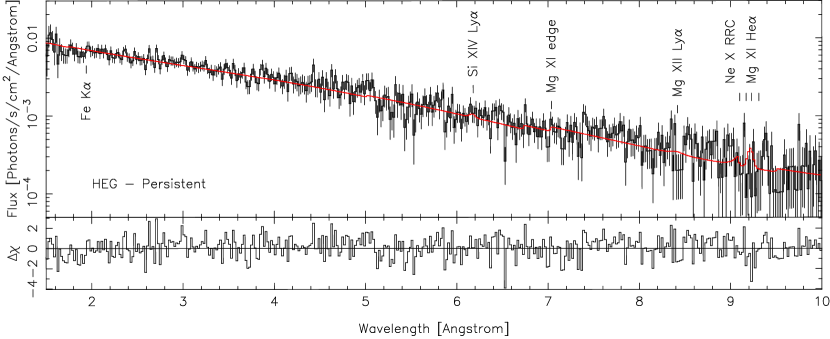
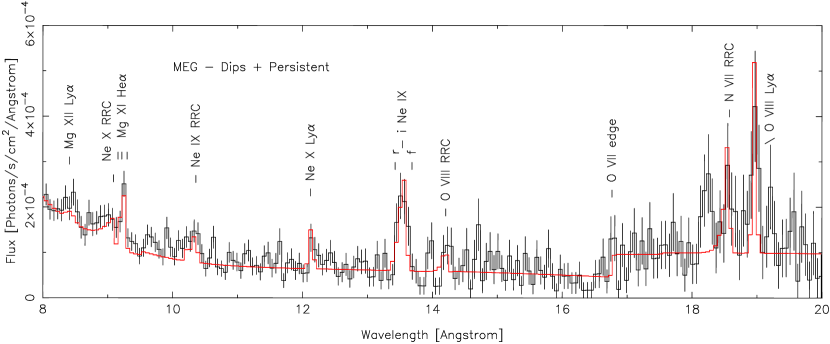
We detect both O VII K and Mg XI K absorption edges (the edge optical depths are shown in Table 3). The O VII K edge is detected only during the persistent state, and it implies (Fig. 7). We also find a Mg XI K edge (see Figs. 4 and 5). The Mg XI K edge is most prominent in the MEG grating order which is not affected by a chip gap. The Mg XI column density is constant or slightly increasing from the persistent to the dip state, from to . For comparison, the absorber on the hard continuum increases by a factor of two from the persistent to the dip state (see Tables 5 and 6).
4.5 Elemental abundance ratios derived from recombination emission
We use the method introduced by Jimenez-Garate et al. (2002) to measure the elemental abundance ratios. In this method, we use a recombination plasma model with a finely spaced distribution of ionization parameters to fit the observed emission. We calculate a grid of thermal equilibrium models versus ionization parameter , using the XSTAR plasma code Kallman & McCray (1982). We fit the differential emission measure as a function of with a power-law distribution of the form
| (2) |
where , and are fit parameters, and the emission measure is . We use the recombination rate coefficients calculated by Liedahl (private communication) with the HULLAC code Klapisch et al. (1977), to calculate the emission line fluxes. We fit the spectral data during the dip state, where the H-like and He-like lines of O, Ne and Mg are detected. We fit six spectral lines with four parameters: two emission measure parameters plus two abundance ratios. Thus, the fit is over-constrained. Our results are shown in Table 4. We find that the O/Ne abundance ratio is smaller than the Solar value by 3. The Mg/Ne ratio is within 2 of the Solar value. We caution that the detection of more ionic species is desirable to further constrain the DEM and to make the Mg/Ne abundance measurements more robust.
Our results are consistent with the O/Ne abundance ratio estimated by C01, who defined an ionization parameter of formation to estimate the emission measure. They also estimated a Solar value for the N/Ne abundance ratio. We assign a Solar abundance to Ne.
4.6 Continuum emission
We test partial covering and two-power-law continuum model fits of the HETGS spectra. The parameters of continuum fits using a two power-law model are shown in Table 5. The parameters of the fits using a partial covering model are shown in Table 6. The fit results for both the dip and persistent states are shown. We find a very weak soft component with both models (fits without it are just marginally worse). The goodness-of-fit from the Cash statistic is the same for either model.
The partial covering model requires a change in the normalization of the hard power-law. It is not able to fit the data well with just a change in the covering fraction and . The intensity changes by % from the dip to the persistent state, which may be due to a change in the accretion rate. The model fits with the two power-law model for the dip state are shown in Figure 4 and for the persistent state in Figure 5. In the Å range, we do not find a statistically significant spectral feature, following the criteria in §2.
5 Discussion
The recombination emission and the O VII and Mg XI K-shell absorption edges observed in EXO 0748-676 constrain the density and location of the photoionized plasma, which appears coincident with an outer disk thickened by X-ray radiation and by stream-disk impact. The thickened disk is not necessarily out of hydrostatic equilibrium. Aside from eclipses and type I bursts, we attribute the continuum variation to dipping due to absorption from a mix of ionized and neutral gas in the line of sight. The absorbing material is likely in the outer disk. The observed He-like ion emission lines imply that the plasma is at high density or there is a strong UV field, either of which provide evidence for the proximity of the line emission region to the accretion disk. We set a limit on the Mg/O abundance ratio implied by the absorption edges and compare the result to the ratio derived from the emission lines.
5.1 The structure and density of the absorber and the soft component
The absorber, composed of neutral and ionized gas, is located at the outer accretion disk, at a height above the disk midplane, which is determined from the inclination (see §1). Our spectral fits do not exclude the possibility that the addition of other ionized species can fully account for the absorption. The periodic dips are produced by gas just inside the Roche Lobe of the neutron star. The dips at orbital phase are produced by gas located at the point where the accretion stream impacts the disk. The dips at may originate in a warp or bulge on the outer rim of the disk. The stochastic dips are either due to stochastic structure at the outer disk rim or are located at the inner disk. Whereas C01 reported no measured change in the K-shell absorption edges of O VII and O VIII, we find evidence for variability of the optical depth of the K-shell Mg XI edge, which is correlated with dip activity. The spectral changes imply that all the intensity variations outside eclipses and bursts are due to dips, and that these dips are produced by column density variations of the partially ionized absorber.
The soft X-ray continuum region is spatially compact, whereas the recombination emission region is extended. The emission region size can be inferred from the orbital phase variations in the light curve. C01 concluded that both continuum and line emission regions should be extended, because the 6–35 Å intensity was independent of orbital phase. An extended line region is consistent with our HETGS results, since the line fluxes are not affected by dips (the region size is measured via the line widths in §5.2). However, from the eclipse egress duration of s in the 6–22 Å band, we constrain the soft X-ray continuum region size to cm. The eclipses observed with the Rossi X-ray Timing Explorer yielded a source size of (1–3) cm in the 0.6–6.2 Å band (J. A. Jenkins & J. E. Grindlay, in preparation). A relative orbital speed of was used in both measurements.
The ionized absorption and X-ray recombination emission can originate in the same region, as suggested by C01. From the derived (§4.4), we find for the persistent state along the line of sight, and for the dip states, since the absorption region has ( and denote the Solar and observed abundances for element X, respectively). These density limits agree with those derived for the Mg XI in emission (Fig. 11), and therefore the same region can produce the observed absorption and emission. Similarly with , we set , which is consistent with the R ratio.
Our finding that the absorber has two components with distinct ionization parameters supports the picture proposed by Frank, King, & Lasota (1987) to explain the origin of the intensity dips in LMXBs. In this picture, the presence of episodic dips is explained by the transit of clouds embedded in a two-phase medium which is produced by photoionization.
5.2 Constraints on accretion disk properties
The spectroscopic evidence points to a recombination region which is located above the outer accretion disk. We constrain the density and location of the Mg XI emission region, based on 1) the ionization level of Mg XI calculated with photoionization equilibrium models, 2) the emission measure derived from the Mg XI He flux, and 3) the interpretation of the Mg XI velocity broadening as circular Keplerian motion around the neutron star. We set , where is defined such that for , % of the Mg XI line flux is emitted, and is the unabsorbed X-ray luminosity. The model in §4.5 yields ( is in units of ). To set a lower limit on the rms value of , we obtain the EM of the Mg XI-emitting plasma from the fit in Table 4. We derive upper limits for the systemic velocity of for Ne IX He, for Mg XI He, and for Mg XII Ly (at 90% confidence; for the He lines, we keep and fixed). Such small systemic velocities are expected if the emitting plasma is orbiting the neutron star (C01). The EWs of the double-peaked optical emission lines with are enhanced during X-ray eclipses, which were interpreted as emission from a disk with cm Crampton et al. (1986). For circular Kepler orbits, and in the absence of optical depth effects, % of the line emission occurs at . This limit is less dependent on the disk emissivity than the characteristic derived by C01. The set of and limits in Figure 11 show that the Mg XI emission region is fully consistent with a plasma in orbit inside the primary’s Roche lobe. The threshold density derived from the Mg XI ratio in §4.1 bisects the allowed range.
Our measurements show that the line emission originates predominantly at the outer decade in radius. The we measured for Mg XI, Ne IX, and Ne X are in agreement with the C01 measurements for N VII. The for Ne X and O VIII reported by C01 are significantly larger than our values. Whereas C01 found a correlation between and the ionization level of the emitting ion, we find no evidence for such a correlation (see §4.3). This implies that the emissivities of different ions have similar dependence. In that case, for ions at a given from the neutron star, a density gradient is needed to produce distinct ionization parameters. Instead of the radially layered ionization structure proposed by C01, we find that vertical stratification of the disk density at each radius can explain the observed line widths.
The presence of photoionized plasma at large disk radii and at a height requires a mechanism to expand the disk in the vertical direction. The disk temperature predicted by the Shakura & Sunyaev (1973) model for is
| (3) |
and it is too low to explain the presence of the H-like and He-like ions, where is the accretion rate in units of , is the neutron star mass in units of 1.4 , and is the radius in units of cm. For , the Shakura & Sunyaev (1973) scale height to radius ratio is
| (4) |
which is too small to explain the absorption edges at . C01 suggested through a similar argument that the disk material must be far from hydrostatic equilibrium in the vertical direction.
We propose that two mechanisms cause the disk expansion: 1) the impact of the accretion stream with the disk; and 2) the illumination from the neutron star, since the disk is heated and its scale height increases. Firstly, the ram pressure at the site of the impact of the accretion stream with the outer disk will increase the disk thickness. The increase in disk thickness depends on the ratio of the ram pressure to the outer disk pressure, as well as on the cooling timescale of the gas compared to the dynamical timescale. Theoretical calculations show that at ∘, the pre-eclipse dips in EXO 0748-676 can be understood as a result of absorption from a bulge produced by disk-stream impact (Armitage & Livio, 1998, and references therein). The mid-orbit dips could be due to a similar impact point at smaller radii. Secondly, as shown in Figure 11, photoionization equilibrium models show that irradiation from the observed neutron star continuum can energize the disk and produce the line emission. To illustrate this, consider that the effective temperature of the neutron star continuum is
| (5) |
where is the luminosity in units of . Another effect of photoionization heating is to increase the disk photosphere scale height significantly at large radii by roughly
| (6) |
Models of a centrally illuminated accretion disk atmosphere and corona, which include temperature and pressure gradients as well as radiation transfer, yield atmospheric scale heights which are compatible with the observed ionized absorption, with model parameters and cm Jimenez-Garate, Raymond, Liedahl, & Hailey (2001); Liedahl et al. (2001). These models show that an atmosphere heated by irradiation can produce a geometrically thickened disk in hydrostatic equilibrium.
While a detailed comparison of the data with accretion disk atmosphere models is outside the scope of this article, the models are constrained by the measured line fluxes, the line profiles, and by the DEM(). For example, the behavior of the line profiles for ions at different ionization levels provides information on the disk structure. A disk in which the DEM is set by vertical stratification will yield nearly equal for all ions, while if the DEM is set by radial stratification, will increase with .
5.3 UV emission from the disk can photoexcite He-like ions
We use the observed ratio to measure the UV emission of the accretion disk, for the low density case. Having established the location of the recombination region by other means, we can use the ratios to estimate the UV luminosity of the disk. We use the limits on at Å, 1270 Å, and 1637 Å, which are local to the recombination region. The limits from photoexcitation calculations assume and are shown in Table Discrete X-ray Signatures of a Photoionized Plasma Above the Accretion Disk of the Neutron Star EXO 0748-676 (see also §4.1). Taking a fiducial distance between the recombination region and the disk photosphere to be cm, we get ÅÅ, ÅÅ, and ÅÅ. The UV emission of a model disk with is calculated using equation (3) plus a neutron star illumination term, with the disk albedos calculated by Jimenez-Garate, Raymond, Liedahl, & Hailey (2001). The model disk luminosities (for cm) are ÅÅ, ÅÅ, and ÅÅ. If cm, Å is % lower and is unchanged for Å. We conclude that in the low density limit, the derived lower limits on the UV luminosity are fully consistent with the expected disk emission.
The effects of UV photoexcitation of in the ratio of low- and mid- He-like ions were identified in the spectra of stellar coronae and X-ray binaries. Photoexcitation was taken into account to accurately measure the density in the Solar corona with C V Gabriel & Jordan (1969); Blumenthal, Drake, & Tucker (1972); Doyle (1980). Photoexcitation by the UV field in the vicinity of O-stars was found to overwhelm the effect of electron-impact excitation, producing ratios of Ne IX and O VII, with evidence for similarly low ratios of N VI and Mg XI Kahn et al. (2001). Direct observations of X-ray and UV spectra showed that photoexcitation can account for the ratio of N VI through Ne IX in Hercules X-1, an intermediate-mass X-ray binary Jimenez-Garate et al. (2002). From our data and that of C01, we have shown that in EXO 0748-676, photoexcitation by the accretion disk UV emission can drive the ratio of N VI through Mg XI.
5.4 Elemental abundance ratios derived from edges
While the Ne/O and Mg/O abundance ratios derived from our emission line model are within 3 of Solar, the edge-derived Mg/O ratio is larger than the Solar value. The recombination line analysis implies that the EM decreases with . If we assume the line-of-sight gas follows a similar trend, then and the abundance ratio times the Solar value (3 limit). However, the edge-derived abundances may not be as reliable as those obtained from emission lines, since the soft continuum (absorbed by O VII) and the hard continuum (absorbed by Mg XI) require distinct spectral components, so our line of sight to them may differ. There is a marginal detection of a larger-than-expected neutral Mg K edge at 9.48 Å in the spectrum of Figure 7. The abundance ratio obtained from the emission lines is or times Solar, depending on the model chosen (Table 4).
6 Conclusions
The Chandra HETGS spectra reveal discrete absorption and emission features which are the signatures of a photoionized plasma in orbit around the neutron star in EXO 0748-676. We discern a compact source of continuum X-rays with hard and soft components, as well as an extended recombination emission region originating in the outer decade in radius above the accretion disk. The recombination emission is more prominent above 8 Å and during dips, since it is less absorbed than the compact continuum emission. During three binary orbits, the color dependent X-ray light curves show that the intensity variations are due only to eclipses, type I bursts, and intensity dips, with no evidence for accretion rate changes %.
The high-resolution X-ray spectra show that intensity dips are caused by the increase in column density of an absorber which is composed of photoionized plasma and neutral gas. Both the Mg XI edge optical depth and are correlated with dip activity. The signatures of the photoionized absorber are the K-shell edges of Mg XI and O VII, as well as the O VIII and O VII K-shell edges found by C01. The periodic absorber is located in two bulges of the outer accretion disk, one of which is near the accretion stream. Another component of the absorber does not correlate with orbital period. The photoionized medium also produces emission features with a large velocity broadening of , but with a small systemic velocity (at 90% confidence). The radiative recombination emission lines Mg XII Ly, Mg XI He, Ne X Ly, Ne IX He, O VIII Ly, and O VII He are detected, as well as the RRC of Ne X and Ne IX, which are signatures of a photoionized gas with eV. Our line model fits imply O/Ne and Mg/Ne abundance ratios within 3 of the Solar values. The ionized edges may, however, require a Mg/O abundance ratio times Solar (3).
The photoionized plasma is located at the outer decade in radius of an accretion disk which is thickened by X-ray illumination and by the impact of the accretion stream on the disk. The plasma is located at a height above and below the disk midplane, which is larger than the Shakura & Sunyaev (1973) model predictions. Spectroscopic constraints on the ionization parameter, density, kinematics, and UV radiation environment of the emitting plasma, all indicate that it is bound in Kepler orbits inside the neutron star Roche Lobe. X-ray photoionization heating from the neutron star and ram pressure from the accretion stream can sufficiently expand the disk to explain the observed geometry. Accretion disk atmosphere and corona models with vertically stratified ionization can produce disks with the required height. The ionization structure of the observed emission region can be attributed to vertical disk density gradients, with no evidence for radial temperature stratification. The measured spectra introduce stringent constraints on the accretion disk structure, and further model comparisons are warranted by the data.
We expect the spectra of the type I bursts in EXO 0748-676 to be partially absorbed by the ionized plasma in the outer accretion disk, particularly during the intensity dip phases and above Å. The fifth burst in our HETGS observation shows evidence for such absorption (see Figs. 1 and 2). The association we found between dips and an ionized absorber implies that the ionized absorber column on the burst spectra will be largest at orbital phases and , when a disk bulge is in the line of sight. Cottam, Paerels & Mendez (2002) reported an ionized absorber outflowing during the late burst phases, which they modeled in the spectrum to discern the gravitationally redshifted features attributed to the neutron star surface. Since the burst duration is much shorter than the outer disk dynamical timescale, this ionized absorber outflow may be produced by material in the outer accretion disk which is radiatively driven by the burst. In that case, the nature of the outflow would be closely related to the structure of the accretion disk and its time-dependent response to a type I burst.
References
- Armitage & Livio (1998) Armitage, P. J. & Livio, M. 1998, ApJ, 493, 898
- Blumenthal, Drake, & Tucker (1972) Blumenthal, G. R., Drake, G. W. F., & Tucker, W. H. 1972, ApJ, 172, 205
- Bonnet-Bidaud et al. (2001) Bonnet-Bidaud, J. M., Haberl, F., Ferrando, P., Bennie, P. J., & Kendziorra, E. 2001, A&A, 365, L282
- Canizares et al. (2000) Canizares, C. R. et al. 2000, ApJ, 539, L41
- Cann & Thakkar (1992) Cann, N. M., & Thakkar, A. J. 1992, Phys. Rev. A, 46, 9, 5397
- Cash (1979) Cash, W. 1979, ApJ, 228, 939
- Church, Balucinska-Church, Dotani, & Asai (1998) Church, M. J., Balucinska-Church, M., Dotani, T., & Asai, K. 1998, ApJ, 504, 516
- Cottam et al. (2001, hereafter C01) Cottam, J., Kahn, S. M., Brinkman, A. C., den Herder, J. W., & Erd, C. 2001, A&A, 365, L277
- Cottam, Paerels & Mendez (2002) Cottam, J., Paerels, F., & Mendez, M. 2002, Nature, 420, 51
- Crampton et al. (1986) Crampton, D., Stauffer, J., Hutchings, J. B., Cowley, A. P., & Ianna, P. 1986, ApJ, 306, 599
- Doyle (1980) Doyle, J. G. 1980, A&A, 87, 183
- Drake (1971) Drake, G. W. F. 1971, Phys. Rev. A, 3, 908
- Gabriel & Jordan (1969) Gabriel, A. H. & Jordan, C. 1969, MNRAS, 145, 241
- Frank, King, & Lasota (1987) Frank, J., King, A. R., & Lasota, J.-P. 1987, A&A, 178, 137
- Houck & Denicola (2000) Houck, J. C. & Denicola, L. A. 2000, in ASP Conf. Ser. 216, Astronomical Data Analysis Software and Systems IX, ed. N. Manset, C. Veillet, & D. Crabtree (San Francisco: ASP), 591
- Jimenez-Garate, Raymond, Liedahl, & Hailey (2001) Jimenez-Garate, M. A., Raymond, J. C., Liedahl, D. A., & Hailey, C. J. 2001, ApJ, 558, 448
- Jimenez-Garate et al. (2002) Jimenez-Garate, M. A., Hailey, C. J., Herder, J. W. d., Zane, S., & Ramsay, G. 2002, ApJ, 578, 391
- Kahn et al. (2001) Kahn, S. M., Leutenegger, M. A., Cottam, J., Rauw, G., Vreux, J.-M., den Boggende, A. J. F., Mewe, R., & Güdel, M. 2001, A&A, 365, L312
- Kallman & McCray (1982) Kallman, T. R. & McCray, R. 1982, ApJS, 50, 263
- Klapisch et al. (1977) Klapisch, M., Schwab, J. L., Fraenkel, J. S., & Oreg, J. 1977, Opt. Soc. Am., 61, 148
- Lewin, van Paradijs, & Taam (1995) Lewin, W. H. G., van Paradijs, J., & Taam, R.E. 1995, in X-ray Binaries, ed. W. H. G. Lewin, J. van Paradijs, & E. P. J. van den Heuvel, (Cambridge: Cambridge University Press), 175
- Liedahl & Paerels (1996) Liedahl, D. A. & Paerels, F. 1996, ApJ, 468, L33
- Liedahl (1999) Liedahl, D. A. 1999, in X-ray Spectroscopy in Astrophysics, EADN School proceedings, ed. J. A. van Paradijs, & J. A. M. Bleeker (Amsterdam: Springer), 189
- Liedahl et al. (2001) Liedahl, D. A., Wojdowski, P., Jimenez-Garate, M. A., & Sako M. 2001, in ASP Conf. Ser. 247, Spectroscopic Challenges of Photoionized Plasmas, ed. G. Ferland, & D. W. Savin (San Francisco: ASP), 417
- Mewe & Schrijver (1978) Mewe, R. & Schrijver, J. 1978, A&A, 65, 99
- Parmar et al. (1985) Parmar, A. N., White, N. E., Giommi, P., Haberl, F., Pedersen, H., & Mayor, M. 1985, IAU Circ., 4039, 1
- Parmar, White, Giommi, & Gottwald (1986) Parmar, A. N., White, N. E., Giommi, P., & Gottwald, M. 1986, ApJ, 308, 199
- Porquet & Dubau (2000) Porquet, D. & Dubau, J. 2000, A&AS, 143, 495
- Schulz (1999) Schulz, N. S. 1999, ApJ, 511, 304
- Schulz et al. (2001) Schulz, N. S., Chakrabarty, D., Marshall, H. L., Canizares, C. R., Lee, J. C., & Houck, J. 2001, ApJ, 563, 941
- Shakura & Sunyaev (1973) Shakura, N. I. & Sunyaev, R. A. 1973, A&A, 24, 337
- Thomas et al. (1997) Thomas, B., Corbet, R., Smale, A. P., Asai, K., & Dotani, T. 1997, ApJ, 480, L21
- Wilms, Allen, & McCray (2000) Wilms, J., Allen, A., & McCray, R. 2000, ApJ, 542, 914


| Feature | aaThese values are fixed. | Flux | State | |
|---|---|---|---|---|
| [Å] | [] | [ ] | ||
| O VII | 22.097 | 700aaThese values are fixed. | Dip | |
| 700aaThese values are fixed. | Persistent | |||
| O VII | 21.802 | 700aaThese values are fixed. | Dip | |
| 700aaThese values are fixed. | Persistent | |||
| O VII | 21.600 | 700aaThese values are fixed. | Dip | |
| 700aaThese values are fixed. | Persistent | |||
| O VIII Ly | 18.970 | 700aaThese values are fixed. | Dip | |
| 700aaThese values are fixed. | Persistent | |||
| N VII RRC | 18.587 | 0aaThese values are fixed. | Dip | |
| Ne IX | 13.698 | 1200aaThese values are fixed. | Dip | |
| 500aaThese values are fixed. | Persistent | |||
| Ne IX | 13.552 | Dip | ||
| Persistent | ||||
| Ne IX | 13.447 | 1200aaThese values are fixed. | Dip | |
| 500aaThese values are fixed. | Persistent | |||
| Ne X Ly | 12.135 | Dip | ||
| 620aaThese values are fixed. | Persistent | |||
| Ne IX RRC | 10.370 | 0aaThese values are fixed. | Dip | |
| Ne X Ly | 10.239 | 900aaThese values are fixed. | Dip | |
| 732aaThese values are fixed. | Persistent | |||
| Mg XI | 9.314 | 900aaThese values are fixed. | Dip | |
| 650aaThese values are fixed. | Persistent | |||
| Mg XI | 9.230 | Dip | ||
| Persistent | ||||
| Mg XI | 9.169 | 900aaThese values are fixed. | Dip | |
| 650aaThese values are fixed. | Persistent | |||
| Ne X RRC | 9.102 | 0aaThese values are fixed. | Dip | |
| Mg XII Ly | 8.419 | 900aaThese values are fixed. | Dip | |
| 750aaThese values are fixed. | Persistent | |||
| Si XIV Ly | 6.180 | 900aaThese values are fixed. | Dip | |
| 750aaThese values are fixed. | Persistent |
Note. — Errors and upper limits are 1.
| Measured | Measured | Derived | Derived | ||
|---|---|---|---|---|---|
| Ion | Line | Line | [cm-3](1) | [Å] | State |
| Ratio | Ratio | (est.) | |||
| Mg XI | Dip | ||||
| Persistent | |||||
| Ne IX | Dip | ||||
| Persistent | |||||
| O VII | Dip | ||||
| Persistent |
Note. — Errors and upper limits are 1. Symbols: = critical electron density, = critical UV flux at transition wavelength. C01 observed for both O VII and Ne IX, which are consistent with our HETGS observations.
References. — (1) Porquet & Dubau 2000.
| Edge | [Å] | State | |
|---|---|---|---|
| Mg XI K | 7.037aaThese values are fixed. | Dip | |
| Persistent | |||
| O VII K | 16.78aaThese values are fixed. | Persistent |
Note. — Errors are 1, with the continuum parameters and set free.
| of Fit | Ionizing | ||||
|---|---|---|---|---|---|
| ( cm-3) | (o.c.) | Spectrum | |||
| 0.28 | 20 keV brems. | ||||
| 0.52 | PL +cut |
| Fit parameter | Units | Value | Value |
|---|---|---|---|
| (Dips) | (Persistent) | ||
| PL1 Norm. (1 keV) | phot keV-1 cm-2 s-1 | ||
| PL1 | cm-2 | ||
| PL1 Index | |||
| PL2 Norm. (1 keV) | phot keV-1 cm-2 s-1 | ||
| PL2 | cm-2 | aaThese values are fixed. | |
| PL2 Index | 3.3aaThese values are fixed. | ||
| Cash-stat |
Note. — Symbols: o.c. = over-constrained fit. We show the 1 statistical errors. The element abundance ratios (by number of atoms) are normalized to the solar values compiled by Wilms, Allen, & McCray (2000), which are (O/Ne), and (Mg/Ne). The and parameters define the DEM. The abundance measurements depend weakly on the assumed ionizing X-ray continuum.
Note. — Errors and upper limits are 1.
| Fit parameter | Units | Value | Value |
|---|---|---|---|
| (Dips) | (Persistent) | ||
| BB Norm. (1 keV) | phot keV-1 cm-2 s-1 | a | |
| BB | eV | 2a | 2a |
| BB | cm-2 | ||
| PL Cov. Frac. | |||
| PL Index | 1.7a | 1.7a | |
| PL | cm-2 | ||
| PL Norm. (1 keV) | phot keV-1 cm-2 s-1 | ||
| Cash-stat |
Note. — Errors and upper limits are 1.