High Resolution STIS/HST and HIRES/Keck Spectra of Three Weak Mgii Absorbers Toward PG 1634+70611affiliation: Based in part on observations obtained at the W. M. Keck Observatory, which is operated as a scientific partnership among Caltech, the University of California, and NASA. The Observatory was made possible by the generous financial support of the W. M. Keck Foundation. 22affiliation: Based in part on observations obtained with the NASA/ESA Hubble Space Telescope, which is operated by the STScI for the Association of Universities for Research in Astronomy, Inc., under NASA contract NAS5–26555.
Abstract
High resolution optical (HIRES/Keck) and UV (STIS/HST) spectra, covering a large range of chemical transitions, are analyzed for three single–cloud weak Mgii absorption systems along the line of sight toward the quasar PG . Weak Mgii absorption lines in quasar spectra trace metal–enriched environments that are rarely closely associated with the most luminous galaxies (). The two weak Mgii systems at and are constrained to have solar metallicity, while the metallicity of the system is not as well–constrained, but is consistent with th solar. These weak Mgii clouds are likely to be local pockets of high metallicity in a lower metallicity environment. All three systems have two phases of gas, a higher density region that produces narrower absorption lines for low ionization transitions, such as Mgii, and a lower density region that produces broader absorption lines for high ionization transitions, such as Civ. The Civ profile for one system (at ) can be fit with a single broad component ( km s-1), but those for the other two systems require one or two additional offset high ionization clouds. Two possible physical pictures for the phase structure are discussed: one with a low–ionization, denser phase embedded in a lower density surrounding medium, and the other with the denser clumps surrounding more highly ionized gas.
1 Introduction
Weak Mgii absorbers, those with Å, constitute % of the total Mgii absorber population (Churchill et al., 1999) at . They account for a fair fraction of the cm-2 Ly forest (Rigby et al., 2002). Unlike strong Mgii absorbers (which almost always are associated with a galaxy (Bergeron and Boissé, 1991; Steidel, Dickinson, and Persson, 1994; Steidel, 1995)), weak Mgii absorbers can usually not be associated with a galaxy within impact parameter kpc of the QSO (Rigby et al. (2002); C. Steidel, private communication). This lack of an association with bright galaxies suggests that weak Mgii absorbers may be a physically different population than strong Mgii absorbers.
Studying the physical conditions of weak Mgii absorbers (eg., metallicity, ionization conditions, total column density, and size) is useful for two reasons: 1) Physical conditions provide clues as to the nature of these absorbers, whose physical origin is not known; 2) Weak Mgii clouds provide an opportunity to study metal–enriched environments over a range of redshifts. They trace metal production either in intergalactic space or in dwarf or low surface brightness galaxies.
A study of weak Mgii absorbers at requires spectra in both the optical and in the UV in order that the several key low and high ionization transitions (especially Mgii, Feii, Civ), as well as the Lyman series, are covered. Using the Keck/High Resolution Spectrograph (HIRES) (Vogt et al., 1994) at high resolution () and the Faint Object Spectrograph (FOS)/Hubble Space Telescope (HST) at low resolution (), Rigby et al. (2002) applied photoionization models to single–cloud weak Mgii absorbers. They argued that many multiple cloud weak absorbers (which comprise % of the weak absorbers) are likely to be part of the same population as the strong absorbers, but that single–cloud weak systems are likely to be a different population.
At least half of the weak, single–cloud systems of Rigby et al. (2002) require a second phase of gas in order to reproduce the Civ absorption and/or to fit the Ly profile without exceeding the Hi column density derived from the Lyman limit break. While the Mgii clouds typically have Doppler parameters of – km s-1, the second phase must have a larger effective Doppler parameter (– km s-1). With only the low resolution UV data available to Rigby et al. (2002), it was not clear if this implies a single broad component or multiple, blended clouds. Also, in the systems for which the second phase is not required (such as when only a limit for Civ can be derived), it was not clear if the phase is just less extreme in its properties or if it is absent.
By comparing the Mgii column densities to the Ly profiles, Rigby et al. (2002) inferred that weak, single cloud Mgii absorbers have metallicities of at least one–tenth solar in the phase of gas in which the Mgii absorption arises. The sizes and densities of most of the weak, single–cloud systems were unconstrained; however, three of them had , which implies low ionization conditions, relatively high densities, cm-3, and small sizes, pc. Those systems with limits on Feii may be part of a “continuum” of single–cloud weak Mgii absorbers, with some having Feii just below the detection threshold, implying a continuous distribution of ionization conditions. Alternatively, some of the systems without detected Feii could be part of a different population, with ionization conditions, metallicities, and/or environments distinctly different from systems with detected Feii.
In May and June 2000 high resolution UV spectra () of the quasar, PG , became public in the HST archive. We have high resolution optical (HIRES/Keck) spectra of this same quasar. For the first time, weak Mgii absorbers can be studied through simultaneous high resolution coverage of numerous transitions. This allows more direct inferences of the physical properties of the gas, such as metallicity and phase structure. In particular, it should enable a determination of the nature of the second, broad phase required for some absorbers by the large relative strength of Civ absorption in lower resolution data. Is this higher–ionization, broad phase centered on the Mgii cloud or is it offset? Is it produced by multiple clouds or by a single, smooth structure? Are systems for which Civ was not detected at low resolution fundamentally different, or do they merely have a weaker second phase? The kinematics and physical properties of the second phase, and its relationship to the Mgii cloud phase, are important diagnostics of the type of structure responsible for the weak Mgii absorption.
In anticipation of the release of the high resolution STIS/HST spectra, we previously pursued an in–depth study of four Mgii absorbers along the PG line of sight (Charlton et al., 2000) using the available low resolution FOS/HST spectra and the HIRES/Keck spectra. Since only the brightest quasars can, in the near future, feasibly be studied at high resolution in the UV, we aimed to compare inferences drawn on the basis of low resolution spectra to those that would be obtained once the higher resolution spectra were released. Confirmation of our conclusions would lend credibility to larger statistical studies that rely on a combination of high and low resolution spectra (Rigby et al., 2002; Churchill et al., 2000b).
The present paper focuses on three single–cloud weak Mgii absorbers along the PG line of sight. Two of these absorbers, at and , were detected in the HIRES/Keck spectra at the sensitivity of our original weak Mgii survey ( for Mgii ) (Churchill et al., 1999). These two systems are dramatically different from each other in that the system has a stringent limit on Civ ( Å at ) while the absorber has Civ detected at Å. In the latter system, the Civ arises not in the Mgii cloud phase, but in a second phase of gas. This provides an excellent opportunity both to study a system with very weak Civ and to address the nature of the second phase. The metallicity could not be derived for the system because the FOS/HST spectrum did not cover any of the Lyman transitions; however, the new STIS/HST spectra can address metallicity for this system. Models of the absorber did, however, imply a super–solar metallicity and/or a depleted or –enhanced abundance pattern. This conclusion will be re–assessed in this paper. Also, as we will describe in § 2, we have now identified a third single–cloud weak Mgii system at that was just below the detection threshold of our previous study. That system was not modeled in Charlton et al. (2000), but will be considered in the present paper.
We begin in § 2 by presenting, for the three single cloud weak Mgii systems toward PG , high resolution profiles of all relevant transitions covered by STIS/HST or HIRES/Keck spectra. In § 3, we discuss our strategy to infer the physical conditions of these systems by applying Cloudy photoionization models. We also consider the possibility that collisional ionization dominates. The results inferred for the phase structure, ionization parameters/densities, metallicities, kinematics, and abundance patterns of the three systems are presented in § 4. In § 5, the effect of relaxing assumptions of abundance pattern and the shape of the ionizing spectrum are considered. The three weak Mgii systems are compared in § 6. In that discussion, we particularly focus on the nature of the second phase and compare the results to those obtained on the basis of just the lower resolution FOS/HST spectrum. Finally, we summarize our conclusions in § 7.
2 Observations of the Three Weak Mgii Absorbers Toward PG
We briefly describe the observations with HIRES/Keck, STIS/HST, and FOS/HST of PG , and then present the three single–cloud weak Mgii absorbers along this line of sight at , , and . A WFPC2/HST image of the quasar field exists (program 6740, S. Oliver, P. I.) but the quasar is quite bright so it is not possible to perform adequate PSF subtraction in order to detect galaxies close to the line of sight. Also, without redshifts of candidate galaxies in the field, we could not separate out the identities of the three weak and two strong Mgii absorbers.
2.1 HIRES/Keck
The HIRES/Keck observations covered Å to Å at (FWHM km s-1) ( pixels per resolution element). Mgii, Mgi, and Feii transitions are covered for the three systems, but in all cases only Mgii is detected (at ). Equivalent widths and limits are listed in Table 1. The spectra were obtained on 1995 July 4 and 5, and the combined spectrum has over most of the wavelength range, but gradually falling toward the lowest wavelengths. The most stringent limits on Feii come from the reddest of the Feii transitions, at Å. The reduction of the spectrum, continuum fits, line identification, and procedure for Voigt profile fitting were described in Churchill and Vogt (2001).
2.2 STIS/HST
The STIS/HST observations provided useful coverage from Å to Å at (FWHM km s-1) ( pixels per resolution element). Two sets of echelle spectra were obtained with two different tilts of the E230M grating, using the ″ ″ slit. The first, with central wavelength Å, was obtained by Burles et al. in 1999 May and June (proposal ID 7292). The total exposure time was s. The second, with central wavelength Å, was obtained by Jannuzi et al. in 1999 June (proposal ID 8312), with a total exposure time s. The two spectra overlap in the region – Å. We co–added the spectra, weighted by the exposure times, and also combined multiple order coverage in the same spectrum. However, we also considered the differences between the two realizations as an indication of systematic errors (due to continuum fitting, correlated noise, and unknown factors) when comparing model profiles to the data. Reductions were done with the standard STIS pipeline and continuum fits using the sfit task in IRAF111IRAF is distributed by the National Optical Astronomy Observatories, which are operated by AURA, Inc., under contract to the NSF..
2.3 The Three Weak Single Cloud Mgii Systems
Based upon our original analysis of the HIRES/Keck spectrum there were two single cloud, weak Mgii systems along the PG line of sight, at and . After analyzing the STIS/HST spectra, another slightly weaker Mgii system was found in the HIRES/Keck spectra, just below the threshold of our previous survey (Churchill et al., 1999). First, the STIS spectra were searched for Civ doublets. Only one Civ doublet was found with comparable equivalent width to those associated with the two known Mgii absorption systems. The new system, at , also had detected Ly, a Siiv doublet, Cii, and Siii in the STIS spectrum. Based upon the equivalent width of Siii we expected that Mgii should be detected in the HIRES/Keck spectrum. We then searched that location in the HIRES spectrum and found the Mgii doublet. The transition was detected at the level, and the transition at the level. (Our previous survey had a detection threshold for the transition.)
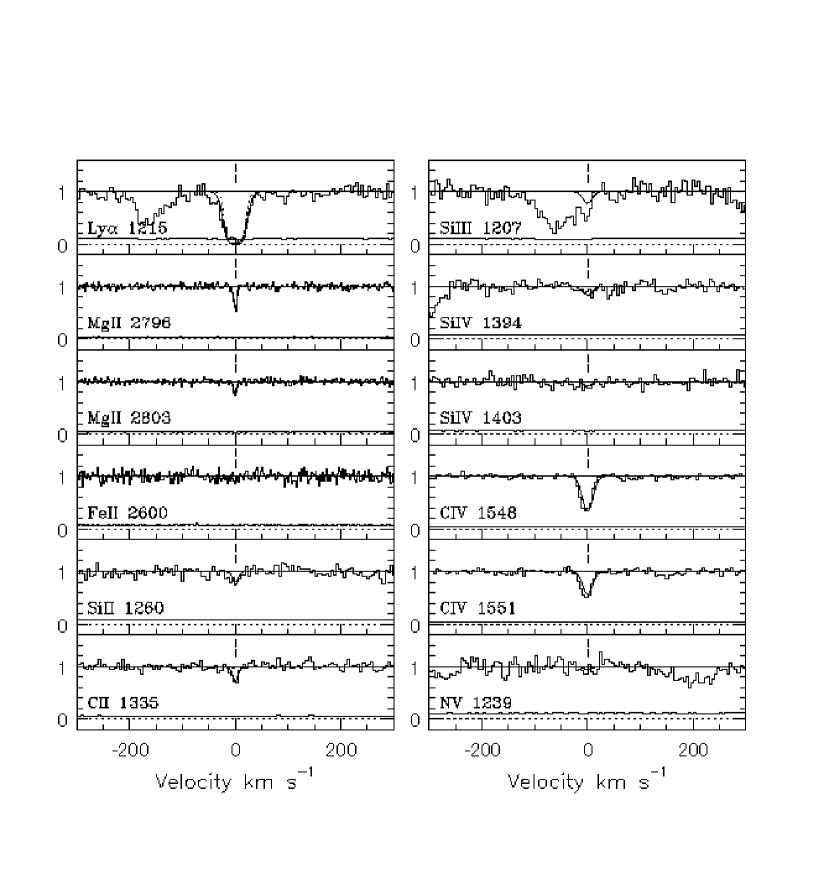
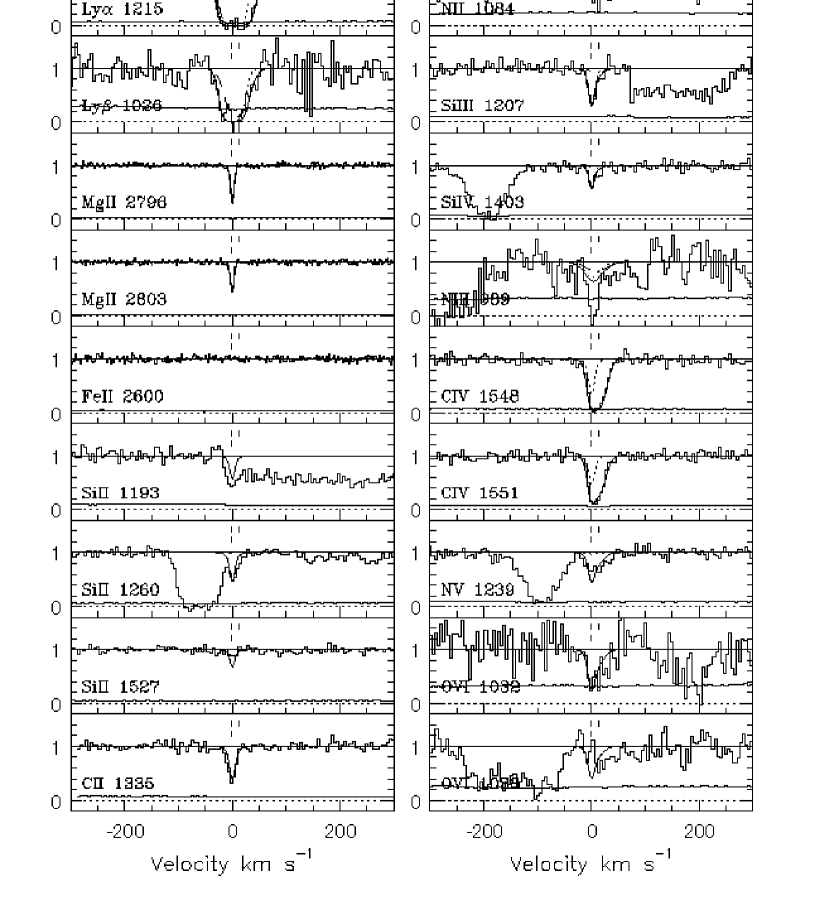
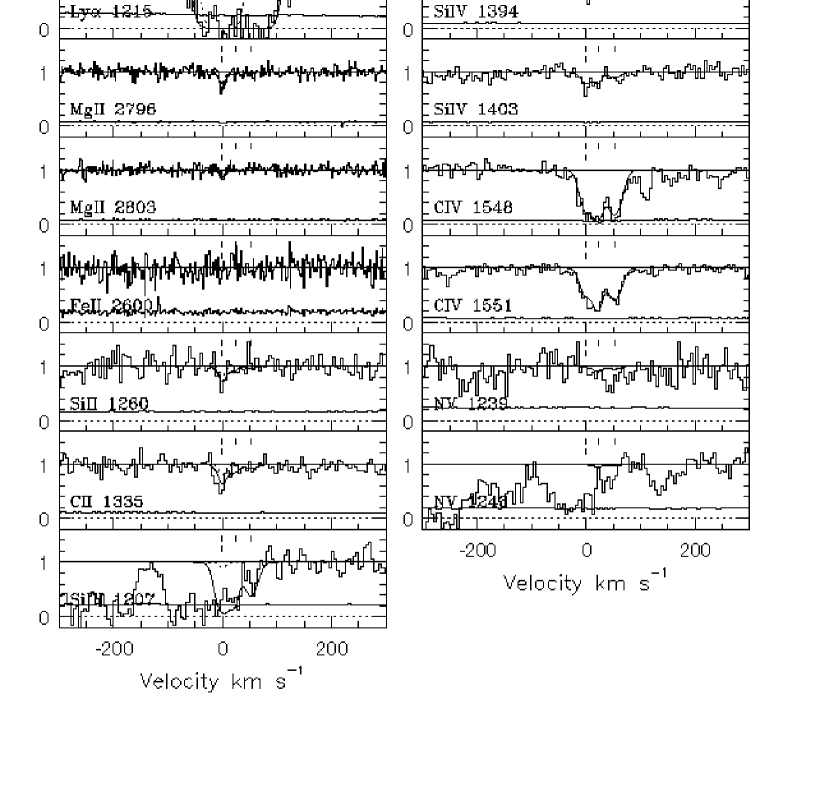
Figure 1 presents detected transitions and limits of interest in constraining the conditions in the system. Figure 2 displays the same for the system, and Figure 3 for the system. Table 1 lists the equivalent widths for detected transitions and selected equivalent width limits () for the three systems. We fit each transition with the minimum number of Voigt profile components consistent with the errors (Churchill, 1997; Churchill, Vogt, and Charlton, 2003). In all three systems, the Mgii and the other low and intermediate ionization tranistions could be fit with one component. However, the Civ profiles required two components for the system, and three for the system. For selected transitions, column densities and Doppler parameters of the Voigt profile fits, performed separately for each transition, are given in Table 2. For the system, numbers are estimated only for Mgii and Civ because fits are ambiguous due to blending.
There is no flux detected from PG shortward of a Lyman limit break at Å, which is due to a strong Mgii absorber at (Charlton et al., 2000; Ding et al., 2002). Also, a partial Lyman limit break at Å reduces the flux to about % of the original continuum level due to a multiple cloud weak Mgii absorber at (Charlton et al., 2000; Zonak et al., 2002). Although Ovi for the system is covered in a STIS G230M spectrum of PG , this reduced flux and crowding with Lyman series lines from the system prevent us from deriving a useful constraint. We therefore have not used the G230M spectrum as a constraint in the analysis.
3 Model Techniques
Several descriptions of the basic technique used for modeling were given in previous papers (Churchill and Charlton, 1999; Charlton et al., 2000; Rigby et al., 2002). For those efforts, only Mgii, Mgi, and Feii were covered at high resolution, and all other transitions were observed with FOS/HST at only . Even with the availability of numerous transitions at high resolution, the modeling technique used in the present paper is very similar to those previous efforts. We begin with the phase of gas that produces the dominant Mgii absorption, “the low ionization phase”. Then we add in other phases of gas as needed to reproduce the observed absorption profiles for all transitions.
For each single–cloud Mgii absorber we begin with the column density, , and the Doppler parameter, derived from a Voigt profile fit to the Mgii doublet. Cloudy photoionization models (version 94.00; (Ferland, 1996)) were applied to determine column densities of the various transitions that would result from the same phase of gas that produces this Mgii, assuming a slab geometry. The parameters for these models are the metallicity (expressed in units of the solar value), the abundance pattern (initially assumed to be solar), and the ionization parameter, . The ionization parameter is defined as the ratio of ionizing photons to the number density of hydrogen in the absorbing gas, . We assume that the ionizing spectrum is of the form specified by Haardt and Madau (1996) for . The normalization of the Haardt and Madau background at is fixed so that . The assumption that stellar sources do not make a substantial contribution is likely to be valid since weak Mgii absorbers typically do not have a nearby high luminosity galaxy, such as a starburst. The effects of alternative spectral shapes are discussed in § 5.2.
The Doppler parameters of other elements are derived from , using the temperature output from Cloudy to derive the thermal and turbulent contributions for each element. For each choice of parameters, the Cloudy output column densities and Doppler parameters are used to synthesize noiseless spectra, convolving with the instrumental profile characteristic of STIS/E230M. The synthetic model spectra are compared with the observed profiles to identify permitted regions of the parameter space. The model column densities and Doppler parameters for permitted models are within of the values measured from the data.
From the three systems studied in this paper, Feii is covered, but not detected. For , the ratio is strongly dependent on the ionization parameter in the optically thin regime (see Rigby et al. (2002)) and the Feii limit can be used to place a lower limit on of the low ionization phase. To obtain an upper limit on the ionization parameter of this phase, Siiv and Civ provide constraints. For optically thin gas, the constraints on do not depend significantly on the metallicity. The metallicity is constrained by fitting the Ly and any higher Lyman series lines that are covered for the system. Low metallicities will overproduce the Ly in the wings. High metallicities will underproduce the Ly, but cannot be excluded since the additional Hi absorption can arise in a different phase. We assumed a solar abundance pattern, but note that there is a simple tradeoff between metallicity and the abundance of the metal–line transition that is compared to the hydrogen, discussed further in § 5.1.
In general, once the basic constraints on are derived, we consider whether a single cloud model can fully reproduce profiles of all of the observed transitions. In all three of the systems modeled in this paper, we will conclude that the Civ absorption cannot be fully produced in the same phase with the Mgii absorption. For the range of permitted values of for the low–ionization phase, we constrain the properties of the high–ionization phase that is required to fit the Civ profile. First, we consider whether a single, relatively broad component is sufficient. If the Civ profile is asymmetric (as in the system) or shows velocity structure (as in the system), then it is clear that more than one component is needed. A Voigt profile fit to the Civ serves as a starting point for deriving the number of clouds needed in the high ionization phase, and their and . Results from these fits are listed in Table 2. The of these Civ clouds is larger than for the Mgii clouds. Cloudy models of this additional phase are constrained to match the observed Civ clouds and is adjusted to determine what range of values are consistent with other transitions. An upper limit is set so that Nv and Ovi (if covered) are not overproduced. A lower limit is set so that the broader components do not produce observable Mgii and Siii. In some cases the intermediate ionization transitions, such as Siiii, Cii, and especially Siiv, could not be fully produced in the Mgii cloud phase. In these cases, an intermediate value of is sought for the Civ clouds in order to also account for the remainder of these transitions, without overproducing the lower ionization transitions. A lower limit on the metallicity of a Civ cloud can be derived in order that Ly absorption is not overproduced. More exactly, it is the combination of the Mgii and Civ clouds that are constrained not to overproduce Ly absorption, so there is a trade–off between their metallicity constraints. If all transitions of a certain element (such as Siii, Siiii, and Siiv) are underproduced relative to other elements, then simple abundance pattern variations (–enhancement and depletion) are considered.
For the high ionization phase, we consider collisional ionization models as alternatives to Cloudy photoionization solutions. In this case, an alternative source of heating (eg., shocks) must be responsible for heating the gas to the assumed, higher . The measured Doppler parameter of the Civ, , is used to place an upper limit on the temperature, . For an assumed and , and with the measured , the collisional equilibrium tables of Sutherland and Dopita (1993) were used to determine the column densities of all other covered transitions. The Doppler parameters of these other transitions, were calculated from , where the turbulent component of the Doppler parameter is given by . In order to constrain , synthetic spectra were generated and superimposed upon the data to facilitate comparison. Also, the model column densities of the various transitions were compared to the measured values.
The Ly profiles provided a constraint on the metallicity of any collisionally ionized phase. “Wings” on these profiles can be produced by such a phase, which would be characterized by a relatively large parameter. The contribution of a collisionally ionized phase to Ly is minimized at low and high metallicity. A lower limit on is therefore set so as not to overproduce Ly at the highest reasonable metallicity (usually taken to be solar). As for photoionization models, for the high ionization phase, the lower limit on the metallicity depends on the metallicity of the low ionization phases, which determines its contribution to Ly.
4 Model Results
First, we describe the model results for the two weak, single cloud Mgii absorbers detected in the original HIRES/Keck survey (Churchill et al., 1999). Then the results for the newly discovered system are presented. A range of parameters for satisfactory models are summarized in Table 3. Model profiles for an example of an acceptable model are superimposed on the data for each of the three systems in Figures 1, 2, and 3. Parameters for these sample models are listed in Table 4. Results in this section use the simplest set of assumptions that produce models consistent with the data, i.e. Haardt and Madau spectrum and a solar abundance pattern. The effects of alternate spectra and abundance patterns are discussed in § 5.
4.1 The System
Figure 1 shows detections of Ly, Mgii, Siii, Cii, Siiii, Siiv, and Civ. There are useful limits for Feii and Nv. An obvious, but important, first result is that Civ is now clearly detected in this system, despite the strong limit from the earlier low resolution data.
We begin with the Voigt profile fit to the Mgii doublet, and adjust the ionization parameter to fit as many of the other transitions as possible. We find that the Mgii cloud is constrained to have . There is no strict lower limit, because the vs. curve is flat for . Very small values of (as low as ) are permitted, but cloud sizes would be extremely small. For , Cii is underproduced. To find an upper limit on ionization parameter, we first determined that, for , the model would produce minimum fluxes at the positions of Siiv and Civ that are consistent with the observed profiles. However, the model and are small compared to the observed values, i.e. the model profiles are narrow compared to the observed profiles. We therefore conclude that the Siiv and Civ are produced in a separate higher ionization phase, and that for the Mgii cloud phase. The contribution of the Mgii cloud phase to the absorption profiles (negligible for all but the singly ionized transitions) is denoted by a dotted line in Figure 1.
The metallicity of the cloud with detected Mgii is constrained to be dex greater than solar (for a solar abundance pattern). For lower metallicities, absorption in the wings of the Ly profile will exceed that observed. Also, unless the metallicity is even higher for the Mgii cloud, the additional high ionization phase (required to fit Civ) is constrained not to give rise to significant Ly absorption. For and , the cloud size would pc. For and , the cloud size would be only AU, and the observed Cii profile would be somewhat underproduced by the model.
Primarily because of the breadth of the Civ profiles, we concluded that a second phase is required to fit the Civ, even in this system for which the Civ absorption is relatively weak. A Voigt profile fit to the Civ profile yields an adequate fit for a single cloud with km s-1 that is centered on the Mgii cloud. Details of the fit are listed in Table 2. We consider whether the Civ can be produced by photoionization, and/or whether it can be produced by collisional ionization in gas that has been heated above the equilibrium value.
For photoionization models of the high ionization phase, we optimized on the Civ Voigt profile fit values, and the ionization parameter was constrained by data for other intermediate and high ionization transitions. To produce the observed Siiv absorption in this phase, is the optimal range. The cloud size would be pc, considerably larger than the Mgii cloud. If , the system would have too much Siiii and Siiv absorption relative to Civ. If , would be overproduced by the model. The metallicity of the high ionization phase is constrained, by the Ly profile, to be solar or higher. For larger values of the ionization parameter, within the constrained range of , the lower limit on metallicity would be raised to a supersolar value.
Considering collisional ionization, for km s-1, pure thermal broadening gives an upper limit on the temperature of . Below this limiting temperature, Siiv would be severely overproduced (Sutherland and Dopita, 1993) if we optimize on Civ. However, raising the temperature to (which is just consistent with the Voigt profile fit within errors) reproduces the observed . The metallicity of this collisionally ionized phase would have to be solar or greater in order that Ly would not be overproduced. Though it requires fine–tuning of the temperature, a collisionally ionized phase with solar metallicity and with provides an adequate fit to the data.
We conclude that the system has two phases, both with a metallicity solar or higher. The low–ionization phase, with km s-1, has , while the high–ionization phase, with km s-1, could be photoionized with or collisionally ionized with . The broader high–ionization phase is centered on the Mgii cloud and is consistent with a single cloud producing the Civ absorption. Constraints are summarized in Table 3. An acceptable model, including two photoionized phases, is superimposed on the data in Figure 1. Column densities of selected transitions, produced by this model, are given in Table 4.
4.2 The System
The system is detected in Ly, Ly, Mgii, Siii, Cii, Nii, Siiii, Siiv 1403, Niii, and Civ. Nv 1239 is not confirmed by a detection of Nv 1242, so it is viewed as a tentative detection. Ovi is also a likely detection, although Ovi 1038 is in a confused region of the spectrum that required an uncertain continuum fit. Limits are available for Mgi and Feii 2600 in the HIRES/Keck spectrum. All of these transitions are shown in Figure 2. In this system, the Civ is quite strong, and shows an asymmetry in both members of the doublet.
We first optimize on the and given by a Voigt profile fit to the Mgii profiles (see Table 2). Comparing to the other transitions, the ionization parameter for this Mgii cloud is constrained to be . A higher value overproduces Siiv absorption at km s-1, which is well fit for at the upper end of this range and underproduced for . (Siiv is blended with a stronger transition from another system and cannot be used as a constraint.) A value of would result in a model that exceeds the limit on Feii . If , then there would have to be a significant contribution to the Siiv absorption from another phase. Even for the maximum consistent , the Civ absorption is not fully produced in this phase, as shown by the dotted curve in Figure 2.
The cloud giving rise to the Mgii, with km s-1, would overproduce Ly in its blue wing unless it has solar or super–solar metallicity. The metallicity constraint could be slightly relaxed if magnesium is enhanced due to an –enhanced abundance pattern. On the other hand, in the red wing, the observed Ly is not exceeded by any model with . This difference between the metallicity constraints from the red and blue wings of the Ly profile is a consequence of an asymmetry in the distribution of Hi relative to the Mgii. The asymmetry in Ly, along with the need to fully produce the Civ absorption, requires an additional phase of gas.
In addition to the Mgii cloud, two more clouds are needed in order to fit the Civ profile. From a simultaneous Voigt profile fit of the Å and Å transitions, the first, centered on the velocity of the Mgii absorption, would have and km s-1. A small amount of the Civ absorption is produced in the same phase with the Mgii for , so the column density of the Civ cloud would be reduced slightly in that case. The second Civ cloud, offset by km s-1 to the red, is fit with and km s-1.
First, we consider the km s-1 Civ cloud centered on the Mgii profile. It is too narrow () for the Civ to be produced by collisional ionization. From Cloudy photoionization models, to simultaneously fit the Civ and the Nv absorption, we derive the constraint, , for this high ionization phase. If so, little Siiv arises in this phase, which implies that Siiv absorption should be produced in the low ionization phase with the Mgii. Revisiting the constraints for the Mgii cloud, we now find the constraint for the low ionization cloud, at the upper end of the previous constrained range discussed above. The metallicity of the high ionization gas that produces the Civ absorption must be high enough not to overproduce Ly in its blue wing. In conjunction with a solar metallicity Mgii cloud phase, this yields a solar metallicity for this Civ phase as well.
Next, we consider the km s-1 Civ cloud, offset by km s-1 from the Mgii cloud, that fills in the red wing of the Civ profile. The km s-1 Civ cloud, at km s-1, can be fit with a simple, single–cloud photoionization model with . This ionization parameter produces a consistent fit of the Ovi, Nv, and Civ, without overproducing the Siiv. The Siiii and Siiv data are very slightly underproduced by the model at this velocity, suggesting that a small ( dex) abundance pattern enhancement of silicon might be needed. A simple model with the minimum number of phases would call for the asymmetry in the Ly profile to be produced in this cloud along with the red wing of the Civ. The metallicity is thus constrained to be at the solar value in order to fit the red wing of the Ly line.
Our philosophy of fitting with the minimum number of phases argues against collisional ionization as the mechanism for producing the observed Civ absorption at km s-1. To be consistent with this philosophy, both Civ and Ly should arise in the same phase. The limit on for this component with km s-1 is consistent with production of Civ absorption by collisional ionization. However, for the maximum permitted there would not be enough Hi absorption in this model component unless the metallicity was well over supersolar. With the relatively low needed to produce the much Hi absorption, Siiv absorption would be overproduced.
We conclude that the system must have solar metallicity or higher in its low–ionization phase. The km s-1 cloud that produces Mgii absorption must be of a relatively high ionization state, with . The range of derived cloud sizes for this constrained range is – pc. Two higher ionization, broader clouds are also required: one, with km s-1, is centered on the Mgii cloud, while the other km s-1 cloud is offset by km s-1. Both are consistent with photoionization with , and have sizes of – kpc. Ranges of acceptable model parameters are presented in Table 3 and model column densities contributed by the three clouds for an adequate model are listed in Table 4. The predictions for this same model are superimposed on the data in Figure 2.
4.3 The System
The Civ profile for this newly discovered system has a complex structure and the Mgii is extremely weak and narrow. The Civ profile requires at least a three component fit. The Ly is not symmetric about the Mgii, but it is approximately symmetric about the Civ. These profiles as well as those of the other detected transitions, Siii, Cii, Siiv, are displayed in Figure 3, along with the region of the spectrum that provides a limit on Feii 2600. Nv is in a noisy region of the spectrum. If the detected feature is really Nv, it is present only in the redward component, at km s-1.
We begin by considering the Mgii cloud. Since the Feii 2600 spectrum is noisy, the low ionization parameter constraint on is not strong; for , is relatively constant. However, assuming solar abundance pattern, provides a marginally better fit to the Siii and Cii. If , then the depth of the Siiv and Civ absorption at km s-1 can be reproduced in the Mgii cloud, but the model profile is too narrow and does not provide a good fit to the data. A separate higher ionization phase is needed to fit these higher ionization transitions. Considering all transitions, and assuming solar abundance pattern, is favored for the Mgii cloud.
The metallicity of the Mgii cloud would be if all of the Ly in the red wing were to arise in this cloud. However, it could also be significantly higher if there were Ly contribution from the Civ clouds. For and , the Mgii cloud size ranges from pc to kpc. Sizes scale with so that clouds would be a factor of smaller than clouds.
Consider the case of for the Mgii cloud. Three more clouds are required to fit Civ. The column densities and Doppler parameters for these three clouds were obtained with a Voigt profile fit. This fit is not unique because clouds cannot be well separated due to blending, so there are no errorbars listed in Table 2. The cloud centered on the Mgii was fit with , km s-1. The other two clouds, at km s-1 and km s-1, were fit with , km s-1, and , km s-1, respectively.
For photoionization models, the ionization parameters for these three Civ clouds are constrained by the requirement that they produce the observed Siiv without producing significant lower ionization transitions. The km s-1 Civ cloud, centered on the Mgii cloud, is tightly constrained to have , by the Siiv profiles. The range already takes into account the fact that the Mgii cloud would make a small contribution to Siiv if its . The lower limit on of the Civ cloud arises in order that the Mgii is not overproduced in its wings by this relatively broad component. The upper limit applies in order to produce sufficient Siiv absorption.
The km s-1 Civ cloud at km s-1, has , in order to produce the optimal fit to Siiv, Cii, and Civ. For , Nv is overproduced, and for , Cii, Siii, and Mgii are overproduced.
For the km s-1 Civ cloud at km s-1, provides an optimal fit to the Siiv, and is consistent with Cii and with the limit on Nv. A value of is only marginally consistent, with the model slightly underproducing the Siiv. This inferred properties of this cloud are independent of the Mgii cloud since no Mgii is detected at this velocity.
As with the Mgii cloud, the metallicities of the three additional Civ clouds cannot be extremely low. Only or higher is consistent with the data. If the red side of the Ly is to be produced by the km s-1 Civ cloud, would apply for this cloud. Similarly, for the km s-1 Civ cloud would match the blue wing of Ly. In the case of the blue wing, the Ly could in principle be produced in a Mgii cloud and the metallicity of the Civ cloud could be higher. Constraints on the metallicities of these clouds, relative to the cloud that produced the narrower Mgii profile, are limited by the lack of coverage of higher order Lyman series lines. However, the data are consistent with in the Mgii cloud and in the three Civ clouds. For this metallicity, the sizes of the three Civ clouds would be – kpc.
We also consider whether collisionally ionized gas can be consistent with the observed profiles of Civ, Siiv, and Ly. For the km s-1 Civ cloud, does not overproduce Siiv, and is consistent with producing the blue side of the Ly profile for . If the metallicity is higher, a higher ionization parameter is needed to fit the Ly line, but in this case the model Ly profile shape is not consistent with the data. The km s-1 cloud is too narrow to be consistent with production of Civ absorption through collisional ionization assuming the particular Voigt profile fit that we have adopted. However, because this fit is not unique, there could possibly be a broader cloud component that could be reconciled with collisional ionization. Finally, the km s-1 Civ cloud could be collisionally ionized with and , in which case it would match the red side of the Ly profile.
In summary, the system Mgii profile is quite weak and narrow. However, the Civ profile can be fit with several components spread in velocity over km s-1. The three components are similar to each other, having km s-1 and ranging from to if they are photoionized. Collisional ionization with temperatures of could be consistent with the data, but requires fine–tuning of the temperature and seems less likely. The bluest Civ component has the Mgii detected at the same velocity, but in a narrower component ( km s-1) produced in gas with a somewhat lower ionization parameter (). The Civ clouds have a metallicity of at least and must be at least a couple of kiloparsecs in size.
5 Caveats
5.1 Abundance Pattern Variations
Abundance ratios measured in Galactic stars show a clear range of (Lauroesch et al., 1996). In our presentation of model results (§ 4) solar abundance pattern was assumed unless the data require an alternative pattern. However, it should be noted that the inferred metallicity depends directly on the assumed abundance pattern. If, instead of solar, the abundance pattern is –group enhanced with , the inferred metallicity of a phase constrained by (an –group element) would proportionally drop by dex. Constraints on the ionization parameter, , are also affected by changes in the assumed abundance pattern. For example, if the the abundance pattern is –group enhanced, the ratio would constrain to be larger than if the abundance pattern is solar. However, for , the change in the constraint on (and therefore on ) is less than dex. We have used the relative absorption strengths in several other transitions to determine , but dex is typical of the level of uncertainty due to variations in abundance pattern.
5.2 Effects of Spectral Shape
Based on results for other similar absorption line systems, there is likely to be no bright galaxy associated with these single–cloud weak Mgii absorbers (Rigby et al., 2002). Therefore, we used the Haardt and Madau (1996) extragalactic background spectrum for in our detailed models presented above (§ 4). However, because it is not strictly excluded, we do consider here the effect of changing the spectral shape.
Two alternative galaxy spectra, Gyr and Gyr instantaneous starburst models, were superimposed on the Haardt and Madau extragalactic background spectrum. Both models, with solar metallicity and a Salpeter IMF were taken from Bruzual and Charlot (1993). The normalizations of the starburst spectra are defined relative to the Haardt and Madau spectrum at Rydberg, and in all cases the extragalactic and galactic contributions were superimposed. The largest reasonable value for the photon flux from even the most extreme starburst galaxy is , and of order % of the photons escape (Hurwitz, Jelinsky, and Dixon, 1997). Using these numbers, to have a flux ten times that of Haardt and Madau at , the absorber would have to be within kpc of the starburst. Within this distance, we would expect stronger absorption than observed in these weak Mgii absorbers. Therefore, we consider it most likely that the Haardt and Madau spectral shape is the appropriate assumption. Nonetheless, in this section, we briefly examine the consequences of the alternatives. We consider the effect of spectral shape on the metallicity of the low ionization phase, on whether the Civ absorption can arise from the same phase as the Mgii absorption, and on the ionization conditions of the high ionization phase.
The largest impact on the metallicity would be from an ionizing spectrum with a large feature at the Lyman edge, such as the Bruzual and Charlot Gyr instantaneous burst model. In this case, the cloud would be more neutral so that not as much Hydrogen would be required to fit the Ly profile. In such a case, the metallicity would be even higher than we inferred assuming a pure Haardt and Madau spectrum. In general, we found that the starburst spectrum normalization needed to be at least ten times that of the Haardt and Madau spectrum in order to detect a difference in the models. Even with a normalization of twenty–five the difference in the inferred metallicity is less than dex. Most importantly, even if the spectrum of ionizing radiation has a substantial Lyman edge, the metallicity of the weak Mgii clouds would be even higher than the solar value — an even more surprising result.
A Gyr instantaneous burst model, if it dominates over the Haardt and Madau spectrum by a factor of twenty–five, can make significantly more Civ relative to Mgii. However, only the column density can be made consistent with the observed Civ profiles in the three systems studied here. The Doppler parameters of these lines are still too large for them to be produced in the same phase with the Mgii.
A spectrum with a sharp Hei edge will have the largest effect on the inferred of a photoionized high ionization phase. A Gyr starburst model is extreme in this respect, yet it takes a normalization of ten times Haardt and Madau to see even a small change. With a normalization of twenty–five, the Siiv is significantly overproduced relative to Civ for the same . However, the qualitative result of a relatively low density phase producing the bulk of the Civ is unchanged. For example, for the system, must be increased from to in order that Siiv is not overproduced.
We conclude, that at an extreme starburst spectrum would have to dominate in order to affect the conclusions of our models. Even if such conditions prevailed, the conclusions would be qualitatively unchanged, only changing constraints by dex in parameter spaces ranging over a few orders of magnitude.
6 Discussion
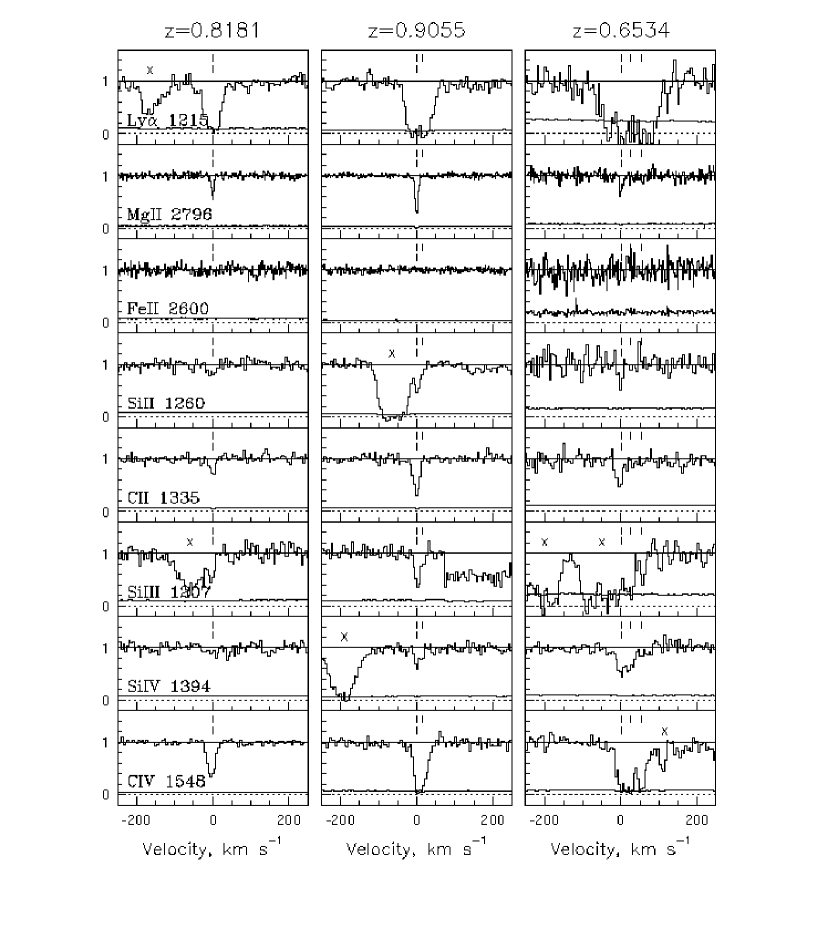
This study of the multiple phases of gas and the physical conditions of the three weak Mgii systems along the PG line of sight indicates a heterogeneous population of objects selected by a weak Mgii doublet. Figure 4 is a comparison between the three systems showing the range of Civ equivalent widths and kinematic structures, ranging from a profile consistent with a single cloud for the system, to the stronger asymmetric profile for the system, to the multiple component profile for the system. The Ly profile strength does not systematically increase in proportion with the Mgii absorption. It could, however, be increasing with the kinematic spread of the Civ. Table 3 gives a summary of the range of “acceptable models” for each of the three systems, while Table 4 gives more detailed information about a sample model that is within the acceptable range. That typical model was also superimposed on the data in Figures 1–3.
6.1 Comparisons of the Three Systems
The system and the system provide contrasting examples of a weak Mgii absorber that clearly requires a separate broad phase to fit a strong Civ profile and one with much weaker Civ, not even detected in the previous low resolution FOS spectrum (Churchill et al., 2000a). For both systems, in the present study we find that a separate broader phase ( km s-1 and km s-1), with an ionization parameter , is needed to fit the observed Civ STIS profile. This phase is centered at the same velocity as the phase that gives rise to the weak Mgii absorption. However, in the system there is an asymmetry to the Civ profile that indicates an additional offset component, km s-1 redward of the Mgii cloud and the first Civ broad phase. The Civ profile can be fit with a two cloud model, though it is also possible that there is a more complex distribution of material, spread over a range of velocities, that gives rise to such an asymmetric profile shape. A general point is suggested by the comparison of the and systems. The strong Civ absorption that is observed in many weak Mgii absorbers (Rigby et al., 2002) could be due to the presence of separate clouds that are of higher ionization and do not give rise to detectable Mgii absorption. The same would apply for the stronger Ly absorption apparent in some weak Mgii absorbers.
The system is a more extreme example in which three separate components are clearly apparent in the Civ profile. A narrow, weak Mgii absorber is centered on one of the higher ionization Civ clouds. The separate Civ components at km s-1 and km s-1 are quite distinct from the Civ centered on the Mgii cloud. Like the higher ionization components of the other two systems, these two offset clouds have ionization parameters, . The Ly profile is consistent with being centered around the three Civ component, but not around the Mgii cloud. The fact that Ly absorption is strongest in this system suggests that the spread in velocity of absorbing gas along the line of sight is an important factor in determining the equivalent width of Ly absorption.
The metallicities of the and systems are constrained to be at least as high as solar. The system is likely to have a metallicity of at least th solar. These relatively high metallicities appear to be common for weak Mgii absorbers. Rigby et al. (2001) inferred a high metallicity for several systems based upon low resolution FOS data, and in no case did they find that a metallicity less than th solar was required.
6.2 Comparison to Model Results Based on Low Resolution Data
For the system and the system, we can compare the results from this study, incorporating high resolution STIS data, to our previous models, based upon the lower resolution FOS data (Charlton et al., 2000).
For the system, Ly was not covered in the earlier FOS spectrum, so no constraints on metallicity were available. The Civ was not detected in the FOS spectrum, but we showed that it might be detected in the higher resolution STIS spectrum either from a Mgii cloud with a high ionization parameter or from a broader, separate phase. No specific predictions could be made as to which possibility was more likely. Now, with the high resolution STIS spectrum coverage of Civ we are able to place specific constraints as was outlined in § 4.1.
For the system the main conclusions of our previous study, based on the FOS spectrum (Charlton et al., 2000), were that the Civ is present in a separate broader phase, and that the metallicity of the Mgii cloud is solar or higher. These conclusions are confirmed by the present study. The detailed properties of the broader phase were more difficult to determine based upon low resolution spectra. We suggested that the broad phase has km s-1 because the doublet ratio of the Civ was large compared to observations, if km s-1 was assumed. The high resolution STIS spectrum shows that the Civ profile is asymmetric, so that it must be composed of at least two separate “clouds”, the broadest having km s-1. The “wings” of the Ly profile in the low resolution spectrum were apparently due to FOS fixed pattern noise rather than to an extremely broad phase, since these features are not apparent in the high resolution STIS spectrum.
From this very limited comparison we tentatively conclude that it should be possible to draw inferences about the presence of a separate Civ phase based on a combination of high and low resolution spectra, i.e. drawing on the large existing FOS database. Also, our conclusion of solar metallicity for the system was confirmed by modeling of the high resolution STIS profile of Ly. This is important, since modeling of FOS data was used to infer that many weak Mgii absorbers have close to solar metallicity (Rigby et al., 2002).
6.3 Relationships Between Phases
To understand the nature of these systems, we seek to infer the spatial distribution of absorbing material, and the relationship to star–forming objects. All three single–cloud weak Mgii absorbers have two phases that produce a narrower (– km s-1) and a broader (– km s-1) absorption component centered at the same velocity. The narrower component is of lower ionization than the broader component. For a fixed Haardt–Madau spectrum intensity, this implies a higher density (– cm-3) for the narrower component, and also a smaller size, – pc. The broader component would arise in a higher ionization/lower density phase ( cm-3) with a larger size (– kpc).
Two simple scenarios could be consistent with the inferred properties of the narrow and broad components: 1) The first would have the lower ionization region embedded within the higher ionization region, and the higher ionization region would present a larger cross section. We would then expect many systems to be observed for lines of sight that pass through only the higher ionization region of such structures. These “Civ–only systems” might typically have lower Civ column densities than two–phase weak Mgii systems. They would be produced at large impact parameter in the structure, at which the pathlength would be shorter and the gas densities would be lower. 2) In the second scenario the lower ionization components could be produced by parts of a shell structure surrounding a lower density, higher ionization region. The covering factors for the low ionization shell fragments would be limited () by the lack of observation of many two–cloud weak Mgii systems. However, with such a small covering factor, we would again expect a large incidence of “Civ–only systems” which in this scenario would tend to have similar Civ phases to those of two–phase weak Mgii systems.
We searched the PG spectra and found no “Civ–only systems” with Civ comparable in strength even to that of the weak Mgii absorber. However, we have identified several weaker candidate Civ doublets at , confirmed by a line detected at the expected position of Ly. Many other lines of sight need to be systematically surveyed, but there clearly will be limits on the geometry and covering factors of the two phases of gas.
An alternative to the idea of embedded phases is to have separate clouds along the line of sight with different densities and sizes. This is consistent with the presence of an offset cloud in the system, and the spread of three clouds over km s-1 in the system. These separate clouds could exist as condensations in larger structures with velocity dispersions of tens of km s-1, e.g., dwarf galaxies. However, if the phases were all completely separate from each other then it would be hard to explain the close alignment in velocity of the lower ionization cloud with one of the higher ionization clouds.
The metallicities of these absorbing structures present a clue as to their place of origin. We do not expect that they are in the vicinity of luminous galaxies ( galaxies are not found within impact parameters of kpc from the quasar). Although no useful image is available for the PG field in particular, other single–cloud weak Mgii absorbers are rarely found near such luminous galaxies (C. Steidel, private communication; Rigby et al. (2002)). Dwarf galaxies have metallicities significantly lower than solar, which would appear inconsistent with solar metallicities for single–cloud weak Mgii absorbers. However, it is possible that the weak Mgii absorbers are concentrations of higher metallicity within lower metallicity structures.
Most strong Mgii absorbers ( Å) also require a phase in addition to the Mgii clouds in order to produce the observed Civ absorption. These absorbers are associated with galaxies (Bergeron and Boissé, 1991; Steidel, Dickinson, and Persson, 1994; Steidel, 1995), and the high–ionization phase is inferred to have an “effective Doppler parameter” or velocity spread of km s-1 (Churchill et al., 2000b). At high resolution some of the Civ profiles will separate into multiple components, while others may be due to a more uniform distribution of gas (Ding et al., 2003, 2002; Zonak et al., 2002). The Civ phase of some strong Mgii absorbers is reminiscent of what would be expected for a corona such as that observed in Civ and Ovi absorption around the Milky Way disk. The single cloud weak Mgii absorbers, although they do have a second phase, do not appear to be related to such a corona.
7 Conclusions
The combination of STIS/HST and HIRES/Keck high resolution spectra, covering multiple chemical transitions, provided the first opportunity to collect direct information on the metallicities and phase structure of weak Mgii absorbers. There are three weak Mgii absorbers, at , , and along the line of sight toward the quasar PG . All three of these absorbers have a second, higher ionization phase, giving rise to the Civ absorption. The broad phase in one case is consistent with a single cloud, and in the other two cases requires one or two additional clouds separated in velocity space from the one aligned with the Mgii absorption.
Two of the weak Mgii absorbers are constrained to have solar or greater than solar metallicity, and the other one to have a metallicity greater than th solar. Thus, in general, weak Mgii absorbers are not weak because of a low metallicity (confirming the result of Rigby et al. (2002)). As introduced in § 1, it is also possible that they have weak Mgii absorption because they are more highly ionized than their strong counterparts, or because their total column densities are smaller. The likely answer is that there is some combination of these two effects, perhaps leading to different populations of weak absorbers arising in different environments. The ionization parameters of the absorbers studied here are higher than inferred for many of the clouds in strong Mgii absorbers for which Feii is also detected. [Feii is a tracer of low ionization conditions (Churchill et al., 1999; Rigby et al., 2002).] However, there is also a population of weak Mgii absorbers with strong Feii lines, amounting to about one–third of the weak Mgii absorber population (Rigby et al., 2002). Detailed study of the phase structure of this sub–group awaits spectra of additional quasar lines of sight with Civ, Ly and other transitions covered at high resolution.
Weak Mgii absorbers are potentially of general importance because they provide a sensitive probe of particular types of star forming environments. In principle, this population of objects can be used to track the chemical and ionization history of the universe in regions that are not in luminous galaxies which can be studied by other methods. For example, do they exist with solar metallicity to high redshifts, i.e. are there selected environments with extreme enrichment even at early times? Answering this question will require a large systematic study of many weak Mgii systems over a range of redshifts. Such a study could address whether there is always Civ absorption centered in velocity on a Mgii cloud. It could tabulate the distribution of Civ clouds in velocity space, and address whether a large Civ equivalent width is typically due to the presence of multiple clouds along the line of sight. Spectral coverage of Nv and Ovi will also provide better constraints on the ionization conditions of the high–ionization phase. Finally, it is highly desirable to search the quasar fields for faint galaxies that could be related to these weak Mgii absorbers.
References
- Bergeron and Boissé (1991) Bergeron, J., & Boissé, P. 1991, A&A, 243, 344
- Bruzual and Charlot (1993) Bruzual, A. G., & Charlot, S. 1993, ApJ, 405, 538
- Charlton et al. (2000) Charlton, J. C., Mellon, R. R., Rigby, J. R., & Churchill, C. W. 2000, ApJ, 545, 635
- Churchill (1997) Churchill, C. W. 1997, Ph.D. Thesis, University of California, Santa Cruz
- Churchill and Charlton (1999) Churchill, C. W., & Charlton, J. C. 1999, AJ, 118, 59
- Churchill et al. (2000a) Churchill, C. W., Mellon, R. R., Charlton, J. C., Jannuzi, B. T., Kirhakos, S., Steidel, C. C., & Schneider, D. P. 2000a, ApJS, 130, 91
- Churchill et al. (2000b) Churchill, C. W., Mellon, R. R., Charlton, J. C., Jannuzi, B. T., Kirhakos, S., Steidel, C. C., & Schneider, D. P. 2000, ApJ, 543, 577
- Churchill et al. (1999) Churchill, C. W., Rigby, J. R., Charlton, J. C., & Vogt, S. S. 1999, ApJS, 120, 51
- Churchill and Vogt (2001) Churchill, C. W. & Vogt, S. S. 2001, AJ, 122, 679
- Churchill, Vogt, and Charlton (2003) Churchill, C. W., Vogt, S. S., & Charlton, J. C. 2003, ApJ, in press
- Ding et al. (2002) Ding, J., Charlton, J. C., Zonak, S. G., & Churchill, C. W. 2002, ApJ, submitted
- Ding et al. (2003) Ding, J., Charlton, J. C., Churchill, C. W., & Palma, C. 2003, ApJ, in preparation
- Ferland (1996) Ferland, G. J. 1996, Hazy, University of Kentucky Internal Report
- Haardt and Madau (1996) Haardt, F., and Madau, P. 1996, ApJ, 461, 20
- Hurwitz, Jelinsky, and Dixon (1997) Hurwitz, M., Jelinsky, P., & Dixon, W. V. D. 1997, ApJ, 481, L31
- Lauroesch et al. (1996) Lauroesch, J. T., Truran, J. W., Welty, D. E., and York, D. G. 1996, PASP, 108, 641
- Rigby et al. (2002) Rigby, J. R., Charlton, J. C., & Churchill, C. W. 2002, ApJ, 565, 743
- Steidel (1995) Steidel, C. C. 1995, in QSO Absorption Lines, ed. G. Meylan (Garching: Springer–Verlag), 139
- Steidel, Dickinson, and Persson (1994) Steidel, C. C., Dickinson, M. & Persson, E. 1994, ApJ, 437, L75
- Sutherland and Dopita (1993) Sutherland, R.S., & Dopita, M.A., 1993, ApJS, 88, 253
- Vogt et al. (1994) Vogt, S. S., et al. 1994, in Proceedings of the SPIE, 2128, 326
- Zonak et al. (2002) Zonak, S. G., Charlton, J. C., Ding, J., Churchill, C. W., & Palma, C. 2002, ApJ, submitted
| Transition | |||
|---|---|---|---|
| Ly | |||
| Ly | |||
| Mgi 2853 | |||
| Mgii 2796 | |||
| Mgii 2803 | |||
| Feii 2600 | |||
| Siii 1193 | |||
| Siii 1260 | |||
| Cii 1335 | |||
| Nii 1084 | |||
| Siiii 1207 | |||
| Siiv 1394 | |||
| Siiv 1403 | |||
| Niii 989 | |||
| Civ 1548 | |||
| Civ 1551 | |||
| Nv 1239 | |||
| Nv 1243 | |||
| Ovi 1032 |
Note. — Limits are at a level. The symbol indicates that the transition was not covered, or that it was so severely blended with a stronger transition that the limit is not useful.
| Transition | [km s-1] | [km s-1] | |
|---|---|---|---|
| System | |||
| Mgii | |||
| Cii | |||
| Siiii | |||
| Siiv | |||
| Civ | |||
| System | |||
| Mgii | |||
| Cii | |||
| Siiii | |||
| Siiv | |||
| Civ | |||
| System | |||
| Mgii | |||
| Civ | |||
Note. — Velocities are offsets from the Mgii cloud. For the resonant doublet transitions, the Voigt profile fits were generally constrained by both members, however, Siiv for the system was measured from just the 1403 Å transition. Unique Voigt profile fits could not be obtained for the system because of blending. The three cloud fit given for Civ provides an adequate fit to the doublet, assuming that one component is centered on the Mgii cloud.
| km s-1 | Size (kpc) | (km s-1) | ||||
|---|---|---|---|---|---|---|
| 0.8182 | to | to | to | |||
| to | to | to | ||||
| 0.9056 | to | to | ||||
| to | to | to | ||||
| to | to | to | ||||
| 0.6534 | to | to | to | to | ||
| to | to | to | to | |||
| to | to | to | to | |||
| to | to | to | to |
Note. — This table is intended to be a concise summary of results for the four systems. The models that it presents are consistent with the HIRES/Keck and STIS/HST data; they are indicative but not unique. Abundance patterns were assume to be solar, but this is not a unique solution, i.e. a different abundance pattern is possible for different choices of the other parameters. Doppler parameters are listed for Mgii in the case of the low ionization Mgii cloud components (first entries for each system), and for Civ for all other components.
| size | ||||||||||||||
|---|---|---|---|---|---|---|---|---|---|---|---|---|---|---|
| [km s-1] | [] | [cm-3] | [pc] | [K] | [cm-2] | [cm-2] | [cm-2] | [cm-2] | [cm-2] | [km s-1] | [km s-1] | [km s-1] | ||
| System | ||||||||||||||
| Mgii1 | ||||||||||||||
| Civ1 | ||||||||||||||
| System | ||||||||||||||
| Mgii1 | ||||||||||||||
| Civ1 | ||||||||||||||
| Civ2 | ||||||||||||||
| System | ||||||||||||||
| Mgii1 | ||||||||||||||
| Civ1 | ||||||||||||||
| Civ2 | ||||||||||||||
| Civ3 | ||||||||||||||
Note. — Column densities are listed in logarithmic units.