Highly extinguished emission line outflows in the young radio source PKS 1345+12
Abstract
We present new, intermediate resolution spectra ( 4 Å) of the compact radio source PKS 1345+12 (4C 12.50, z = 0.122) with large spectral coverage ( 4500 Å). Our spectra clearly show extended line emission up to 20 kpc from the nucleus. This is consistent with the asymmetric halo of diffuse emission observed in optical and infra-red images. At the position of the nucleus we observe complex emission line profiles. Gaussian fits to the [O III] emission lines require 3 components (narrow, intermediate and broad), the broadest of which has FWHM 2000 km s-1 and is blue shifted by up to 2000 km s-1 with respect to the halo of the galaxy and HI absorption. We interpret this as material in outflow. We find evidence for high reddening and measure E(B-V) 0.92 for the broadest, most kinematically disturbed component. This corresponds to an actual H flux 130 times brighter than that observed. From our model for [S II]6716,6731 we estimate electron densities of ne 150 cm-3, ne 5300 cm-3 and ne 4200 cm-3 for the regions emitting the narrow, intermediate and broad components respectively. We calculate a total mass of line emitting gas of Mgas 106 M⊙. Not all emission line profiles can be reproduced by the same model with [O I]6300,6363 and [S II]6716,6731 requiring separate, unique models. We argue that PKS 1345+12 is a young radio source whose nuclear regions are enshrouded in a dense cocoon of gas and dust. The radio jets are expanding through this cocoon, sweeping material out of the nuclear regions. Emission originates from three kinematically distinct regions though gradients (e.g. in density, ionisation potential, acceleration etc) must exist across the regions responsible for the emission of the intermediate and broad components.
keywords:
ISM: jets and outflows - ISM: kinematics and dynamics - galaxies: active - galaxies: ISM - galaxies: kinematics and dynamics - galaxies: individual: PKS 1345+12 (4C12.50)1 Introduction
| Date | Arm | Exposure | Setup | Slit PA | Slit width | Seeing | Conditions |
|---|---|---|---|---|---|---|---|
| (s) | (CCD + grating) | (arcsec) | (arcsec) | ||||
| 20010512 | R | 1*900 | TEK4 + R316R | 104 | 1.3 | 1.32 0.16 | Photometric |
| 20010512 | B | 1*900 | EEV12 + R300B | 104 | 1.3 | 1.32 0.16 | Photometric |
| 20010512 | R | 3*1200 | TEK4 + R316R | 160 | 1.3 | 1.32 0.16 | Photometric |
| 20010512 | B | 3*1200 | EEV12 + R300B | 160 | 1.3 | 1.32 0.16 | Photometric |
| 20010514 | R | 3*1200 | TEK4 + R316R | 230 | 1.3 | 1.67 0.12 | Variable transparency |
| 20010514 | B | 3*1200 | EEV12 + R300B | 230 | 1.3 | 1.67 0.12 | Variable transparency |
Gigahertz Peaked Spectrum radio sources (GPS: D 1 kpc) and the more extended Compact Steep Spectrum radio sources (CSS: D 15 kpc) make up a significant fraction ( 40%) of the radio source population, but their nature is not fully understood (see e.g. \pciteodea98 and references therein). Are these compact radio sources linked to the large scale radio galaxies by some evolutionary sequence, or are they indeed a separate class of object?
There are two main theories to describe compact radio sources: the frustration scenario [\citefmtvan Breugel1984] and the youth scenario [\citefmtFanti et al.1995]. In the frustration scenario, the radio source is enshrouded by a cocoon of gas and dust so dense that the radio jets cannot escape the nuclear regions and the radio source is confined and frustrated for its entire lifetime. Alternatively, the youth scenario attributes compactness of the radio source to evolutionary stage – if we observe a radio source when it is relatively young, the radio jets will not have had the time to expand much and will still be relatively small. In this scenario, the GPS and CSS sources represent the earliest stages in the evolution of radio galaxies, eventually expanding into the large scale doubles. This is currently the preferred theory and is supported by estimates of dynamical ages of GPS sources of tdyn 102 - 103 years (e.g. \pciteowsianik98; \pcitetschager00) and radio spectral ages of the larger CSS sources of tsp 104 years [\citefmtMurgia et al.1999]. It has also been suggested that the host galaxies pass through multiple, short-lived (trs 104 years) activity phases responsible for the extended, diffuse emission commonly found around GPS sources (\pcitereadhead94; \pcitereadhead96), although there are no strong arguments either for or against this theory [\citefmtO’Dea1998].
There is much evidence to suggest that, in a significant fraction of the radio source population, the radio sources are triggered by merger events involving two or more galaxies, of which at least one is gas rich [\citefmtHeckman et al.1986]. Many compact radio sources exhibit features attributed to mergers such as double nuclei, tidal tails, arcs of emission and distorted isophotes, suggesting that these sources are possibly observed relatively shortly after a merger event [\citefmtStanghellini et al.1993], before the system has recovered and settled down. However, alternative activity triggering mechanisms have been suggested such as intracluster cooling flows [\citefmtBremer, Fabian & Crawford1997]. Whilst mergers may be the most likely trigger of the activity, it is clear that all activity inducing processes involve the injection of substantial amounts of gas and dust into the nuclear regions – initially, at least, the radio source will exist in a dense and dusty environment. Subsequent evolution will be strongly dependent on both the quantity and distribution of the circumnuclear material. If the ISM forms an equatorial disk, the radio jets will undergo little interaction with the ISM. On the other hand, if the ISM forms an enshrouding cocoon, strong interactions are expected between the ISM and the radio jets [\citefmtBicknell & Dopita1997], quasar-induced winds [\citefmtBalsara & Krolick1993] or any starburst-driven superwinds [\citefmtHeckman, Armus & Miley1990] in the early stages of radio source evolution. Indeed, depending on the amount of material in the cocoon, it may be necessary to hollow out bi-polar cavities in the cocoon in order to allow the radio source to expand freely through the halo of the host galaxy. Therefore, it seems likely that outflows of the ISM will be important in the early stages of radio source evolution.
Much of the work on compact radio sources has concentrated on the radio wavelength region, but relatively little attention has been paid to other wavebands. High quality optical spectra have the potential to provide important clues on the nature of compact radio sources and their early evolution. However, to date, most spectroscopic studies have relied on poor quality, low resolution data (e.g. \pcitegelderman94). Recently, the promise of optical spectroscopic studies was demonstrated by observations of the compact, flat spectrum radio source PKS 1549-79 [\citefmtTadhunter et al.2001]. Low dispersion spectra of this radio source revealed broad forbidden line profiles (FWHM 1350 km s-1) blue-shifted by 600 km s-1 with respect to the galaxy rest frame, believed to trace material in outflow. Combined with its compactness, \scitetadhunter01 suggest PKS 1549-79 is a young radio galaxy whose radio jets, aligned close to the line of sight, are sweeping material out of the nuclear regions.
In this paper we present new, high quality observations of the GPS source PKS 1345+12, taken with ISIS, the dual-arm spectrograph on the 4.2m William Herschel Telescope (WHT) on La Palma. The high quality of the data for this source allows us to investigate the putative circum-nuclear outflows in greater depth than was possible for PKS 1549-79. The preliminary results of this study were reported in \sciteholt02. ISIS is ideal for studies of this type as it allows spectra to be taken with intermediate resolution without compromising the spectral range. By using a dichroic, the red and blue regions of the spectrum were imaged simultaneously with CCDs optimised for each range. We investigate the kinematics of the emission line gas in the nucleus with respect to the galaxy halo to search for outflows – a possible impact of the nuclear activity on the ambient ISM. We also investigate the physical properties in the nuclear regions (e.g. density, gas mass) and outline a model for compact radio sources using PKS 1345+12 as an example of a radio source in the early stages of radio source evolution.
2 Previous observations of PKS 1345+12

The bright, compact radio source PKS 1345+12 is optically identified with a 17th magnitude elliptical galaxy (e.g. \pciteclarke66; \pciteburbidge70; \pcitegilmore86). PKS 1345+12 has two nuclei separated by 1.8 arcsec or 4.3 kpc111H0 = 75 km s-1, = 0.0 assumed throughout, resulting in a scale of 2.37 kpc arcsec-1 at = 0.122.. The western nucleus has a Seyfert 2/NLRG type spectrum [\citefmtGilmore & Shaw1986]. The optical identification of the radio source is controversial but the latest astrometry by \scitestanghellini93 associates the radio source with the western, highly reddened nucleus (\pciteevans99, \pcitesmith89, \pcitestanghellini93).
Both nuclei are surrounded by an extended, asymmetric halo detected in optical (\pciteheckman86; \pcitegilmore86) and near infra-red [\citefmtEvans et al.1999] images. There is clear evidence for extended, distorted morphology including a strongly curved tidal tail terminating 25 arcsec ( 59 kpc) NW of the nucleus (\pciteheckman86, \pcitesmith89). \scitegilmore86 estimate a projected linear size of 110 kpc (where is the Hubble constant with units of 100 km s1 Mpc-1).
There is much evidence to suggest that the nuclear regions of PKS 1345+12 contain large amounts of gas and dust. Deep, multiple component HI 21cm absorption over a velocity range 700 km s-1 with column density NHI/Tspin = 6.1 1018 atoms cm-2 has been detected by \scitemirabel89 and more recently over a velocity range 1000 km s-1 by \scitemorganti02. The same velocity components are also detected in CO (10) emission (\pcitemirabel89b, \pciteevans99) and the shared CO halo indicates the galaxy is rich in highly concentrated dust and molecular gas (3.3 1010 M⊙; 2000 M⊙ pc-3; \pciteevans99).
Both the distorted optical morphology and the presence of a rich ISM suggest that PKS 1345+12 has been involved in a merger of two galaxies in its recent history (\pcitegilmore86, \pciteheckman86). At least one of the galaxies must have been gas rich (\pcitestanghellini93, \pcitegilmore86). Indeed, the close proximity of the two nuclei may indicate that the merger event began so recently that it may still be ongoing (\pcitegilmore86, \pciteheckman86, \pcitehutchings87, \pcitebaum88, \pciteevans99). PKS 1345+12 also has a significant young stellar population (Robinson et al. 2003, in preparation) which may be the result of a merger induced starburst. Further evidence for the prodigious star formation in PKS 1345+12 is provided by the detection of a substantial far-IR excess (LIR = 1.7 1012 L⊙, \pciteevans99) which leads to the classification of this source as an ultra luminous infra-red galaxy (ULIRG).
The main radio source associated with PKS 1345+12 is confined to a region 0.15 arcsec ( 350 pc) in size coincident with the western nucleus (\pcitestanghellini93, \pcitestanghellini97). PKS 1345+12 has a typical GPS radio spectrum, peaking at 0.6 GHz with spectral index222S assumed throughout. -0.7 and +0.9 above and below the peak respectively [\citefmtStanghellini et al.1998] and a sharp spectral cut-off near 400 MHz [\citefmtLister, Kellermann & Pauliny-Toth2002a].
PKS 1345+12 has distorted, ‘triple’ radio morphology (i.e. a core and two jets are visible) aligned along PA 160 with a jet extending 0.04 arcsec (95 pc) to the SE before bending and expanding into a diffuse lobe. Weak radio emission is detected up to 0.03 arcsec (70 pc) NW of the bright knot towards the northen limit of the jet, tentatively identified as the core (\pcitestanghellini97). \scitestanghellini01 also report very weak, extended emission on arc-second scales at 1.4 GHz resembling the parsec scale morphology. Such extended weak emission may indicate PKS 1345+12 has experienced other activity phases in the past (e.g. Stanghellini et al. 2002, private communication).
The radio morphology of PKS 1345+12 resembles only a few GPS sources (see samples listed in \pciteodea98), though this may be a redshift issue – PKS 1345+12 is one of the closest GPS sources (z = 0.122) whilst most are at much higher redshift (z 0.5). The S-shaped jet morphology is only detected in 5-10 % of GPS sources and is attributed to recent AGN outflows where the black hole spin is still precessing (\pcitestanghellini01, \pcitelister02b). \scitelister02a detect superluminal motion (1.2c) in the southern jet.
Consistent with its status as a powerful radio source (P5GHz = 1026 W Hz-1; \pciteodea98 and references therein), the nucleus of PKS 1345+12 emits strong emission lines. However, although classified as an NLRG by \scitegrandi77, it has very broad forbidden emission lines with complex structures and strong blue asymmetries.
-
1.
PKS 1345+12 has two distinct redshift systems: one for the high ionisation lines (e.g. [O III], [Ne III]), another redshifted by +0.0008 producing the hydrogen Balmer and low ionisation lines (e.g. [O I], [O II], [S II] and [N II]).
-
2.
The emission lines are much broader than in normal NLRGs and exhibit distinct blue wings with the low ionisation lines (FWHM 1200 km s-1) having different line profiles to the high ionisation forbidden lines and hydrogen Balmer lines (FWHM 1600 km s-1).
In addition to the high ionisation optical forbidden line emission, further evidence that PKS 1345+12 contains a powerful quasar nucleus is provided by the detection of a broad (FWHM 2600 km s-1) component to Pa [\citefmtVeilleux, Sanders & Kim1997], the detection of a point source component in high resolution near-IR images [\citefmtEvans et al.1999], and the detection of a nuclear X-ray source [\citefmtO’Dea et al.2000].
3 New spectroscopic observations of PKS 1345+12

We present new observations taken in May 2001 with ISIS, the dual-arm spectrograph using the 4.2m William Herschel Telescope (WHT) on La Palma. In the red, the R316R grating was used with the TEK4 CCD, and in the blue, the R300B grating was used with the EEV12 CCD. A dichroic at 6100Å was used to obtain spectra with wavelength range 6212-7720Å in the red and 3275-6813Å in the blue simultaneously. A summary of observations is presented in Table 1. To reduce the effects of differential refraction, all exposures were taken when PKS 1345+12 was at low airmass (sec 0.1) or along the parallactic angle.
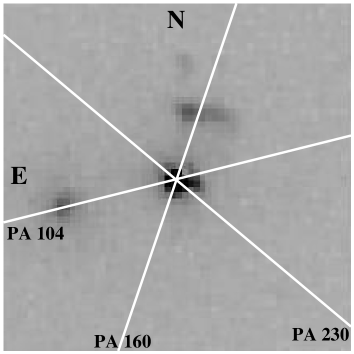
Spectra were taken along three slit positions - PA 104, PA 160 and PA 230 (see Figure 1) with a 1.3 arcsec slit. PA 104 includes the second nucleus 1.8 arcesc (4.3 kpc) to the east of the active nucleus. PA 160 lies along the radio axis and cuts through the arc of emission 1.2 arcsec (2.8 kpc) to the north of the nucleus. The final position, PA 230, was the parallactic angle of the source at the time of observation. All angular scales are taken from \sciteaxon00.
The data were reduced in the usual way (bias subtraction, flat fielding, cosmic ray removal, wavelength calibration, flux calibration) using the standard packages in IRAF. The two-dimensional spectra were also corrected for spatial distortions of the CCD. To reduce wavelength calibration errors due to flexure of the telescope and instrument, separate arcs were taken at each position on the sky. The final wavelength calibration accuracy, calculated using the standard error on the mean deviation of the night sky emission lines from published values (\pciteosterbrock96) was 0.059Å and 0.112Å in the red and blue respectively (PA 160). The spectral resolution, calculated using the widths of the night sky emission lines was 3.66 0.09Å in the red and 4.54 0.10 Å in the blue.
Comparison of several spectrophotometric standard stars taken with a wide slit (5 arcsec) throughout the run gave a relative flux calibration accurate to 5 per cent. This accuracy was confirmed by good matching in flux between the red and blue spectra. Further observations of standard stars with a narrow slit, matched to the slit width used to observe PKS 1345+12, were used to correct for atmospheric absorption features (e.g. A and B bands at 7600Å and 6800Å respectively).
The main aperture used was the nuclear aperture – 2.16 arcsec wide, centred on the nuclear continuum emission
The spectra were extracted and analysed using the Starlink packages FIGARO and DIPSO.
| Line | Component | Rest | Velocity | Velocity | Velocity | FWHM | Line | Flux |
|---|---|---|---|---|---|---|---|---|
| Wavelength | shift | shift | Width | Flux | ||||
| (Å) | (km s-1) | (km s-1) | (km s-1) | (km s-1) | (10-15) | (10-15) | ||
| [O III] | n | 5006.9 | 0 | 0 | 340 | 23 | 1.37 | 0.09 |
| i | 5006.9 | -402 | 9 | 1255 | 12 | 19.78 | 0.27 | |
| b | 5006.9 | -1980 | 36 | 1944 | 65 | 7.97 | 0.31 | |
| [O I] | n | 6300.3 | 0 | 0 | 340 | 0.52 | 0.03 | |
| i | 6300.3 | -48 | 9 | 1124 | 33 | 2.32 | 0.10 | |
| b | 6300.3 | -1095 | 66 | 2671 | 91 | 2.37 | 0.13 | |
| [S II] | n | 6716.4 | 0 | 0 | 340 | 1.28 | 0.03 | |
| i | 6716.4 | -222 | 90 | 1124 | 119 | 1.42 | 0.34 | |
| b | 6716.4 | -1374 | 213 | 2857 | 229 | 0.79 | 0.14 |
4 Results
In the following sections we will describe the results on the kinematics and physical conditions derived from the data. Discussion of the emission line ratios and ionisation state of the gas will be addressed in a future paper.
4.1 Kinematics of the extended gaseous halo
A key aspect of this project is to investigate the impact of the activity on the circumnuclear material. It is therefore necessary to establish the exact redshift of the galaxy rest frame. The heliocentric redshift, calculated using the narrow component of [O III] in the nuclear aperture (see section 4.2) is z = 0.12351 0.00008.
The [O II]3726,3728 emission lines are highly extended, detected up to 12 kpc to the N, E, W and SW; up to 15 kpc to the NE and up to 20 kpc to the S. Radial velocity profiles were constructed by fitting up to three Gaussians (narrow, intermediate and broad components; see section 4.2) to the doublet along the entire spatial range and are presented in Figure 3. For simplicity, [O II] was treated as one line rather than a doublet, hence the weighted mean of the rest wavelengths was used as the rest wavelength of the doublet when calculating the velocity shifts.
There are no clear patterns in the spatial variations of the [O II] radial velocity – there is no steep gradient across the nucleus and the overall shape does not resemble the signature ‘s’ shape expected for circular motions in a disk structure. This, along with the strong asymmetry in spatial extent of the emission, suggests the ambient gas has not settled down into a relaxed state. Figure 3 also reveals large velocity shifts (see section 4.2), up to 2000 km s-1, between the different components fitted in the nuclear aperture – shifts too large to be explained by gravitational motions and are likely to result from jet-cloud interactions, quasar induced winds or starburst-driven superwinds.
We assume the narrowest component in the nucleus traces the rest frame of the galaxy for five reasons:
-
1.
The narrow component is consistent with the narrow component in the extended [O II] emission, the only component which can be traced across the entire spatial range.
-
2.
The redshift of the narrow component is consistent with the deep HI 21cm absorption observed by \scitemirabel89 and \scitemorganti02 which is assumed to emanate from the ambient, quiescent ISM in the galaxy. It is also consistent with the redshift of the stellar absorption lines [\citefmtGrandi1977].
-
3.
The narrow component is by far the least kinematically disturbed component (FWHM = 340 23 km s-1).
-
4.
The narrow component has a small velocity amplitude ( 250 km s-1) consistent with gravitational motions in low-z galaxies [\citefmtTadhunter, Fosbury & Quinn1989].
-
5.
As will be shown in the next few sections, whilst different models for the intermediate and broad components are required to reproduce the profiles of different emission lines, the narrow components remain the same for all models and all emission lines. The narrow component data are presented in Table 2.
4.2 Modelling the emission lines
In section 4.1 we showed the narrow component of [O II] traces the rest frame of the galaxy. Here we model all strong emission lines in the nucleus to search for outflows.
Prior to the modelling of the emission line profiles in the nuclear regions a continuum model, comprising an elliptical galaxy template, a power-law and a nebular continuum, was subtracted from the data. The emission lines were modelled using the minimum number of Gaussians required to produce a physically viable good fit. In order to model the unusually broad emission lines in the nucleus of PKS 1345+12, it is essential to use three Gaussians (note by nucleus we mean an aperture 2.16 arcsec wide centred on the continuum emission). Figure 4 shows the best fit model for the [O III]4959,5007 lines.
The [O III] lines were fitted using three constraints in accordance with atomic physics: the flux ratio between [O III]4959 and [O III]5007 was set at 2.99:1 (based on the transition probabilities); the widths of the corresponding components of each line were forced to be equal; and the shifts between the corresponding components of each line were fixed to be 48.0Å. (Note, the fitting program used can only work with a wavelength difference and not a ratio of wavelengths. However, we find the incurred error is smaller than our estimated uncertainty.) The best-fitting model comprises 3 components for each line:
-
1.
A narrow component, FWHM = 340 23 km s-1.
-
2.
An intermediate component, FWHM = 1255 12 km s-1, blue shifted by 402 9 km s-1 with respect to the narrow component.
-
3.
A broad component, FWHM = 1944 65 km s-1, blue shifted by 1980 36 km s-1 with respect to the narrow component.
All three components are plotted in Figure 3.

Initially, in modelling the other emission lines, we assumed that one model would reproduce all emission lines, a technique which has been successful in studies of jet-cloud interactions in powerful radio galaxies (e.g. \pcitevillarmartin99a, \pcitevillarmartin99b). Hence, we attempted to model the other emission lines with the same three components and the same velocity widths and shifts as [O III], leaving the relative fluxes in the kinematic sub-components to vary. We will refer to this as ‘the [O III] model’ hereafter.
The [O III] model gives a good fit to H and is therefore assumed to reproduce H. However, as demonstrated in Figures 5 and 6, the [O III] model poorly reproduces the emission line profiles for [O I]6300,6363 and, to a lesser extent, [S II]6716,6731.
For [O I]6300,6363 and [S II]6716,6731, various models were tried ranging from free fitting (i.e. only the shift between the two [O I] or [S II] lines, the requirement that the corresponding components had the same width and, in the case of [O I], the intensity ratio 6300/6363 = 3.00, were fixed) to highly constrained models to find the best overall model. For all models, the narrow component varied little and was consistent in velocity width and shift with the narrow component of the [O III] model. Hence, for all models for all lines, the narrow component width and shift were constrained to be the same as that in the [O III] model. Note that, it is essential to use 3 Gaussians to reproduce all emission line profiles, irrespective of the model used.


Figure 5 shows the best fit model for [O I]6300,6363 (the [O I] model). Apart from constraints for the narrow component, only the shift between the two lines (63.5 Å) and the intensity ratio (6300/6363 = 3.00), known from atomic physics, were constrained. The [O III] model for [O I] is also overplotted and clearly does not reproduce the emission line profile well.
Our model for [O I] assumes that no emission from [S III]6312 and [Fe X]6376 is significant. Models for [O I] including [S III]6312 and [Fe X]6376 were tried with the [O III] model for [O I]. Whilst the overall line profile was modelled well, the contribution of [S III]6312 and [Fe X]6376 became unreasonably large and the model was discounted.
Similarly, Figure 6 shows the best fit model for the density diagnostic [S II]6716,6731. Again, the [O III] model does not provide a good fit, but the discrepancy is not as extreme as for [O I]6300,6363.
Due to the complex, broad emission lines in the nucleus and uncertainties in the continuum subtraction, it was difficult to fit the fainter lines in the nucleus and so the results are omitted from this paper.
4.3 Electron densities

| narrow | intermediate | broad | ||||
|---|---|---|---|---|---|---|
| H/H | 3.32 | 0.33 | 5.26 | 0.28 | 18.81 | 4.74 |
| E(B-V)(H/H) | 0.06 | 0.05 | 0.42 | 0.10 | 1.44 | 0.50 |
| E(B-V)(Pa/H) | - | - | - | - | 1.80(*) | 0.40 |
| FHβ (10-15 erg s-1 cm-2) | 0.70 | 0.06 | 8.83 | 0.31 | 42.66 | 0.95 |
| LHβ (1040 erg s-1) | 0.44 | 0.04 | 5.50 | 0.20 | 26.59 | 0.59 |
| Mgas (105 M⊙) | 2.61 | 0.30 | 0.92 | 0.03 | 5.64 | 1.22 |
| Mgastotal | 6.54 1.22 105 M⊙ | |||||
During the early stages of radio source evolution, the nuclear regions of radio sources are likely to harbour a rich ISM, possibly left over from a recent merger. Here we investigate the density of the line emitting gas using [S II] 6716/6731, the density diagnostic ratio.
In section 4.2 and Figure 6 we showed that the [O III] model fit to the [S II]6716,6731 doublet is not wholly satisfactory. The initial free fit for [S II] (i.e. only the narrow component width and position was constrained) produced a good fit to the overall line profile, but the ratio was outside the range of allowed values for both the intermediate and broad components ([S II] 6716/6731 0.44 – the ratio at the high density limit). For the next attempt, the same constraints were applied with the addition of the ratios of the broad and intermediate components set at the high density limit (6716/6731 = 0.44). This produced a good overall fit for the doublet which was physically viable (the narrow component ratio was well within the allowed range).
For subsequent fits, the [S II] 6716/6731 intensity ratio for the broad and intermediate components was slowly increased (i.e. the density decreased) until the model broke down and no longer fitted the blend well. Hence we estimate upper limits for the intensity ratio [S II] 6716/6731 of 0.57 and 0.60 for the intermediate and broad components respectively. Reassuringly, the density estimates obtained by fitting the [S II] doublet with the [O III] model were similar to those obtained using the [S II] model.
The density was calculated using the IRAF program TEMDEN which is based on the five-level atom calculator developed by \scitederobertis87, assuming an electron temperature of 10 000 K. Hence, upper limits for the intensity ratio [S II] 6716/6731 correspond to lower limits in density and we calculate densities of 5300 cm-3 and 4200 cm-3 for the intermediate and broad components respectively. The [S II] 6716/6731 ratio for the narrow component is consistent with the low density limit and we estimate an upper limit of ne 150 cm-3 for the narrow component.
4.4 Reddening
In section 4.3 we showed that the nuclear regions of PKS 1345+12 harbour a dense ISM (ne 4000 cm-3). Observationally, large amounts of gas and dust will be detected as reddening of the optical spectrum.
We have investigated reddening in PKS 1345+12 using three independent techniques: the H/H ratio, the Pa/H ratio and nebular continuum subtraction, assuming a simple foreground screen model for interstellar dust.
4.4.1 Balmer line ratios
The degree of reddening can be estimated using the Balmer line ratio H/H. Note that the H/[N II]6548,6583 blend in the nuclear spectrum of PKS 1345+12 is highly complex – all three lines are broad, have blue asymmetries and require three components each. Initially, both the H and [N II] lines were fitted using the [O III] model. The [O III] model was used for H since H is well modelled by it. For [N II], various models were tried and the [O III] model produced the best overall fit for the blend. Using this [O III] model we measured H/H ratios of 3.32 0.33, 5.26 0.28 and 18.81 4.74 leading to E(B-V) values of 0.06 0.05, 0.42 0.10 and 1.44 0.50 for the narrow, intermediate and broad components respectively (see Table 3; \pciteseaton79 extinction law assumed).
Given the complexity of the blend, we also re-modelled the lines to find the lowest possible flux for H, hence a lower limit for the ratio H/H and the E(B-V) value. We used the [O III] model for H but for [N II] only constrained the narrow components and for the intermediate and broad components, the flux ratio ([N II] 6583/6548 = 3.00) and the shift between the lines (35.27 Å) and forced the velocity widths of the corresponding components to be equal. This technique gave lower limits for H/H of H/H 3.91 and H/H 9.81 for the intermediate and broad components respectively corresponding to lower limits for E(B-V) of E(B-V) 0.19 and E(B-V) 0.92 for the intermediate and broad components respectively.
4.4.2 Comparison of the optical and infra-red
veilleux97 detected two components to Pa: broad (FWHM 2600 km s-1) and narrow (FWHM 900 km s-1), and they identified the broad component as broad line region (BLR) emission from a lightly-extinguished quasar nucleus. Although this interpretation is consistent with the detection of a point source in high-resolution near-IR observations [\citefmtEvans et al.1999], there must be some doubt about it given the detection of broad components to the forbidden lines at optical wavelengths. Unfortunately, it is difficult to establish the link between the various optical and infrared kinematic components with greater certainty, because \sciteveilleux97 neither publish the line shifts, nor fit an intermediate width component. However, by assuming that all the flux in the broad Pa is associated with the same component that emits the broad H detected in our optical spectrum and by varying this flux by a factor of 2 to account for possible slit-loss differences between the observations, we obtain an upper limit for reddening of the optical broad component of E(B-V) 2.0 – consistent with the other estimates obtained above.
4.4.3 The nebular continuum
Another indication of large reddening in the nuclear spectrum of PKS 1345+12 comes from consideration of the nebular continuum, calculated as part of the continuum modelling process prior to measurement of the emission lines. The nebular continuum for each kinematic component was created using the technique described in \scitedickson95. The nebular continuum strength is not particularly sensitive to temperature but we have assumed an electron temperature, Te = 10 000 K.
Initially, we assumed zero reddening for all components. Figure 7 shows the original spectrum, the zero reddening nebular continuum and the nebular continuum subtracted spectrum in the nucleus of PKS 1345+12 in the blue. After subtracting the nebular continuum, a clear discontinuity is left at the position of the Balmer edge at 3645Å which is unphysical. This indicates that the nebular continuum has been over-estimated in the zero reddening case and that reddening is likely to be significant in the nucleus of PKS 1345+12.
Using the E(B-V) values calculated from the measured H/H ratios (see section 4.4.1) and the standard interstellar extinction curve [\citefmtSeaton1979], we corrected the H fluxes for reddening and calculated the reddened nebular continuum spectra.
Figure 7 shows the original spectrum, the new nebular continuum (assuming E(B-V) values of 0.06, 0.42 and 1.44 for the narrow, intermediate and broad components respectively) and the nebular continuum subtracted spectrum in the nucleus of PKS 1345+12. Clearly, when the reddened nebular continuum is subtracted, there is no longer a discontinuity. This is further evidence for large reddening in the nucleus of PKS 1345+12
To further investigate the degree of reddening in the broad and intermediate components (the amount of reddening in the narrow component is negligible), this process was repeated for various E(B-V) values for the intermediate and broad components. The intermediate component contributes most of the flux in the nebular continuum and we estimate a lower limit of E(B-V) 0.3 for this component with some confidence – at this level of reddening, the discontinuity in the nebular continuum subtracted spectrum disappears.
The variation of the broad component had negligible effect on the resultant nebular continuum. Hence, the lower limit of E(B-V) 0.92 for the broad component comes from the calculated Balmer line ratios.
To summarise, the nuclear regions of PKS 1345+12 harbour a rich ISM and are subject to large reddening. Each of the three independent techniques for estimating reddening give consistent results and it is clear there is a strong correlation between the broadness of component and the degree of reddening, in the sense that the broadest components are the most highly reddened.
4.5 Estimating the gas mass
We have seen that the nuclear regions of PKS 1345+12 harbour a rich, dense ISM, but is there sufficient mass to confine and frustrate the radio source? Emission line luminosities are related to the mass of line emitting gas by:
where Ne is the electron density (cm-3); mp is the mass of the proton (kg); L(H) is the luminosity of the H line (erg s-1); is the effective recombination coefficient for H (cm3 s-1) and h is the energy of an H photon (erg).
In section 4.3 we calculated densities of ne 150 cm-3, ne 5300 cm-3 and ne 4200 cm-3 in the regions emitting the narrow, intermediate and broad components respectively. Using the presented equation, lower limits in density correspond to upper limits in mass. Hence, we estimate limits on the mass of line emitting gas of Mgas 2.61 105 M⊙, Mgas 0.92 105 M⊙ and Mgas 5.64 105 M⊙ in the regions emitting the narrow, intermediate and broad components respectively (see Table 3). This leads to an upper limit of order 106 M⊙ for the total mass of line emitting gas in the kinematically disturbed emission line components.
5 Discussion
5.1 A model for PKS 1345+12
The broad, multiple-component emission lines in PKS 1345+12 indicate that line emission emanates from at least three kinematically distinct regions in the NLR along the line of sight. To determine what these components represent, it is necessary to establish the exact redshift of the galaxy rest frame.
In section 4.1, we argued that the narrow component represents the ambient, quiescent ISM in the galaxy halo. We are confident of this result – the narrow component is the only component consistently found in all emission lines, irrespective of model required or spatial position; kinematically, it is the least disturbed component and it is consistent with the deep, narrow HI 21cm absorption trough (\pcitemirabel89, \pcitemorganti02) usually associated with the ambient, quiescent gas halo surrounding radio sources. Hence, the blue asymmetries in the emission line profiles represent material moving towards us, blue shifted with respect to the galaxy.
In sections 4.3 and 4.4 we showed that the intermediate and broad components originate from regions that are dense (ne 4000 cm-3) and dusty (E(B-V) 0.30 and E(B-V) 0.92 for the intermediate and broad components respectively). It is unlikely, therefore, that we would see emission from material on the far side of the nucleus – the further away from the observer in PKS 1345+12 along the line of sight, the more extinction the emission will suffer. The blue shifted material in PKS 1345+12 is therefore likely to be material in outflow on the side of the nucleus closest to the observer.
Indeed, similar conclusions have been made about the compact, flat-spectrum radio source PKS 1549-79 by \scitetadhunter01. The optical spectrum of PKS 1549-79 shows many characteristics similar to PKS 1345+12, namely blueshifted broad emission lines. Moreover, a large extinction for this source is suggested by the fact that, whilst the flat radio spectrum indicates the presence of a QSO, there is no evidence at optical wavelengths for the broad permitted lines and non-stellar continuum characteristic of QSOs. We will now build on the simple model proposed for PKS 1549-79 to account for more complex characteristics observed in PKS 1345+12.
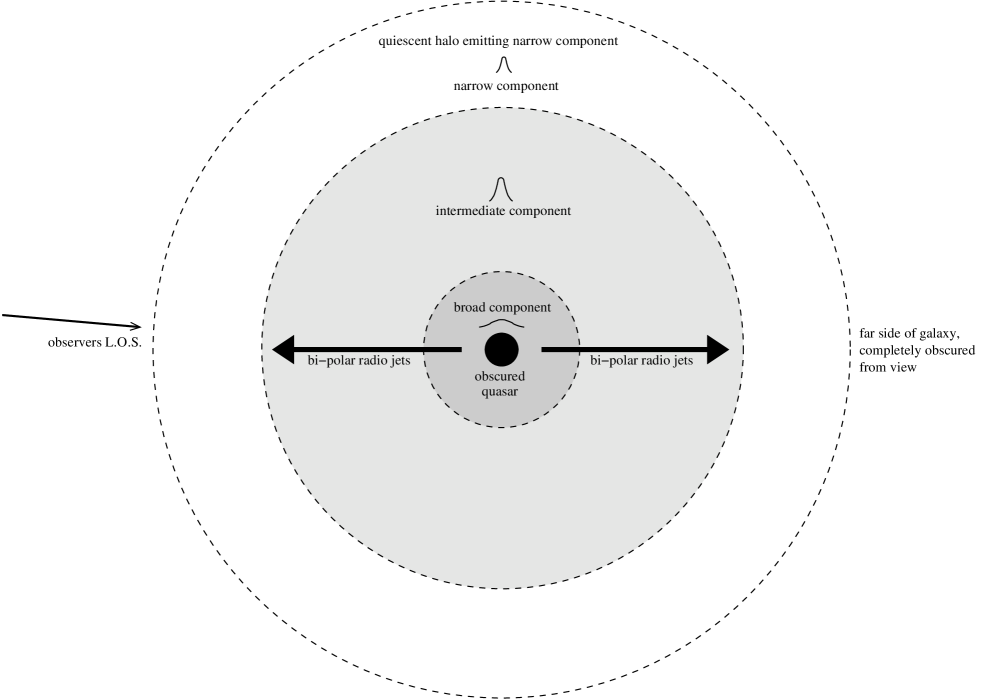
In sections 4.2 and 4.3 we showed that three Gaussians were required to fit all the emission lines, irrespective of the model required to reproduce the profile. The models vary in both velocity width and shift of the intermediate and broad components with respect to the narrow component. We interpret this as three kinematically and physically distinct regions in PKS 1345+12, each responsible for the emission of one of the components (i.e. narrow, intermediate or broad) although gradients in ionisation/density, coupled with gradients in velocity must exist across these regions to produce different broad or intermediate components (see Figure 8).
We can determine the locations of the three kinematically distinct regions using the reddening results. In section 4.4 we showed that whilst there is significant reddening in the nuclear spectrum of PKS 1345+12, the amount of reddening in the three components differs substantially. The narrow component has negligble reddening and must therefore originate from the outer regions of the galaxy. This is consistent with other evidence suggesting the narrow component originates from the galaxy halo (see section 4.1 and above). Similarly, the intermediate and broad components are subject to significantly more reddening with the degree of reddening correlating with the broadness of the component. The broadest component is therefore likely to originate from the regions closest to the galactic centre and the intermediate component slightly further out but within the narrow component emitting region.
We now propose an evolutionary scenario for PKS 1345+12:
-
1.
PKS 1345+12 underwent a merger event in its recent history. This merger consisted of two galaxies (PKS 1345+12 has a double nucleus), at least one of which was gas rich. The merger event started so recently it is still ongoing, indicated by the presence of two nuclei (e.g. \pcitegilmore86; \pciteheckman86; \pciteodea00). This is consistent with the idea that many radio galaxies appear to have been triggered by merger events.
-
2.
The merger event provided large amounts of gas and dust to the regions surrounding the nucleus, obscuring it from view.
-
3.
The current activity was triggered in the the western nucleus, the nucleus coincident with the radio source. Note, we use the term ‘current activity’ because, whilst we can say with confidence that the radio source is young (see section 5.2), we cannot rule out the possibility of previous activity phases which may be responsible for the extended, diffuse halo emission.
-
4.
While the active nucleus is obscured, the outer parts (halo etc) of the galaxy start to settle down. The halo is responsible for the emission of the narrow component and the deepest HI absorption trough (\pcitemirabel89; \pcitemorganti02). Hence, the velocity width of the narrowest component is consistent with gravitational motions. PKS 1345+12 is a GPS source and is therefore observed relatively shortly after the triggering of the radio activity. With time, the radio source will expand, first becoming a larger compact steep spectrum radio source (CSS) before becoming extended.
-
5.
As the radio jets expand, material is shocked, accelerated and pushed aside as the jets hollow out cavities on either side of the quasar (bi-polar). As well as jet-cloud interactions, quasar- or starburst-induced winds are also likely to be important at this stage. Indeed, outflow components with velocity shifts similar to those measured in PKS 1345+12 have also been detected in ULIRGs without strong radio emission [\citefmtWilman, Crawford & Abraham1999]. Therefore, the dominant driving mechanism for the outflows is currently unknown.
-
6.
Eventually, the radio jets will tunnel through the cocoon and expand freely to evolve into a large scale, extended radio galaxy.
5.2 PKS 1345+12 - young radio source
A crucial question regarding compact radio sources involves the amount of material in their circumnuclear regions. In the evolutionary scenario outlined above, we have assumed that PKS 1345+12 is a young radio galaxy. It is clear that the circumnuclear ISM in PKS 1345+12 is both dense and dusty, but is there sufficient mass to confine and frustrate the radio source?
In section 4.5, we estimated the mass of line emitting gas using the reddening corrected H luminosities (see Table 3). We estimated an upper limit for the total mass of line emitting gas (i.e. for the kinematically disturbed components combined) of 106 M⊙.
Several simulations have been run varying the distribution and density of the insterstellar medium to determine the mass of gas required to frustrate a radio source. Hydrodynamical simulations carried out by \scitedeyoung93 showed that for low to intermediate power radio sources (1043 - 1044 erg s-1) in both a homogeneous and a two-phase ISM, gas masses of order 1011 M⊙ were sufficient to confine the radio source for its entire lifetime. For the high power radio sources (1045 erg s-1), the masses required would be too large to be credible. Analytical models of jet interactions by Carvalho (1994,1998) suggest confinement is possible with much lower gas masses, of order 109 - 1010 M⊙ if the ISM is clumpy and within a scale of hundreds of pc of the radio source.
At face value, these simulations, considering either a smooth medium or small clouds evenly distributed throughout a sphere, may lead us to conclude that our estimate of Mgas 106 M⊙ may be too small to confine and frustrate the radio source and that PKS 1345+12 is a young radio source. However, if the ISM forms large dense clouds, much smaller masses could significantly disrupt the propagation of the jet (e.g. forming bubbles as in M87; \pcitebicknell96) which may lead to some degree of frustration.
6 Conclusions and future work
PKS 1345+12 is most likely a young radio source observed sometime after the start of the merger event which triggered the nuclear activity. We observe complex, multiple component emission lines in the nucleus which, due to large reddening in the nucleus, we interpret as material in outflow. Line emission originates from three kinematically distinct regions over which exist gradients in velocity, acceleration and possibly ionisation potential. The major outstanding issues for PKS 1345+12 concern the acceleration and ionisation mechanisms for the gas. In particular, whether the outflows are driven by the jets, AGN driven winds or starburst driven super-winds. In future, it should be possible to address these issues using high resolution imaging observations of the outflow regions in combination with detailed studies of the emission line ratios derived from our spectra.
Overall, our results provide evidence that the activity has a major impact on the circum-nuclear gas in the early stages of radio source evolution.
Acknowledgements
JH acknowledges a PPARC PhD studentship. We thank Geoff Bicknell for very useful discussions regarding the expansion of radio jets in dense environments. We also thank the referee, Dr. Ignas Snellen, for useful comments on the paper. The William Herschel Telescope is operated on the island of La Palma by the Isaac Newton Group in the Spanish Observatorio del Roque de los Muchachos of the Instituto de Astrofisica de Canarias. This research has made use of the NASA/IPAC Extragalactic Database (NED) which is operated by the Jet Propulsion Laboratory, California Institute of Technology, under contract with the National Aeronautics and Space Administration. Figures 2 to 7 inclusive were created in IDL. The preliminary results of this study were published in PASA, Volume 20.
References
- [\citefmtAxon et al.2000] Axon D. J., Capetti A., Fanti R., Morganti R., Robinson A., Spencer R., 2000, AJ, 120, 2284
- [\citefmtBalsara & Krolick1993] Balsara D. S., Krolick J. H., 1993, ApJ, 402, 109
- [\citefmtBaum, Heckman & van Breugel1988] Baum S. A., Heckman T., van Breugel W., 1988, ApJS, 68, 643
- [\citefmtBicknell & Begelman1995] Bicknell G. V., Begelman M. C., 1995, ApJ, 467, 597
- [\citefmtBicknell & Dopita1997] Bicknell G., Dopita M. A O’Dea C. P., 1997, ApJ, 485, 112
- [\citefmtBremer, Fabian & Crawford1997] Bremer M. N., Fabian A. C., Crawford C. S., 1997, MNRAS, 284, 213
- [\citefmtBurbidge1970] Burbidge E. M., 1970, AJ, 160, L33
- [\citefmtClarke, Bolton & Shimmins1966] Clarke M. E., Bolton J. G., Shimmins A. J., 1966, Aust. J. Phys., 19, 375
- [\citefmtde Robertis, Dufour & Hunt1987] de Robertis M. M., Dufour R., Hunt R., 1987, J. R. Astron. Soc. Can., 81, 195
- [\citefmtDe Young1993] De Young D. S., 1993, ApJ, 402, 95
- [\citefmtDickson et al.1995] Dickson R. D., Tadhunter C. N., Shaw M., Clark N., Morganti R., 1995, MNRAS, 273, 29
- [\citefmtEvans et al.1999] Evans A. S., Kim D. C., Mazzarella J. M., Scoville N. Z., Sanders D. B., 1999, ApJ, 521, L107
- [\citefmtFanti et al.1995] Fanti C., Fanti R., Schilizzi R. T., Spencer R. E., Stanghellini C., 1995, A&A, 302, 317
- [\citefmtGelderman & Whittle1994] Gelderman R., Whittle M., 1994, ApJS, 91, 491
- [\citefmtGilmore & Shaw1986] Gilmore G., Shaw M. A., 1986, Nat, 321, 750
- [\citefmtGrandi1977] Grandi S. A., 1977, AJ, 215, 446
- [\citefmtHeckman, Armus & Miley1990] Heckman T. M., Armus L., Miley G. K., 1990, ApJS, 74, 833
- [\citefmtHeckman et al.1986] Heckman T. M., Smith E. P., Baum S. A., van Breugel W. J. M., Miley G. K., D I. G., D B. G., B B., 1986, ApJ, 311, 526
- [\citefmtHolt, Tadhunter & Morganti2003] Holt J., Tadhunter C. N., Morganti R., 2003, PASA, 20, 25
- [\citefmtHutchings1987] Hutchings J. B., 1987, ApJ, 320, 122
- [\citefmtLister, Kellermann & Pauliny-Toth2002a] Lister M. L., Kellermann K. I., Pauliny-Toth I. I. K., 2002a, in Ros E., Porcas R. W., Zensus J. A., eds, Proceedings of the 6th European VLBI Network Symposium. Bonn, Germany
- [\citefmtLister et al.2002b] Lister M. L., Kellermann K. I., Vermuelen R. C., Cohen M. H., Zensus J. A., Ros E., 2002b, astro-ph/0210372
- [\citefmtMirabel, Sanders & Kazes1989] Mirabel I. F., Sanders D. B., Kazes I., 1989, ApJ, 340, 9
- [\citefmtMirabel1989] Mirabel I. F., 1989, ApJ, 340, L13
- [\citefmtMorganti et al.2002] Morganti R., Tadhunter C. N., Oosterloo T. A., Holt J., Tzioumis A., Wills K., 2002, submitted to PASA, astro-ph/0212321
- [\citefmtMurgia et al.1999] Murgia M., Fanti C., Fanti R., Grgorini L., Klein U., Mack K. H., Vigotti M., 1999, A&A, 345, 769
- [\citefmtO’Dea et al.2000] O’Dea C. P., de Vries W. H., Worrall D. M., Baum S. A., Koekemoer A., 2000, AJ, 119, 478
- [\citefmtO’Dea1998] O’Dea C. P., 1998, PASP, 110, 493
- [\citefmtOsterbrock, Fulbright & Keane1996] Osterbrock D. E., Fulbright J. P., Keane M. J amd Trager S. C., 1996, PASP, 108, 277
- [\citefmtOwsianik, Conway & Polatidis1998] Owsianik I., Conway J. E., Polatidis A. G., 1998, A&A, 336, L37
- [\citefmtReadhead et al.1994] Readhead A. C. S., Xu W., Pearson T. J., Wilkinson P. N., Polatidis A. G., 1994, in Zensus J. A., Kellermann K. I., eds, Proc. NRAO Workshop 23, Compact Extragalactic Radio Sources. Greenbank:NRAO, p. 17
- [\citefmtReadhead et al.1996] Readhead A. C. S., Taylor G. B., Xu W., Pearson T. J., Polatidis A. G., 1996, ApJ, 460, 612
- [\citefmtSeaton1979] Seaton M. J., 1979, MNRAS, 187, 73P
- [\citefmtSmith & Heckman1989] Smith E. P., Heckman T. P., 1989, ApJS, 69, 365
- [\citefmtStanghellini et al.1993] Stanghellini C., O’Dea C. P., Baum S. A., Laurikainen E., 1993, ApJS, 388, 1
- [\citefmtStanghellini et al.1997] Stanghellini C., O’Dea C. P., Baum S. A., Dallacasa D., Fanti R., Fanti C., 1997, A&A, 325, 943
- [\citefmtStanghellini et al.1998] Stanghellini C., O’Dea C. P., Dallacasa D., Baum S. A., Fanti R., Fanti C., 1998, A&AS, 131, 303
- [\citefmtStanghellini et al.2001] Stanghellini C., Dallacasa D., O’Dea C. P., Baum S. A., Fanti R., Fanti C., 2001, A&A, 377, 377
- [\citefmtTadhunter, Fosbury & Quinn1989] Tadhunter C. N., Fosbury R. A. E., Quinn P. J., 1989, MNRAS, 24, 225
- [\citefmtTadhunter et al.2001] Tadhunter C. N., Wills K., Morganti R., Oosterloo T., Dickson R., 2001, MNRAS, 327, 227
- [\citefmtTschager et al.2000] Tschager W., Schillizi R. T., Röttgering H. J. A., Snellen I. A. G., Miley G. K., 2000, A&A, 360, 887
- [\citefmtvan Breugel1984] van Breugel W. J. M., 1984, IAU symp., 110, 59
- [\citefmtVeilleux, Sanders & Kim1997] Veilleux S., Sanders D. B., Kim D.-C., 1997, ApJ, 484, 92
- [\citefmtVillar-Martín et al.1999a] Villar-Martín M., Tadhunter C. N., Morganti R., Axon D. J., Koekemoer A., 1999a, MNRAS, 307, 24
- [\citefmtVillar-Martín et al.1999b] Villar-Martín M., Tadhunter C. N., Morganti R., Fosbury R. A. E., 1999b, A&A, 336, 7
- [\citefmtWilman, Crawford & Abraham1999] Wilman R. J., Crawford C. S., Abraham R. G., 1999, MNRAS, 309, 299