Anisotropies in the redshift-space correlations of galaxy groups and clusters II: Analysis of observational cluster samples.
Abstract
We study the redshift space correlation function of galaxy clusters for observational samples constructed in different surveys. We explore correlation amplitudes, pairwise velocity distributions and bias factors. Systematics in cluster identification procedures are the main source of biased estimates of the correlation amplitude and inferred velocity dispersions. We find that the large elongations along the line of sight in the Abell catalogue cannot be explained solely in terms of the errors in distance measurement originating from using a small number of galaxies. The inclusion of a significant fraction of galaxies and systems not physically bound to the clusters are responsible for this large systematic effect. We also find a significant dependence of the redshift space distortion of the correlation function on the cluster Bautz-Morgan type, an effect that may rely on the fact that, due to the regular appearance of low Bautz-Morgan type clusters, a sample of such objects would be less contaminated. We confirm that the effect of a low number of redshift measurements, , is to increase the redshift-space correlation length and bias factor. The results are very stable for . We also test the effects of different in the catalogue of groups/clusters derived from the Updated Zwicky Catalogue and find that, for cluster samples identified in redshift surveys, even a low number of redshifts , is sufficient to provide reliable results. By comparing our results with those of numerical simulations we explore the strong influence on the clustering distortion pattern in redshift space from effects associated with the cluster identification procedure from two dimensional surveys. The identification of clusters in X-ray surveys improves this situation, although there are still systematic effects which are probably due to identification of optical sources in the determination of cluster redshifts. These systematics are particularly strong for the most luminous X-ray selected clusters in the Extended Bright Cluster Survey, which exhibits very large anisotropies, comparable to those present in the Abell catalogue. Our results demonstrate that forthcoming large redshift surveys will be extremely important for the construction of new samples of groups and clusters as well as improving the determination of optical and X-ray selected cluster distances, essential for reliable analyses of the large scale structure.
keywords:
methods: statistical - methods: numerical - large-scale structure of Universe - galaxies: clusters: general1 Introduction
Clusters of galaxies can be used as tracers of the large scale structure of the Universe. However, their identification is not free from systematics, for example the Abell catalogue is known to be afflicted by projection effects (Sutherland 1988; Sutherland & Efstathiou 1991; see also Lucey 1983), which are somewhat reduced when restricting the sample of clusters to high richness class (Miller et al. 1999).
Cluster peculiar motions produce an apparent distortion of the clustering pattern as measured by the two-point correlation function in redshift space, (Croft & Efstathiou 1994; Bahcall, Cen & Gramann 1994), with and being the separations perpendicular and parallel to the line of sight, respectively. The non-linear virialized regions induce elongations along the line of sight which make it possible to estimate the one-dimensional pairwise rms velocity dispersion, (Davis & Peebles 1983). The infall onto overdense regions in the form of bulk motions dominates at large scales resulting in a compression of the contours along the direction of the line of sight.
The presence of spurious large anisotropies along the line of sight of Abell clusters has been largely discussed (e.g., Sutherland 1988, Sutherland & Efstathiou 1991, Bahcall & Soneira 1983; Postman, Huchra & Geller 1992). Arising mainly from inhomogeneities in the detection of clusters in two dimensions (ie. prone to strong projection effects), these observed large anisotropies are extremely unlikely to exist for systems of galaxies within a hierarchical scenario of structure formation. Therefore, the clustering signal along the line of sight in the Abell catalogue could be artificially enhanced (Sutherland 1988; Sutherland & Efstathiou 1991; see also Lucey 1983) due to significant projection effects which could bias the determination of the correlation function as well as the mass function of these systems. A velocity broadening of , obtained by Bahcall, Soneira & Burgett (1986) from their analysis of the clustering of Abell clusters, was interpreted as arising from a combination of cluster peculiar motions as well as geometrical distortions of superclusters. However, van Haarlem et al. (1997) find that a third of Abell clusters of richness class would not be real physically bound systems but simply projections of galaxies and groups along the line of sight. It has to be recalled that early surveys of Abell clusters contain large fractions of low richness clusters (Abell richness class ), which were not intended to form complete samples suitable for statistical analyses. Miller et al. (1999) analysed samples of Abell clusters with richness , with new accurate determinations of cluster positions using several galaxy redshifts. These authors find that the clustering signal along the line of sight is greatly reduced when compared with the Bahcall & Soneira (1983) results. The anisotropy is further reduced after the orientation of two superclusters that are elongated along the line of sight is changed. More recently, Miller et al. (2002) found that the inclusion of clusters in superclusters has a significant incidence in the anisotropies of the redshift-space correlation function. A possible interpretation of this result is that cluster identification in overdense regions is likely to be more affected by projection effects. Peacock & West (1992) also found that restricting attention to higher richness Abell clusters removed the strong radial anisotropy seen in the clustering measured from earlier surveys.
A more recent generation of cluster catalogues presumably less affected by identification biases (APM: Dalton et al. 1992, 1994, 1997; Cosmos: Lumsden et al. 1992) was drawn from machine-scanned survey plates with better calibrated photometry. With the aim of reducing biases in cluster richness determinations arising from projection effects, the search radius used to define clusters in these machine based catalogues is smaller than that used by Abell. As expected, the clustering pattern found in these more recent cluster redshift surveys does not exhibit very large enhancements along the line of sight; furthermore, the trend of increasing correlation amplitude with decreasing space density of clusters is weaker than that found for Abell clusters (Croft et al. 1997) and is similar to the trend expected in current models, where there is only a weak dependence of correlation length on cluster space density, as is obtained in other all sky X-ray surveys (eg REFLEX sample, Collins et al. 2000), and samples of Abell clusters confirmed in X-rays (X-ray Bright Abell Cluster Sample, XBACS, Ebeling et al. 1996). For these samples, systematic projection effects along the line of sight are expected to be significantly lower than in the Abell catalogue (Abadi, Lambas & Muriel 1998; Borgani et al. 1999; Collins et al. 2000). However, it is important to consider that the analysis of high richness Abell clusters, performed by Miller et al. (1999), gives results comparable to the amount of distortion of the clustering pattern found for APM clusters (see Fig 5 of Miller et al. 1999).
In this paper, we use the results of an analysis of the redshift space clustering of massive dark matter haloes in mock cluster samples (Padilla & Lambas, 2003, Paper I hereafter) extracted from the CDM Hubble Volume simulation. The results from Paper I are used in the assessment of projection biases on catalogues of clusters identified in two dimensions and three dimensions. In paper I we studied statistically the redshift-space correlation function as a function of coordinates parallel and perpendicular to the line of sight, through the pairwise velocity dispersions, redshift-space correlation length and bias parameters obtained from different mock cluster samples constructed using several cluster identification algorithms, and different number of redshifts and cluster search radii. Spurious distortions in the redshift space cluster correlation function could originate in various systematics associated to these issues. For instance in several catalogues, many cluster distances are determined by a single galaxy redshift, usually the brightest cluster member and therefore are subject to projection contamination from background and foreground galaxies.
In this paper we present an analysis of the correlation function of observational cluster data, including optical and X-ray cluster samples. In section 2 we present the statistical procedures adopted and we summarise the results obtained from the study of different mock samples in Paper I that concern the present study. These mock samples are used for assessing the degree to which different problems could contribute to the anisotropies detected in observational correlation functions in Section 3. In this section we study the effects of the number of redshifts used in the determination of cluster distances, the effects arising from selecting samples with different Bautz-Morgan cluster types (Bautz & Morgan, 1970) and the different behaviour of samples with high and low x-ray luminosities. In section 4, we analyse groups of galaxies obtained from the Updated Zwicky Catalogue, hereafter UZC , which, in contrast to other sets of clusters studied in this paper, were identified from redshift space data. In section 5 we discuss our results and present the main conclusions.
2 Statistical procedures and results from mock catalogues
We followed the procedures described in paper I to measure the redshift-space correlation function as a function of the pair separation parallel and perpendicular to the line of sight, and respectively. The iso-correlation contours (curves of equal amplitude of ) provide a suitable measurement of the pairwise velocities of galaxies by comparing the measured and predicted contour levels. These contour levels are approximated by the functions and for the measured and predicted correlations respectively, where is the polar angle measured from the direction perpendicular to the line of sight (See Paper I for details).
In order to make a proper comparison between model predictions and observations, we adopt the real-space correlation function of the mass distribution in a CDM cosmology. We use a mass density parameter , vacuum energy density , and a CDM shape parameter consistent with recent CMB results (Netterfield et al. 2002). The normalisation of the power spectrum, , is taken from recent constraints obtained from the 2dF Galaxy Redshift Survey (Norberg et al. 2002). Given the relatively large uncertainties in the cluster correlation functions the adopted transfer function does not include baryons, however our choice of implicitly allows for a combination of baryon fraction and an effective value of as discussed in Eisenstein & Hu (1996). We obtain the real-space correlation function by Fourier transforming the CDM power spectrum
| (1) |
and then use this to evaluate the theoretical prediction for . We search for the optimum values of the scale independent bias parameter and by minimising the quantity ,
| (2) |
where we have chosen to compare a set of discrete levels, and , of the redshift-space correlation function amplitude instead of comparing values of the correlation function on a grid of and distances. Our decision is based on the fact that more reliable and stable results are obtained when using the isopleth comparison technique (Padilla et al. 2001). We notice that the effect of adopting a different normalisation for the theoretical power spectrum mainly affects the bias parameter , leaving the pairwise velocity mostly unchanged.
We briefly summarise the results obtained for the statistical properties of cluster samples drawn from mock catalogues presented in Paper I. These mock catalogues have been obtained from one of the mock APM galaxy catalogues extracted from the CDM Hubble Volume simulation by the Durham Extragalactic Group (Evrard et al., 2002) following a procedure similar to that used in Cole et al. (1998).
In Paper I, we used three main algorithms to search for groups in the numerical simulations, and constructed four samples of clusters from the simulations. The aim was to understand the effects of cluster selection procedures on the cluster correlation functions, and in particular, to establish the origin of the large elongations along the line of sight present in the measured correlation functions. Sample 1, constructed using a friends-of-friends algorithm applied to the particles in the simulation box, has a lack of a significant number of spurious clusters. The measurements of anisotropies in the correlation function clearly show the expected infall pattern. Sample 2 allows to understand the results obtained from the identification of groups in a mock catalogue with redshift information following the lines described by Huchra & Geller (1982). In this case the results from Paper I indicate that the infall pattern is not as readily visible as in the results from Sample 1, but a small is enough to produce it. Sample 3 was constructed following the prescription described by Lumsden et al. (1992), using an angular search radius h-1Mpc. This procedure was applied to the same mock catalogue as the second algorithm, and the resulting sample was found to show severe projection effects. The results from this sample will be used to assess the degree of these effects in observational samples of cluster of galaxies identified from angular data. In Paper I we also extracted another sample combining the mock catalogues defined above, in order to mimic as closely as possible the methods used in obtaining the observational samples. From the clusters identified using angular data (sample 3), we drawn a restricted set of clusters of galaxies, whose angular positions lie within the cluster search radius from a 3D identified cluster, sample 4.
As a summary of the results of our mock samples, we recall figures 11,12, and 13, of Paper I, where the behaviour of the correlation contours is assessed by measuring the pairwise velocity dispersion and the correlation length as a function of . We found that in the case of the identification of clusters from angular data, the values of and are higher as the underlying value by as much as an order of magnitude. In the case of clusters identified from 3-dimensional information (sample 2), these quantities converge rapidly to their actual values, which are obtained when a small number of galaxies, not much larger than , is used to determine the cluster distance.
For more detailed descriptions of the characteristics of each sample, analysing the differences in elongations arising from using different , and search radius , we refer the reader to Paper I.
3 Redshift Space Distortions of Groups and Clusters of Galaxies
In this section we compute the two-point correlation function in redshift space using different cluster catalogues.
Following usual procedures we estimate by counting pairs in the data and in a random catalogue with the same angular limits and radial selection function than the observational sample. Data-data and random-random pairs ( and respectively) are binned as a function of separation in the two variables and . We adopt the Davis & Peebles (1983) estimator,
| (3) |
where and are the number of data and random points respectively.
Our analyses are centred on large correlation amplitude signals which are not strongly sensitive to the choice of estimator (see Hamilton 1993).
In Figure 1, we show the contours levels of for UZC groups (left panel). There are no signals of distortions along the line of sight direction for the groups consistent with low pairwise velocities of groups. By comparison with the results for samples of clusters identified in two-dimensional surveys shown in the other panels of this figure it is evident the existence of either large pairwise velocities or large projection biases in these samples, as also discussed by Sutherland (1988). Such elongations could originate in the systematic presence of groups along the line of sight, in the fields of clusters identified from angular data. From the theoretical point of view, strong elongations along the line of sight are not expected in a hierarchical scenario of structure formation.
This section is divided as follows: In section 3.1 we study the correlation function of APM and Abell clusters. We divide the Abell samples according to the number of redshifts used in the determination of the cluster distances in section 3.1.1, and also according to Bautz-Morgan type in section 3.1.2. Cluster samples identified in X-rays are studied in section 3.2; the results from subdividing the EBCS sample using a x-ray luminosity cut are shown in section 3.2.1; and the outcomes of sub-dividing the XBACS sample according to different Bautz-Morgan type are explained in section 3.2.2. Finally, the inferred values of relative velocities and redshift-space correlation lengths are presented in section 3.3, and the bias factors in section 3.4.
3.1 Clusters samples selected from angular surveys
In this section we study the iso-correlation contours obtained from cluster catalogues identified using surveys of galaxies containing only angular positions. As has already been pointed out, studies of such samples have shown large elongations along the line of sight even when, in light of the previous discussion, we would have expected infall patterns from samples of massive clusters (Padilla & Baugh, 2002).
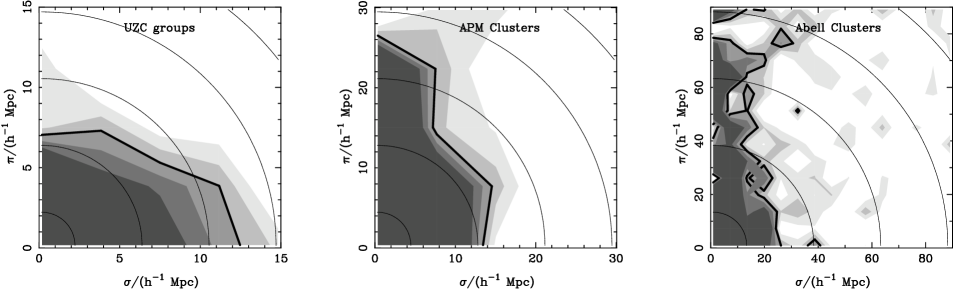
We measured the correlation function of APM and Abell clusters in order to compare them to the results from the UZC groups, shown in the left panel of figure 1. We also show in this figure the results for APM clusters (Dalton et al., 1992; middle panel), and Abell clusters with measured redshifts (Struble & Rood 1999, right panel). The sample of Abell clusters consists only of clusters with determined Bautz-Morgan type. It can be seen that there is a marked difference in the distortion pattern between the UZC groups, which show an infall signature, and the elongated correlation functions corresponding to the other two cluster samples in this figure. This elongation is most severe in the case of Abell clusters, as it has already been pointed out in several previous works (Bahcall & Soneira 1983; Postman, Huchra & Geller 1992), and has been reconciled by considering the effects of cluster alignments in supercluster structures (Bahcall, Soneira & Burgett 1986), and the likely inclusion of spurious clusters in the sample due to projection effects (Sutherland 1988; Sutherland & Efstathiou 1991; see also Lucey 1983). APM clusters show a much milder elongation, which can be easily reproduced in numerical simulations when a redshift error bigger than km/s is added to the mock cluster positions (Padilla & Baugh 2002) although contamination can not be totally excluded.
In an attempt to explore and quantify the origin of the problem of large elongations of the clustering signal we study the effects of errors in cluster distances by considering different number of redshifts used in the determination of cluster distances, as well as the possible projection effects. In order to do this, we use results obtained from mock catalogues where clusters of galaxies are identified from angular data (see Paper I). Such a comparison will also be useful in providing a quantitative determination of the degree of projection effects present in the Abell cluster sample.
3.1.1 Effects of different number of redshifts
In order to assess to which extent the use of samples of clusters with large number of redshift measurements, , reduces the distortion of the clustering pattern, we have explored samples with different values of .
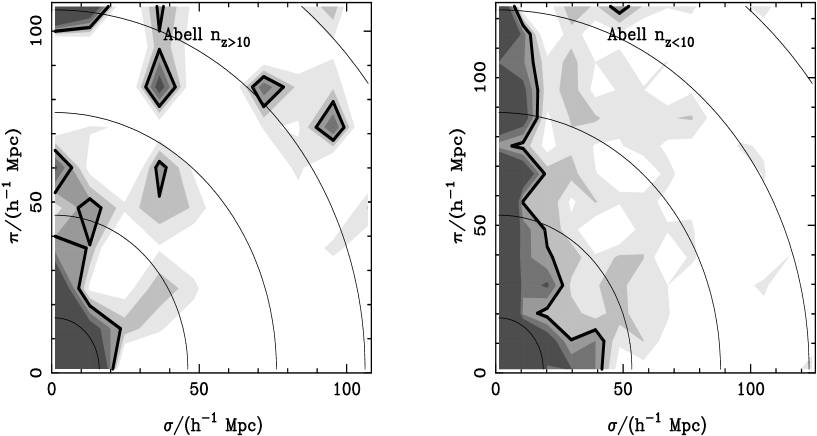
Figure 2 shows the results from clusters whose distances have been obtained using more than ten galaxy redshifts, (left panel), and results for clusters with (right hand side panel). The net effect of having a large is to lower the amplitude of the line of sight elongation. It can be seen that, even though this effect is not small, it is insufficient to reproduce the flattening observed in less massive groups of galaxies as seen in figure 1. The results shown in the two panels in figure 2 can be compared to figure 6, paper I, for different values. These samples were constructed in order to match as closely as possible the procedure followed to construct cluster samples obtained from angular information. By comparison, the trend of increasing anisotropies for lower number of redshift measurements used to determine cluster distances is present in both, the observational and simulated samples.
An interesting point to be noted is the clear enhancement of the correlation length in the direction for the small bin (which we will call from now on) in the observational and mock samples with low , with respect to those with more redshift measurements. By inspection to figure 8 we see that this difference is also present in the redshift-space correlation length . This is in agreement with more general results obtained from mock cluster catalogues identified from angular simulated data. This can be seen in figure 10 of Paper I, where a decrement in for higher values of can be easily seen. This indicates that it is likely that the difference in correlation amplitudes indicated by the value of shows the diminished effects of projection biases in the high Abell sample, rather than a difference in average cluster mass.
We will come back to this point in the following sections, where we will examine subsamples of optically and x-ray selected clusters of galaxies.
3.1.2 Results from different from Bautz-Morgan type samples
We have also analysed samples of Abell clusters with different Bautz-Morgan (BM) types. The BM type is indicative of the regularity of the distribution of galaxies in a cluster; the larger the BM type, the more irregular the shape of the cluster is.
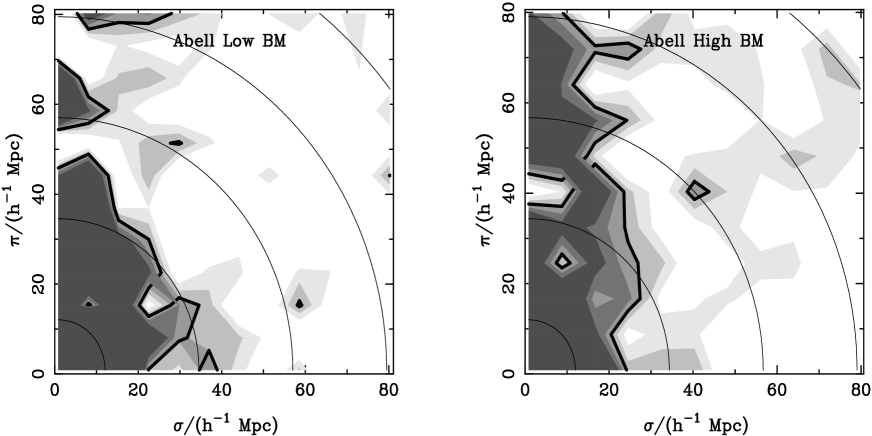
The results from studying samples of different BM type can be seen in figure 3, where the left panel shows the correlation contours for clusters with Bautz-Morgan type I, I-II, and II, corresponding to more regular clusters, and the right panel shows results from BM types II-III and III, that is the most irregular ones. The particular choice of BM type to define the samples corresponds to a rough classification of regular and irregular clusters. Even though the differences between both panels are not conclusive, there is a larger elongation in the correlation function of clusters with larger BM types (the inferred relative velocities for these cluster samples can be seen in figure 8).
The larger elongation seen in the correlation function of high BM type clusters in figure 3 indicates that they are slightly more prone to the inclusion of spurious background or foreground galaxies than low BM types, or even to be results of projection effects in the angular distribution of galaxies. These problems seem also to be present in the low BM type clusters, but to a lesser extent.
It can also be appreciated that the estimated correlation length has similar values for the low and high BM type clusters (figure 3). This fact would suggest a similar real-space correlation length for both samples. However, we expect that the most massive clusters would show a more regular galaxy distribution, and therefore, be of low BM types, whereas high BM type clusters would correspond to less massive clusters, with lower galaxy richness counts, more irregular shapes, and lower correlation lengths. Since high BM clusters are likely to be subject to larger projection effects due to their irregular appearance they could have a biased large estimate of as shown in paper I, clarifying the results of seen in this figure.
We next measure the redshift-space correlation length, , for both sub-samples. In this case, we obtain a higher correlation length for the low BM type clusters (see figure 8), in support of the presence of a correlation between mass and BM type proposed in the last paragraph.
Furthermore, as we discussed in the previous sub-section, it can be argued that both and depend on the degree of projection effects present in a sample. The analyses carried out in Paper I indicate that the effects of increasing on , for samples of clusters identified from angular data, is that of making ever smaller and closer to its actual value. This result implies that the fact that we obtain a larger value of for clusters with low BM type actually indicates that this sample contains more massive clusters than that with high BM type clusters.
From these results, we notice that we can reduce the degree of contamination in a sample of Abell clusters by considering subsamples of regularly shaped systems. However, it should be noticed that projection effects cannot be completely removed in the Abell catalogue by considering subsamples with low BM type nor large .
3.2 X-ray selected clusters of galaxies
In order to provide an insight to the characteristics of cluster samples with X-ray selection criteria, we study two samples of X-ray selected clusters of galaxies, the X-ray Bright Abell Cluster Sample (XBACS, Ebeling et al. 1996) and the Extended ROSAT Brightest Cluster Sample (EBCS, Ebeling et al. 2000). The fact that these clusters have been identified from the X-ray emission of hot gas trapped in the huge potential wells of massive clusters of galaxies, makes these samples more reliable than cluster samples selected from 2D data. This is a consequence of the fact that the emission from the hot gas is proportional to the square of the density, which makes it a lot more difficult to have a spurious cluster of galaxies resulting from the alignment of small hot gas clouds along the line of sight.
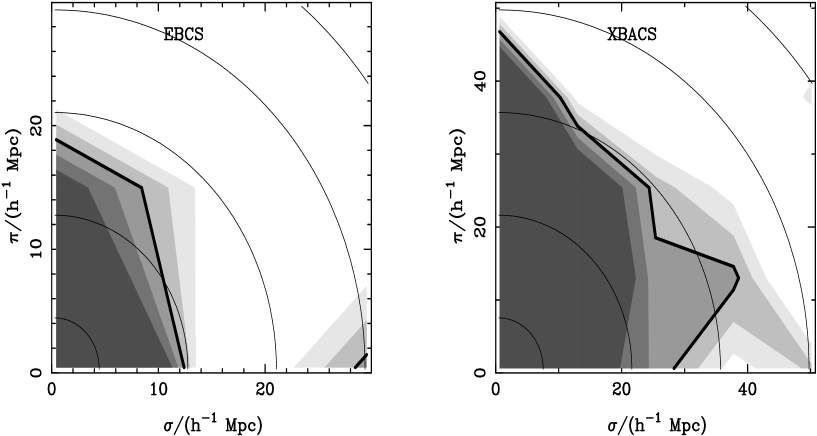
Clusters of galaxies in the XBACS sample, which comprises Abell clusters whose emission in X-rays has been confirmed, would be less affected by projection effects present in the Abell sample, since only real clusters would show hot gas emission. On the other hand, in the EBCS sample, sources were identified from an X-ray survey and then galaxy redshift distributions were analysed to find the optical counterparts. These clusters should be largely free from projection effects, and should not include identification biases associated to the Abell cluster finding algorithm. However, the reliability of X-ray cluster distances obtained from correlations with redshift surveys are subject to uncertainties that could affect the results. The correlation functions measured for the EBCS and XBACS samples are shown in the left and right hand side panels of figure 4 respectively. As can be seen, the EBCS sample shows only a slight elongation along the line of sight which can be easily reconciled with the presence of distance measurement errors similar to those necessary to explain the anisotropies observed in the APM correlation function (Padilla & Baugh, 2002). On the other hand, the line of sight distortion of the XBACS correlation function shown in the right panel of this figure provides a strong indication of the presence of projection effects. Given their larger correlation amplitude, XBACS should be subject to a strong infall signal, which is not observed. The results from Paper I indicate that the projection effects seen in the correlation function of mock clusters identified from angular data (sample 3) are still present in a set of clusters with angular positions coincident with clusters identified in 3D (sample 4). The studies performed in Paper I show that the elongations in found in this mock cluster catalogue are quite severe, and are mainly produced by the erroneous use of foreground and background galaxies in assigning the distances to clusters.
3.2.1 Luminosity effects in x-ray selected samples
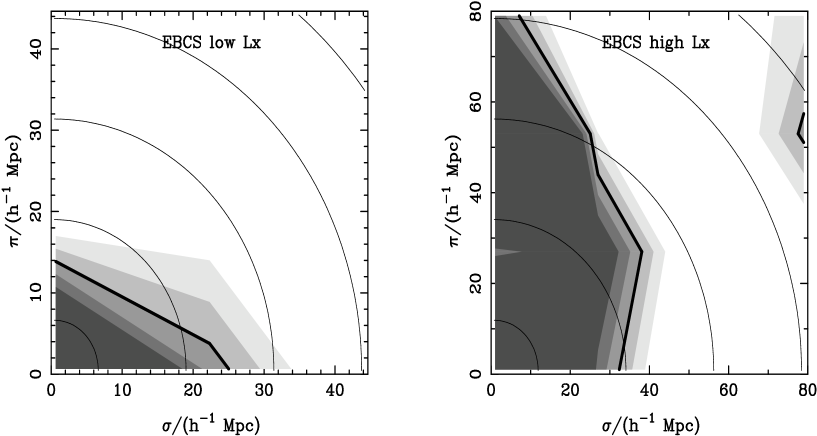
Even though the elongation of the correlation function contours along the line of sight present in the total EBCS sample can be accounted for by redshift measurement errors, we explore EBCS subsamples defined by limiting the range of intracluster gas luminosity in x-rays. We define a limit which divides the total sample of EBCS clusters into two subsamples with similar number of clusters. The resulting iso-correlation levels can be seen in figure 5, where the left panel shows the results for , and the right hand side panel, those for . This is a somewhat unexpected result, since high luminosity clusters show a very elongated pattern, whereas the least luminous clusters show the expected flattened pattern indicative of less significant projection effects.
A possible source for this effect could rely on contamination by foreground structures which are likely to affect more strongly clusters at greater distances. These contamination effects could bias distance estimates and the X-ray luminosity. In figure 6 we show the distribution of cluster distances for the high and the low x-ray luminosity subsamples which support this scenario.
The resulting values of relative velocities, redshift-space correlation lengths and bias factors corresponding to the EBCS subsamples defined by the luminosity cut are presented in figures 8 and 9 respectively. As can be seen, low x-ray luminosity EBCS clusters present a remarkably low pairwise velocity dispersion, comparable to that resulting from the analysis of UZC groups, identified from redshift data.

3.2.2 Subsamples of different BM type effects in x-ray clusters
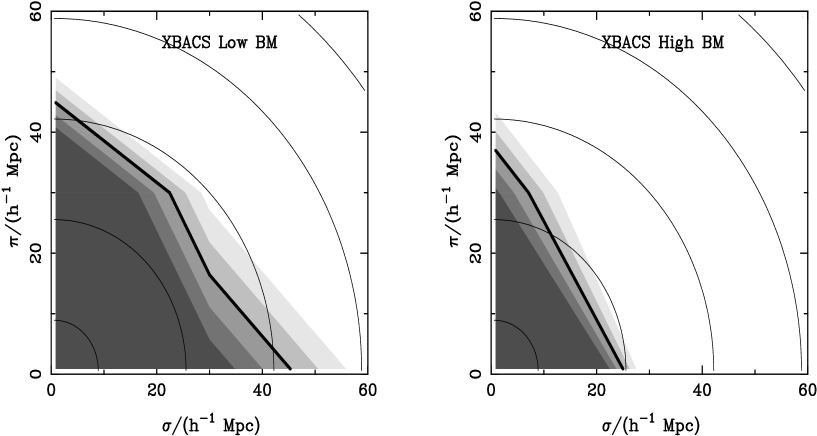
In this subsection we analyse the redshift space clustering pattern arising in samples of x-ray clusters with different BM types. This is aimed to study the combination of projection effects which could manifest in the correlation function. Since BM types are available for Abell clusters, we restrict the analysis to the XBACS sample.
The results can be seen in figure 7, where the left panel shows the correlation contours for clusters with Bautz-Morgan type I, I-II, and II and the right panel shows results from BM types II-III and III. The choice of BM types for the different panels is the same as that used for Abell clusters, but the difference in elongations is more readily apparent. The figure shows a significantly larger elongation for the sample of clusters with larger BM types, as was the case with Abell clusters of different BM type. The larger correlation length for the low BM type clusters, which can also be seen as a larger value of (see figure 8) can be appreciated once more. This supports the earlier hypothesis that the most massive clusters would be more frequently identified as low BM type clusters, and therefore show a large correlation length. This figure also supports the idea that the larger elongations in the high BM type clusters are probably produced by a larger number of background or foreground galaxies used in assigning distances to high BM type clusters.


3.3 Relative velocities and correlation lengths in observational cluster samples
In order to summarise the results obtained from the study of observational samples of clusters of galaxies identified from angular data, we present the values of relative velocities and redshift-space correlation lengths obtained from the correlation functions shown in previous figures.
We find the relative velocities by minimising equation 2. The real space correlation function used in this equation corresponds to a CDM power spectrum with parameters , , a CDM shape parameter , and .
Based on the results of the study of galaxies and groups of galaxies, and supported by simulations of the hierarchical processes thought to drive the formation of structure, we expect to find smaller relative velocities for clusters of galaxies than are found for galaxies and groups. The upper panel of figure 8 shows relative velocity on the y-axis, and observed sample on the x-axis. The errors in relative velocity result from the different estimates obtained from different correlation function levels, and show 1- confidence levels. The ordering of the samples along the x-axis is such that relative velocities decrease to the right. If the cluster samples were free from projection effects of any kind, this ordering of samples would result in showing groups on the left and the most massive clusters on the right. However, as can be seen, every cluster sample, with the exemption of EBCS clusters with low x-ray luminosity, is located to the left of this plot, showing their large contamination due to projection effects. The lower panel shows the redshift-space correlation length with errorbars obtained from performing a power law fit to the measured redshift-space correlation functions over a range of scales dependent on the sample analysed , where h-1Mpc, and h-1Mpc (the ordering of samples in this panel is the same as in the previous one). There are signs of a weak correlation between the amplitude of the relative velocities and the correlation length for the cluster samples. According to the results from Paper I, the degree of projection effects correlates with both, the value of the relative velocities and the correlation length, so a similar trend in both parameters was expected; the deviations from this behaviour reflect the different minimum mass and X-ray flux thresholds in the different observational samples, which in the case of the mock samples with different was always the same by construction.
In a hierarchical scenario of structure formation it is expected that cluster relative velocities should not be larger than galaxy pairwise velocities (). The observations suggest apparent large pairwise velocities , an effect which could have a large contribution from redshift measurement errors, and even more important contributions from large systematics due to projection biases present in some of the samples identified from angular data.
This is the case with Abell clusters and the XBACS sample, except when considering subsamples of clusters with low BM type. Large relative velocities are inferred for luminous EBCS clusters, giving hints for the presence of contamination due to projection effects. However, the results for EBCS of low x-ray luminosity, show significantly smaller pairwise velocities comparable to those found for the UZC groups, and consistent with the predictions of a hierarchical clustering scenario.
3.4 Bias factors
The comparison between the measured and predicted redshift-space correlation function can be used to obtain estimates of the bias parameter of the cluster sample under consideration, using equation 2. In figure 9 we show the different bias parameters obtained for the different samples analysed. The errors on the bias parameter come from the different results obtained from the comparison of levels of correlation function.
These values can be compared to what is expected from a particular CDM model, using the expression for an effective bias as presented in Padilla & Baugh (2002), which is a weighted average of the bias of a sample of clusters of mass , derived by Sheth, Mo & Tormen (2001), and requires knowledge of the space density of the cluster sample. The results from using this equation are valid if the cluster sample is complete above a minimum mass threshold.
We have derived approximate estimates of the number density of clusters by assuming that the cluster samples are complete above a minimum cluster mass limit. This rough approximation only applies to optically selected clusters since x-ray selected samples are flux-limited with a minimum mass which strongly depends on redshift. Then we calculate the space density of optical cluster samples by simply counting the number of objects up to a distance where the redshift distribution departs from the behaviour due to the influence of a selection function. The effective CDM bias for the measured cluster number densities are then derived straightforward following Padilla & Baugh (2002). Given the uncertainties in the assumptions mentioned before, and the large scatter between cluster richness and virial mass, we just provide a suitable upper limit for the bias parameter, namely the largest value obtained, , corresponding to the Abell sample with low BM type (this is equivalent to a mean intercluster separation h-1Mpc or a number density h3Mpc-3). This upper limit is shown as a dotted line in figure 9.
For some of the samples studied, the resulting bias parameters obtained from the minimisation are well above our estimated upper limit (figure 9). However, UZC groups, APM clusters, EBCS total sample and low x-ray luminosity subsample, and Abell clusters with high , show lower values of the bias parameter, compatible with our expectations.
4 An insight on the results from groups and clusters identified from redshift data
The UZC group sample was constructed by identifying galaxy systems from the 3D distribution of galaxies in redshift space from the Updated Zwicky catalogue. By inspection of figure 8, the great leap between the results of UZC groups relative velocities, and those obtained from samples of clusters identified from angular data, either in the optical or x-ray wavelength range, is clear. This is also apparent in figure 1, where the anisotropies present in the correlation function of the UZC groups show markedly flattened iso-correlation contours, a pattern we almost completely failed to reproduce by measuring the correlation function of other cluster samples throughout this paper with the exception of the low x-ray luminosity EBCS subsample.
In this section, we explore in more detail the relative velocities, redshift-space correlation lengths and bias parameters obtained from the correlation function of UZC groups as a function of group richness counts. We remark the difference between the number of member galaxies in a group and the values of from the previous analysis, for in this case the number of galaxies is associated to the identification process and not only to the number of redshift measurements in the field of a cluster.
We note that the number of member galaxies is correlated to some extent with the mass of the groups. This can be seen in figure 10, where we show the distribution of group virial masses for two different upper limits in number of member galaxies. The normalisation constant by which both distribution functions were multiplied, is set up so as to make the integral of the mass distribution function of groups with equal to . It can be seen that the sample with a low upper limit for (dark shaded area) shows a marked relative lack of high mass groups when compared to the sample with a high upper limit in member galaxies (light shaded area). One of the effects this leads to is the intrinsic change in the clustering amplitude of the different subsamples. It should be noted that samples with different in mock sample 2, are not affected by this bias. This is readily apparent when recalling a result from Paper I, where it was shown that this sample is consistent with a constant redshift-space correlation length for any value of .

Following the procedures given in sections 3.3 and 3.4, we calculate the relative velocities, redshift-space correlation functions, and bias corresponding to subsamples of the UZC groups with different number of member galaxies. The results can be seen in figure 11. The upper panel shows values for the relative velocities which are consistent with the published value of km/s (Padilla et al. 2001) for any value of . There are also signs of a somewhat larger value of for small , but within the size of the errorbars. The middle panel shows the values of as a function of . As can be seen, there is a tendency for higher values of as the number of member galaxies increases. This increase is also present in the measurements of bias factors, shown in the lower panel, and is consistent with the results from figure 10, which show an increasingly larger average mass for samples with larger . The higher the average mass of a sample, the higher its correlation amplitude and bias factor will be. The increase in and bias factor are only noticeable for . Most of the samples with a larger number of member galaxies show stable and constant results for the three parameters in study, , and bias factor, in good agreement with the results obtained from mock sample 2, which also showed this behaviour. The errorbars in figure 11 shown for and bias factor are obtained from the different results obtained by using five correlation function amplitudes ( and ).
The main conclusion of this section is the remarkable stability of the results for the UZC groups. This provides a clear indication that redshift space identification of clusters is a powerful procedure to obtain samples with no significant contamination. The weak dependence of the results on a wide range of number of member galaxies reflects the reliability of the identification procedure.

5 Conclusions
We have explored the correlation function of clusters in redshift space for different observational samples of galaxy clusters. We have studied the consequences of different observational issues on the distortion of the clustering pattern, such as different sources of cluster identification, number of redshift measurements, cluster morphology and X-ray luminosity.
Padilla et al. (2001) showed that the results from groups of galaxies identified from 3-dimensional information available in the UZC, are consistent with the hierarchical clustering paradigm which predicts that we should be able to find objects that are still falling towards more massive structures. This can be observed in the anisotropy of the correlation function contours of the UZC groups, which shows the flattening produced by this infall motion. This is not easily detectable for galaxies since they are in a strongly non-linear regime and the pairwise peculiar velocities dominate the dynamics.
The automatic cluster finding algorithms used in the identification of APM clusters, make them a more reliable sample of clusters, which have been shown to be largely free of projection effects. Although contamination can not be totally excluded, the inclusion of an error in the APM cluster distance measurement is sufficient to account for for the elongations found in the APM clusters redshift-space correlation function (Padilla & Baugh 2002).
On the other hand, Abell clusters show clear signs of projection effects (this work, Sutherland 1988; Sutherland & Efstathiou 1991; see also Lucey 1983), which can be reduced by restricting the sample of clusters in richness class (Miller et al. 1999), for example. In this work, we found that the elongations in the correlation function isopleths can be reduced when restricting the sample to have a low BM type, which is a measure of the regularity of the galaxy distribution in a cluster. We have also shown that this could be related to an increase in the richness of the clusters considered, since our correlation function measurements show an increase in the correlation length. This makes sense, given that it is reasonable to suppose that richer clusters of galaxies have a more regular shape. In the end, the anisotropies left after the restriction of the Abell sample cannot be easily reconciled with errors in distance measurement from using a small number of galaxies. The results indicate the presence of galaxies not physically bounded to the cluster, and also a fraction of spurious clusters resulting from structures along the line of sight.
This situation is not significantly improved in the case of X-ray clusters. Even though the XBACS sample is composed of Abell clusters with confirmed emission in X-rays, they also show significant elongations along the line of sight when compared to the results from the Abell sample. We found that restricting the sample of XBACS clusters to have a low BM type produces a decrease in the elongation of the iso-correlation contours along the line of sight.
On the other hand, EBCS clusters, which are identified primarily as X-ray sources, show an interesting behaviour that deserves further attention. Low X-ray luminosity clusters, W show little correlation function anisotropy indicating the lack of significant projection effects. Clusters of high X-ray luminosity, on the other hand, exhibit strong line of sight distortions, indicating the presence of large biases in this subsample. It can be argued that luminous clusters are more distant and therefore most strongly affected by contamination effects that could bias distance and x-ray luminosity estimates.
The results shown in figures 8 and 9, which correspond to observational datasets identified from angular data, indicate that the values of relative velocities obtained from cluster samples are usually well over the values preferred by hierarchical clustering. It is also noticeable the large variations in redshift-space correlation lengths which, as shown in Paper I, is also influenced by the level of contamination present in the sample. Those observational samples less affected by projection effects, show values of the bias parameter compatible with a suitable upper limit inferred using a number density threshold h3Mpc-3 (equivalent to a mean intercluster separation h-1Mpc), and a CDM model in combination with the Sheth, Mo & Tormen (1999) mass function.
With the advent of surveys of the next generation, the construction of new group and cluster catalogues from deep spectroscopic data based on accurate photometry, will provide more reliable and well controlled cluster samples. In the light of our results for presently available samples, we find that detailed analysis of the redshift-space correlation function anisotropies can give a deep insight on sample characteristics and invaluable information on their implications.
Acknowledgments
This work was supported in part by CONICET, Argentina, and the PPARC rolling grant at the University of Durham. DGL acknowledges support from the John Simon Guggenheim Memorial Foundation. We thank the Referee for invaluable comments and advice which greatly improved the previous version of the paper. We have benefited from helpful discussions with Carlton Baugh. We acknowledge the Durham Extragalactic Astronomy Group and the Virgo Consortium for making the Hubble Volume simulation mock catalogues available.
References
- [] Abadi, M.G., Lambas, D.G., Muriel, H., 1998, ApJ, 507, 526.
- [] Bahcall, N.A., Cen, R.Y., Gramann, M., 1994, ApJ, 430, L13.
- [] Bahcall, N.A., Soneira, R.M., 1983, ApJ, 270, 20.
- [] Bahcall, N.A., Soneira, R.M., Burgett, W.S., 1986, ApJ, 311, 15.
- [] Bautz, L.P. & Morgan, W.W., 1970, ApJ, 162, 149.
- [] Borgani, S., Plionis, M., Kolokotronis, V., 1999, MNRAS, 305, 866.
- [] Cole, S., Hatton, S.J., Weinberg, D.H., Frenk, C.S., 1998, MNRAS, 300, 945.
- [] Collins, C.A., Guzzo, L., Boehringer, H., Schuecker, P, Chincarini, G., Cruddace, R., De Grandi, S, MacGillivray, H.T., Neumann, D.M., Schindler, S., Shaver, P., Voges, W., 2000, MNRAS, 319, 939.
- [] Croft, R.A.C., Efstathiou, G., 1994, MNRAS, 268, L23.
- [] Croft, R.A.C., Dalton, G.B., Efstathiou, G., Sutherland, W.J., Maddox, S.J., 1997, MNRAS, 291, 305.
- [] Dalton, G.B., Efstathiou, G., Maddox, S.J., Sutherland, W.J., 1992, ApJ, 390, L1.
- [] Dalton, G.B., Efstathiou, G., Maddox, S.J., Sutherland, W.J., 1994, MNRAS, 269, 151.
- [] Dalton, G.B., Maddox, S.J., Sutherland, W.J., Efstathiou, G., 1997, MNRAS, 289, 263.
- [] Davis, M., & Peebles, P.J.E., 1983, ApJ, 267, 465.
- [] Ebeling, H.; Voges, W.; Bohringer, H.; Edge, A. C.; Huchra, J. P.; Briel, U. G., 1996, MNRAS, 281, 799.
- [] Ebeling, H.; Edge, A. C.; Allen, S. W.; Crawford, C. S.; Fabian, A. C.; Huchra, J. P., 2000, MNRAS, 318, 333.
- [] Eisenstein, D., & Hu, W., 1998, ApJ, 496, 605.
- [] Evrard, A. E.; MacFarland, T. J.; Couchman, H. M. P.; Colberg, J. M.; Yoshida, N.; White, S. D. M.; Jenkins, A.; Frenk, C. S.; Pearce, F. R.; Peacock, J. A.; Thomas, P. A. 2002, ApJ, 573, 7.
- [] Huchra, J.P., & Geller, M.J., 1982, ApJ, 256, 423.
- [] Lucey, J. R., 1983, MNRAS, 204, 33.
- [] Lumsden, S.L., Nichol, R.C., Collins, C.A., Guzzo, L., 1992, MNRAS, 258, 1.
- [] Miller, C.J., Krughoff, K.S., Batuski, D.J. & Hill, J.M., 2002, AJ, 124, 1918.
- [] Miller, C.J., Batuski, D.J., Slingend, K.A., Hill, J.M., 1999, ApJ, 523, 492.
- [] Netterfield, C. B. et al., 2002, ApJ, 571, 604.
- [] Padilla, N.D., & Lambas, D.G., 2003, MNRAS, submitted (Paper I).
- [] Padilla, N.D., & Baugh, C.M., 2002, MNRAS, 329, 431.
- [] Padilla, N.D., Merchan, M.E., Valotto, C.A., Lambas, D.G., Maia, M.A.G., 2001, ApJ, 554, 873.
- [] Peacock, J. A. & West, M.J., 1992, MNRAS, 259, 494.
- [] Postman, M., Huchra, J.P., Geller, M.J., 1992, ApJ, 384, 404.
- [] Sheth, R.K., Mo, H.J., Tormen, G., 2001, MNRAS, 323, 1.
- [] Struble, M.F. & Rood, H.J., 1999, ApJS, 125, 35.
- [] Sutherland, W., 1988, MNRAS, 234, 159.
- [] Sutherland, W.J., Efstathiou, G., 1991, MNRAS, 248, 159.
- [] van Haarlem, M.P., Frenk, C.S., White, S.D.M., MNRAS, 1997, 287, 817.