The surprising Far-UV spectrum of the polar BY Camelopardalis ††thanks: This work is based on data obtained from the NASA-CNES-CSA FUSE mission
We report on the first far-UV observations of the asynchronous polar BY Cam made by the Far-Ultraviolet Spectroscopic Explorer (FUSE). The source is known to exhibit the most extreme NV/CIV emission resonance line ratio observed among polars. The FUSE observations reveal a OVI resonance line weaker than in the prototype of polars, AM Her, with the absence of a detectable narrow component. The OVI broad line is detected with an equivalent width of the same order as in AM Her, the blueward doublet component is clearly present but the redward component is strongly affected by H2 absorption. The presence of a strong NIII line and weak CIII lines also confirms the peculiar CNO line flux. We compare the resonance CNO line intensities with the predictions of the CLOUDY plasma code coupled to a geometrical model of the accretion column. Varying the temperature and/or intensity of the ionising spectrum is unable to reproduce the observed broad line ratios. A solution is obtained by significantly altering the element abundances with a strong depletion of C, overabundance of N and a weak underabundance of O. This confirms previous suggestions of non-solar abundances which may result from redistribution in the accreted material following nova outbursts and/or the secondary nuclear evolution. A very significant H2 absorption is observed in front of the source, a possible indication for either the existence of a dense interstellar cloud or of circumstellar material.
Key Words.:
accretion, stars: individual: BY Cam, white dwarfs, cataclysmic variables, binaries:close, X-rays: H0538+608 , ultraviolet emission1 Introduction
The hard X-ray source H0538+68/BY Cam was identified as a polar, a cataclysmic binary with a highly magnetized (B G) accreting white dwarf, after the detection of circularly polarized optical flux by Remillard et al. (1986). It was shown to exhibit a very peculiar UV emission line spectrum, with an emission resonance line ratio NV/CIV, more than ten times larger than what is usually observed in Polars (Bonnet-Bidaud & Mouchet 1987 (BM87)). It has been suggested that this unusual feature could be the result of a chemical evolution of the secondary, or of an unnoticed nova event leading to a CNO redistribution (BM87, Mouchet et al. 1990a). The discovery that the source is slightly desynchronised (Silber et al. 1992) and the identification of a known nova, V1500 Cygni, as a polar which is also desynchronised (Schmidt & Stockman 1991), gave further arguments to the nova hypothesis. However the picture has gradually changed as at least two synchronous polars, V1309 Ori (Szkody & Silber 1996) and MN Hya (Schmidt & Stockman 2001), have now been found to show a large NV/CIV ratio though less extreme than in BY Cam. The origin of these anomalous line strengths among polars is not clear. It might obviously result from non-solar abundances in the accreted matter but could also be due to peculiar ionisation conditions. These effects may strongly affect our understanding of the evolution of these systems and their link to novae.
The FUSE satellite, operating in the range 905-1187Å offers access to the OVI resonance line, a key for evaluating the CNO abundances. We report here on the first observation of BY Cam by this satellite. These observations were simultaneous with RXTE and EUVE observations as well as optical spectroscopy with the 3.5m APO telescope and with the 9m HET, and photometry at the 16” Braeside telescope whose results, including a temporal analysis, will be reported elsewhere.
2 FUSE observations and reduction
BY Cam was observed on 2000 January 10 and 16 by the FUSE satellite (Moos et al. 2000, Sahnow et al. 2000). The total wavelength range of 905-1187Å is covered by means of four gratings and mirrors leading to bandpasses of about 200Å, in such a way that the region below 1000Å is covered by two detectors, the central region by four and the region above 1100Å by two. During the first observation, the source was badly centered in the aperture and only the Jan. 16 data are presented below. The dataset consists of five exposures in the large aperture (30”x30”), with exposure times ranging from 3.44 to 5.42 ks, resulting in a total 22 ks on-source time. This covers two orbital cycles with only a small orbital phase interval (0.12) not covered. The source was in the satellite continuous viewing zone and observations occurred mainly during ’day’ time, leading to the presence of strong geocoronal lines.
The data have been reduced using the Calfuse 1.7.3 version of the standard pipeline. For each detector the five exposures were co-added with an eventual wavelength shift correction of one pixel. Velocity measurements have been corrected for the error in the heliocentric velocity value present in this calibration pipeline version. As the source is faint, the resulting signal-to-noise ratio per resolution element is quite low (less than 3) so the original (0.005Å) data have been binned into 0.1Å intervals. We report here on the mean phase-averaged spectrum.
3 The average spectrum
The average spectrum obtained by combining all detectors and exposures is shown in Fig. 1 where the strongest geocoronal lines have been removed for clarity. Some regions, such as around the NIV/HeII/H and HeII lines, are however possibly still contaminated by airglow and should be treated with care.
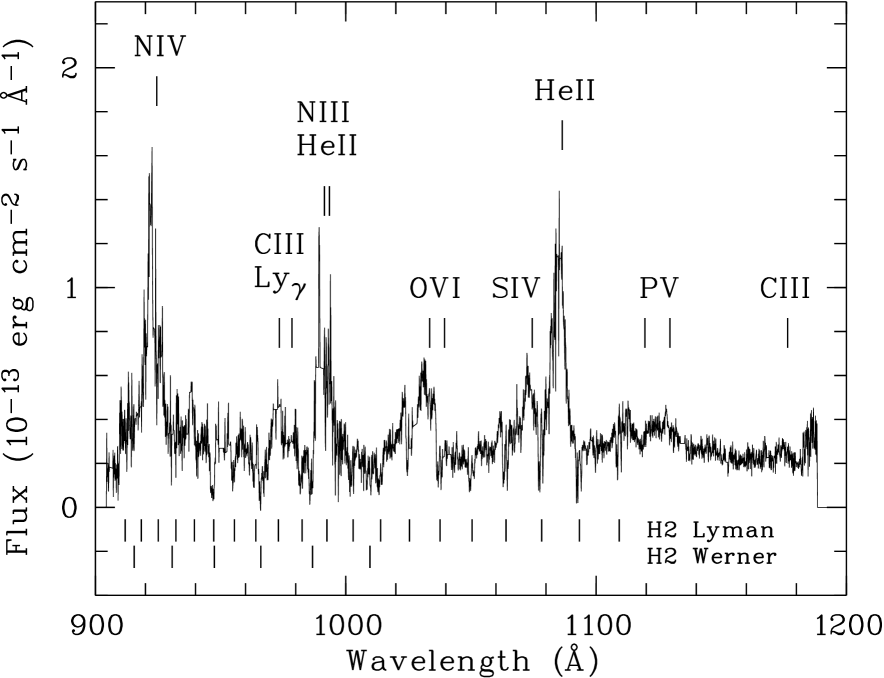
The continuum energy distribution is consistent with an extrapolation of the IUE high state spectrum. It can be described with a energy power law F if no reddening is assumed (-2.44 for EB-V = 0.05 (BM87)) with a total luminosity L(910-1185Å) of erg s-1 ( erg s-1 for EB-V = 0.05), assuming the source at 250 pc (Gänsicke 1997) and a Cardelli extinction law (Cardelli et al. 1989) with a standard AV/EB-V = 3.1 value. Broad emission lines are identified in Fig. 1, with intensities listed in Table 1. Pronounced H2 molecular lines of the Lyman and Werner series are also clearly present (see Sect. 4.1).
| Line | (Å) | Flux(1) | EW (Å) |
|---|---|---|---|
| N IV/HeII/H | 923 | 4.8(+) | 14.5 |
| CIII | 977 | 0.6(+) | 2.7 |
| N III/ HeII | 989-92 | 2.6 | 10.2 |
| O VI | 1032-38 | 2.0 | 8.2 |
| S IV | 1073 | 0.8 | 2.1 |
| He II | 1085 | 4.1(+) | 11.0 |
| C III | 1175 | 0.1 | 0.6 |
(1) Line flux in units of 10-13 erg cm-2 s-1
not corrected for reddening and/or N
(+) possibly contaminated by airglow
| Narrow | Broad | |||
|---|---|---|---|---|
| 1032 | 1038 | 1032 | 1038 | |
| BY Cam Flux (*) | 0.04 | - | 1.4 | 1.1 |
| AM Her Flux (*) | 6.6 | 5.9 | 12.8 | 7.7 |
| BY Cam EW (Å) | 0.15 | - | 5.2 | 4.4 |
| AM Her EW (Å) | 2.3 | 2.1 | 4.6 | 2.8 |
(*) Line flux in units of 10-13 erg cm-2 s-1
For AM Her : intensities derived from the mean ORFEUS spectrum (Mauche & Raymond (1998))
For BY Cam: intensities derived assuming a FWHM of 0.5Å
(narrow) and 4Å (broad) and corrected for H2 molecular absorption.
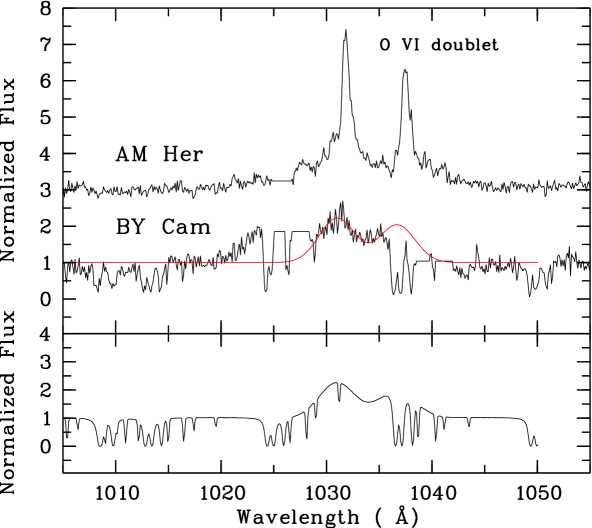
Figure 2 shows an enlargement of the OVI line region. The OVI doublet in BY Cam is rather broad and weak, with the OVI 1038 component affected by strong H2 absorption. For comparison, the phase-averaged ORFEUS spectrum of AM Her (Mauche & Raymond 1998), computed from retrieved archived data, is also shown in Fig. 2. Contrary to AM Her (see also Hutchings et al. 2002), no narrow OVI component is detected in BY Cam.
The OVI broad line intensities have been derived by fitting two gaussians of same widths (FWHM of 1200 km s-1), at the doublet separation, convolved with an absorption with a H2 column density of 3 molecules cm-2 (cf. Sect. 4.1). The results are given in Table 2 and the best fit is shown in Fig. 2 (lower panel). Uncertainties in the doublet flux measurements have been computed by varying the amplitude of each gaussian around the best value. They are given for the 99% confidence level, corresponding to a variation of 6.6 for a one parameter-fit. Line intensities corrected for H2 absorption and corresponding errors are and 10-13 erg cm-2 s-1, respectively for 1032 and 1038. Some caution should however be taken in interpreting the redward component intensity since it is affected by a strong H2 absorption and its red wing is also contaminated by an OI airglow contribution. For AM Her, the OVI total (broad+narrow) equivalent width is larger than for BY Cam but the equivalent width of the broad component alone is of the same order. The doublet intensity ratio of the broad component is also significantly different with a ratio of 1.3 for BY Cam and 1.7 for AM Her. Assuming the source at 250 pc, the OVI broad line luminosity is erg s-1, after correction for a EB-V = 0.05 interstellar reddening. This can be compared to the dereddened NV(1240) and CIV(1549) luminosities of erg s-1 and erg s-1 respectively, derived from IUE observations (Zucker et al. 1995, Mouchet et al. 2002). The mean ratios NV/CIV and OVI/CIV are 5.7 and 1.14 for BY Cam, while they are equal to 0.12 and 0.34 for AM Her. For this source, the values are derived from HUT spectra which wavelength range includes the three resonance lines (Greeley et al. 1999) and refer to the broad component only. Note however that for BY Cam the values obtained at different epochs are also affected by a mean intrinsic 35% variability (Mouchet et al. 1990b, Zucker et al. 1995).
Contrary to AM Her, no strong narrow OVI line is observed in BY Cam, as shown in Fig. 2, where spectra for both sources are orbitally phase averaged. For BY Cam, the radial velocity amplitude of 250 km s-1 as derived for the optical narrow components (Mouchet et al. 1997), will introduce a broadening but will not be sufficient to smear out a narrow component (FWHM 0.5Å) as intense as in AM Her. The absence of narrow lines in BY Cam may be due to the absence of a strong soft X-ray component in BY Cam. However the polar VV Pup which is a soft X-ray source, does not either show obvious narrow components in the OVI lines (Hoard et al. 2002). Note that no conclusion can be drawn about the presence of a narrow component in the NV and CIV lines of BY Cam due to the lack of high resolution UV spectra.
4 Discussion
4.1 The column density of molecular hydrogen
Several H2 absorption lines of the Lyman and Werner electronic system
bands are clearly detected in the average FUSE spectrum of BY Cam.
The spectrum of molecular hydrogen was modelled assuming specific values of the
total column density, a temperature of 80K and a b Doppler factor of
10 km s-1.
The wavelengths, oscillator strengths and total radiative lifetimes of the
upper levels of H2 transitions are given by Abgrall et al. (2000).
The signal-to-noise ratio is too low to perform a fitting
of the complete spectrum as done in FUSE studies towards translucent
interstellar clouds (cf. Ferlet et al. 2000). We have compared
the equivalent width measurements of the strongest H2 lines
absorbed from the J=0, 1, and 2 levels in the v’-0 Lyman bands
with v’ = 0 to 4, with those measured in the models.
A best fit value is obtained
for a H2 column density N of
molecules cm-2.
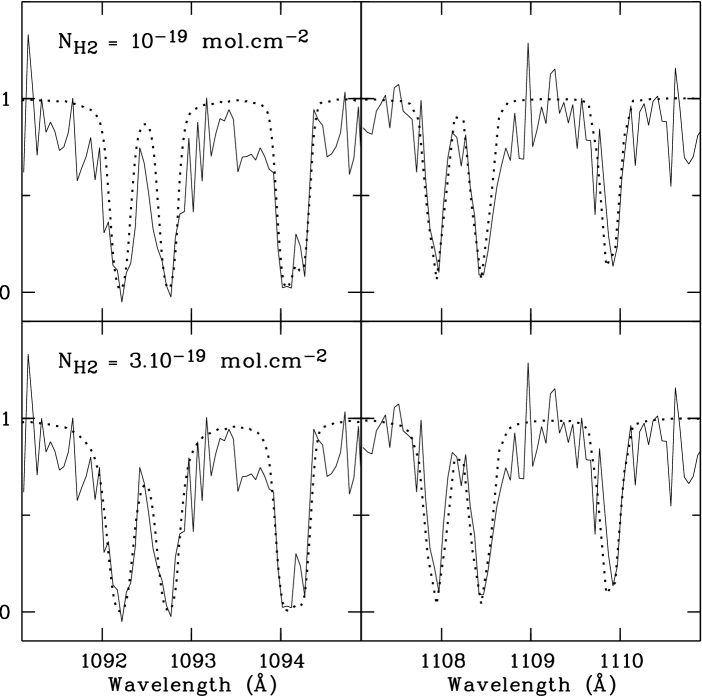
The model spectra for the Lyman (0,0) and (1,0) bands are displayed
in Fig. 3 for 2 different values of the H2
column density of 1 and 3 molecules cm-2 together with
the observed spectrum in the relevant spectral windows.
The derived H2 column density of molecules cm-2
should be correct within a factor of 2.
When using the R(0) and R(1) lines only, a model with a lower b value of
3 km s-1 is marginally favoured.
The presence of the R(3) component at 1067.6Å and possibly at 1054.0Å
seems to indicate a higher excitation temperature, but the quality of the
spectra does not allow a reliable determination of its value.
The individual spectra are also relatively noisy
so that it is not possible to check reliably for possible changes with
orbital phase.
From the absorption bump around 2200 Å , an upper limit of
E 0.05 has been derived for the source (BM87), which
corresponds to a neutral H density
N cm-2 (Shull & Van Steenberg 1985).
This value is also consistent with the equivalent neutral H column density
N cm-2 derived from
the absorption cut-off in the X-ray spectra (Kallman et al. 1993, 1996).
Taken at face value, this implies a very high
N/N ratio in the
direction of the source.
Assuming a standard interstellar medium, the expected
N value, consistent with the observed reddening, is only in
the range
cm-2 (Savage et al. 1977).
A large N value is unexpected for a relatively nearby source.
It may result from an inhomogeneous interstellar medium with a
molecular cloud in the line of sight
but may also be linked with dense matter close to the source, possibly
ejected during a prior nova event.
Note that such H2 absorption has also being detected in the FUSE
spectra of the supersoft binary
QR And and has been suggested to come from a circumbinary location
(Hutchings et al. 2001).
The present FUSE absolute wavelength calibration is not accurate
enough to derive precise values of the H2 line velocities and the
systemic velocity
of BY Cam is also not well known (in the range 1.3 - 141 km s-1,
Mason et al. 1989, Silber et al. 1992) so that no direct conclusion can
yet be drawn about the possible circumbinary nature of the H2 cloud.
4.2 Model of the OVI line and CNO abundances
The broad resonance lines of the highly ionised species of CIV, NV, and OVI (FWHM 1200 km s-1) are expected to be formed mainly in the accreting column, photoionised by the X-ray flux. Different attempts have been made to reproduce the line ratios using photoionisation models with a simplified geometry (cf. Mauche et al. 1997). We evaluate here the line luminosities computed using the CLOUDY plasma code (Ferland et al. 1998), coupled to a geometrical model of the accretion column. The ionising spectrum was defined as the sum of a 20 keV bremsstrahlung, as observed in the RXTE observations, and of a 50 eV blackbody with a bolometric luminosity of 0.1 times the hard X-ray luminosity (Ramsay et al. 1994). We have modelled the accretion column assuming a dipole geometry and free-fall velocities along the accretion column (cf. Stockman & Schmidt 1996). The density then varies with the distance to the white dwarf, of radius Rwd, as (Langer et al. 1982). We have set n0, the density at the basis of the column, equal to cm-3, corresponding to an accretion rate of g s-1, in agreement with the total X-ray luminosity of 6.6 erg s-1 for a distance of 250 pc (Ramsay et al. 1994) and assuming a typical value of 1016 cm2 for the polar cap surface, and a 0.8 M☉ white dwarf. The accretion column was approximated by a succession of different slabs of constant densities with a maximum extension chosen so that the density drops by a factor 4 from one slab to the next, up to a maximum extension of 50 times the white dwarf radius, i.e. about 1/4 of the Roche lobe radius (Mouchet et al. 1997). The lateral extension of each region was assumed to follow the dipole geometry with a size varying as (r/Rwd)3/2. The illumination was approximated to be sideways which, taking into account of the bending of the column, is only true for the furthest parts of the column. We have verified however that, in all cases, the lowest slabs of higher densities do not contribute significantly to the total flux of the lines considered (Mouchet et al. 2002).
The luminosities of the three resonance lines CIV(1549), NV(1240) and OVI(1035) were computed with this model, first assuming solar abundances. The results are shown in Fig. 4, where the N/C and O/C ratios are reported. Compared to the observed values, these ratios are significantly underestimated in this case. Changing the backbody temperature from 50 eV to 10 eV reduces significantly the N and O luminosities and does not improve the situation (see Fig. 4). However, a hidden very soft X-ray component, contributing significantly to the ionising flux, could still be present. For a neutral H column density of cm-2, it is found that a 10 eV blackbody component with a luminosity similar to that of the bremsstrahlung component, could remain undetected and still be compatible with the flux upper limit at 100 Å of erg cm-2 s-1Å-1 derived from the EUVE observations. Though increasing significantly the N and O luminosities, it still falls short of the observed N/C and O/C ratios by factors 10 and 3 respectively. We therefore compute next the exact effect of varying the element abundances. An N abundance 10 times greater than the solar value was first considered. Since parts of the column are optically thick, the N line luminosity is not increased proportionally but only by a factor 4, with a corresponding small decrease in the C and O lines but not sufficient to reproduce the observed values (see Fig. 4). Assuming our adopted model to be valid, the observed line ratios require highly non-solar abundances. As the BY Cam line luminosities are somewhat variable, we did not attempt here to obtain an exact fit in the abundances but we show in Fig. 4 a combination where C, N and O are respectively lower by a factor 25, higher by 8 and lower by 2, compared to solar values. With these non-solar abundances, the observed dereddened ratios are well reproduced, within a factor 1.01 and 1.22, respectively for NV/CIV and OVI/CIV. Other combinations may of course be valid and a more detailed modelling will be presented elsewhere (Bonnet-Bidaud et al. 2003, in preparation). These first precise computations of the abundance effects confirm our previous suggestions (BM87, Mouchet et al. 1990a) that the peculiar line intensities in BY Cam may be due to a conjugated overabundance of N with a underabundance of C. The strong line of NIII (990Å) observed here (as NIV (1718Å)), together with the weaknesses of the CIII lines at 977Å and at 1175Å, confirm this. The oxygen abundance deviates only slightly from the solar value.

4.3 Origin of the peculiar CNO composition
The explanation of such highly non-solar values for some elements is still pending. The nova hypothesis is tempting as the by-product of the H-burning CNO cycle is a 14N production at the expense of 12C, leading to a CN redistribution. But the recent nova V1500 Cyg does not show abnormal UV line intensities (Schmidt et al. 1995), and the ejecta observed in a large sample of novae show enrichment in all three C, N, O elements (Livio & Truran 1994), indicating dredge-up of matter from the underlying CO core (Starrfield et al. 2000). However multicycle models lead to a rearrangement of CNO abundances by reprocessing a large quantity of carbon and some fraction of oxygen into nitrogen (Kovetz & Prialnik 1997). Enhancement of N and depletion of C can indeed be obtained in the context of evolutionary models of semi-detached systems in which the secondary surface is polluted by re-accretion of material ejected during nova outburts (Marks & Sarna 1998). But the enrichment by a nova-type explosion requires efficient re-accretion of the burnt material as pointed out by Stehle & Ritter (1999).
As about 1/3 of cataclysmic variables might descend from supersoft X-ray binaries (Schenker et al. 2002), the required CNO composition in BY Cam can result from steady nuclear burning phases which occur during this evolutionary stage. Interestingly, one of these sources, XMMU J004319.4+411758, might be a progenitor of a magnetic cataclysmic variable (King et al. 2002). We note that weak thermonuclear runaways can also have occurred in dwarf novae such as U Gem for which the white dwarf spectrum reveals a depletion of carbon (Sion et al. 1998) or such as BZ UMa and EY Cyg whose UV spectra exhibit a strong NV line and a weak CIV line (Sion 2002, Szkody 2002).
Another possibility for the origin of the peculiar composition requires an evolved secondary whose external layers have been stripped off during episodes of mass loss. Computed evolutionary paths of binary systems can produce partially nuclear evolved secondaries prior to contact (Howell 2001), if the donor star is sufficiently massive (Haswell et al. 2002). This might explain the pathological CNO UV line ratios observed in the long period system AE Aqr (Mouchet et al. 2002), as it has been demonstrated by Schenker et al. (2002), but evolutionary models adapted for the orbital parameters of BY Cam have still to be computed.
Stronger constraints on the abundance values should be obtained from the H-like and He-like lines of C,N, and O which are accessible with XMM-Newton and Chandra. Indeed the first XMM-Newton RGS spectra of BY Cam show emission lines tentatively identified with NVI and NVII lines (Ramsay & Cropper 2002). Other hydrogen-like and helium-like lines of C and O are expected in the RGS range. Longer exposed spectra are needed to achieve a detailed model of the X-ray emitted plasma that would provide a good evaluation of the CNO abundance.
Acknowledgments. We are very grateful to Alain Lecavelier des Etangs for his helpful support in FUSE observing preparation and data reduction.
References
- (1) Abgrall, H., Roueff, E., Drira, I. 2000, A&AS, 141, 297
- (2) Bonnet-Bidaud, J.M., Mouchet, M. 1987, A&A, 188, 89
- (3) Cardelli, J.A., Clayton, G.C., Mathis, J.S. 1989, ApJ, 345, 245
- (4) Ferland, G.J., Korista, K.T., Verner, D.A., et al. 1998, PASP, 110, 761
- (5) Ferlet, R., André, M., Hébrard, G. et al. 2000, ApJ, 538, L69
- (6) Gänsicke, B.T. 1997, Ph.D. Thesis, Universit t G ttingen
- (7) Greeley, B.W., Blair, W.P., Long, K.S., Raymond, J.C. 1999, ApJ, 513, 491
- (8) Haswell, C.A., Hynes, R.I., King, A.R., Schenker, K. 2002, MNRAS, 332, 928
- (9) Hoard, D.W., Szkody, P., Ishioka, R., et al. 2002, AJ, 124, 2238
- (10) Howell, S.B. 2001, PASJ, 53, 675
- (11) Hutchings, J.B., Crampton, D., Cowley, A.P., Schmidtke, P.C., Fulleton, A.W. 2001, AJ, 122, 1572
- (12) Hutchings, J.B., Fulleton, A.W., Cowley, A.P., Schmidtke, P.C. 2002, AJ, 123, 2841
- (13) Kallman, T.R., Schlegel, E.M., Serlemitsos, P.J., et al. 1993, ApJ, 411, 869
- (14) Kallman, T.R., Mukai, K., Schlegel, E.M., et al. 1996, ApJ, 466, 973
- (15) King, A.R., Osborne, J.P., Schenker, K. 2002, MNRAS, 329, L43
- (16) Kovetz, A., Prialnik, D. 1997, ApJ, 477, 356
- (17) Langer, S.H., Chanmugam, G., Shaviv, G. 1982, ApJ, 258, 289
- (18) Livio, M., Truran, J.W. 1994, ApJ, 425, 797
- (19) Marks, P.B., Sarna, M.J. 1998, MNRAS, 301, 699
- (20) Mason, P.A., Ramsay, G., Andronov, I., et al. 1989, MNRAS, 295, 511
- (21) Mauche, C.W., Raymond, J.C. 1998, ApJ, 505, 869
- (22) Mauche, C.W., Lee, Y.P., Kallman, T.R. 1997, ApJ, 477, 832
- (23) Moos, H.W., Cash, W.C., Cowie, L.L. et al. 2000, ApJ, 538, L1
- (24) Mouchet, M., Bonnet-Bidaud, J.M., Hameury, J.M. 1990a, in “Accretion-Powered Compact Binaries”, ed C. Mauche (CUP), 247
- (25) Mouchet, M., Bonnet-Bidaud, J.M., Hameury, J.M., Acker, A. 1990b, ESA SP-310, 423
- (26) Mouchet, M., Bonnet-Bidaud, J.M., Somov, N.N., Somova, T.A. 1997, A&A, 324, 109
- (27) Mouchet, M., Bonnet-Bidaud, J.M., Abada-Simon, M., et al. 2002, in “Classical Nova Explosions”, eds M. Hernanz and J. José, AIP, 67
- (28) Ramsay, G., Cropper, M. 2002, MNRAS, 334, 805
- (29) Ramsay, G., Mason, K., Cropper, M., et al. 1994, MNRAS, 270, 692
- (30) Remillard, R.A., Bradt, H.V., McClintock, J.E., et al. 1986, ApJ, 302, L11
- (31) Sahnow, D.J., Moos, H.W., Ake, T.B., et al. 2000, ApJ, 555, 839
- (32) Savage, B.D., Drake, J.F., Budich, W., Bohlin, R.C. 1977, ApJ, 216, 291
- (33) Schenker, K., King, A.R., Kolb, U., Wynn, G.A., Zhang, Z. 2002, MNRAS, 337, 1105
- (34) Schmidt, G.D., Stockman, H.S. 1991, ApJ, 371, 749
- (35) Schmidt, G.D., Stockman, H.S. 2001, ApJ, 548, 410
- (36) Schmidt, G.D., Liebert, J., Stockman, H.S. 1995, ApJ, 441, 414
- (37) Shull, J.M., Van Steenberg, M.E. 1985, ApJ, 294, 599
- (38) Silber, A., Bradt, H.V., Ishida, M., et al. 1992, ApJ, 389, 704
- (39) Sion, E.M., Cheng, F.H., Szkody, P., et al. 1998, ApJ, 496, 449
- (40) Sion, E.M. 2002, in “Classical Nova Explosions”, eds M. Hernanz and J. José, AIP, 21
- (41) Starrfield, S., Truran, J.W., Sparks, W.M. 2000, New Ast. Rev., 44, 81
- (42) Stehle, R., Ritter, H. 1999, MNRAS, 309, 245
- (43) Stockman, H.S., Schmidt, G.D. 1996, ApJ, 468, 883
- (44) Szkody, P. 2002, in “Classical Nova Explosions”, eds M. Hernanz and J. José, AIP, 28
- (45) Szkody, P., Silber, A. 1996, AJ, 112, 239
- (46) Zucker, D.B., Raymond, J.C., Silber, A. et al. 1995, ApJ, 449, 310