Reappraising foreground contamination in the -DMR data
Abstract
With the advent of all-sky H surveys it is possible to determine a reliable free-free template of the diffuse interstellar medium (Dickinson, Davies & Davis 2003) which can be used in conjunction with the synchrotron and dust templates to correct CMB observations for diffuse Galactic foregrounds. We have used the -DMR data at 31.5, 53 and 90 GHz and employed cross-correlation techniques to re-evaluate the foreground contributions, particularly that due to dust which is known to be partially correlated with H (and free-free) emission.
The DMR microwave maps are found to contain, as well as the expected synchrotron and free-free components, a component tightly correlated to the 140 m dust maps of DIRBE. At 31.5, 53 and 90 GHz this emission is , and K/(MJy sr-1) at 140 m respectively. When corrected for the contribution from thermal dust following model 7 of Finkbeiner, Davis & Schlegel (1999), a strong anomalous dust-correlated emission component remains, which is well-fitted by a frequency spectrum of the form where 2.5 in the DMR frequency range; this is the dominant foreground at 31.5 GHz. The result implies the presence of an emission component with a dust-like morphology but a synchrotron-like spectrum. We discuss the possible origins of this component and compare it with the recent WMAP interpretation.
The better knowledge of the individual foregrounds provided by the present study enables a larger area of the sky () to be used to re-appraise the CMB quadrupole normalisation, , and the scalar perturbations spectral index, . We find with a power-law spectral index of . These values are consistent with previous -DMR analyses and the WMAP 1-year analysis.
keywords:
cosmic microwave background - cosmological parameters - radio continuum: general - ISM: dust, extinction1 Introduction
A major goal of cosmology is to determine the fundamental cosmological parameters that describe our Universe. Observations of anisotropies in the cosmic microwave background (CMB) provide unique data in achieving this goal through a determination of their power spectrum. An accurate measurement of the CMB power spectrum requires a good knowledge of the various Galactic foregrounds which have their own frequency and power spectra. This is particularly important for all-sky, high-sensitivity CMB experiments such as WMAP (Bennett et al. 2003) and Planck (Tauber 2000). For example, the CMB power spectrum expected from observations with the Planck satellite will be accurate to per cent over the -range ; this corresponds to a temperature accuracy of better than K over the angular range to 5 arcmin. The Galactic foregrounds should therefore be estimated to better than this value, otherwise the CMB data will be degraded. The -DMR data (Bennett et al. 1996) covering at frequencies of 31.5, 53 and 90 GHz are constrained by knowledge of the foregrounds; this is also the case for the the WMAP data, particularly on the largest angular scales discussed here. The challenge is to make use of the largest sky coverage possible to reduce the sample variance on such large angular scales (); the area available has normally been restricted to Galactic latitudes or . In this paper we attempt to improve on available knowledge of the foregrounds and apply it to the -DMR data in order to determine whether the fraction of sky available for cosmological assessment can be extended. The recent WMAP analysis of the 1st year observations (Bennett et al. 2003a) uses the 23 GHz channel as a basis for a Galactic mask which eliminates 21 per cent of the sky from detailed CMB analysis (Bennett et al. 2003b).
Previous studies of Galactic foregrounds relevant to the CMB at frequencies less than 100 GHz have used the 408 MHz map of Haslam et al. (1982) as the synchrotron template and FIR dust emission (IRAS or DIRBE) as a template for the free-free which was thought to be correlated with dust and Hi (Kogut et al. 1996a,b). It was widely established that at GHz a dust-correlated foreground was present (de Oliveira-Costa et al. 1997; Leitch et al. 1997; Kogut 1999) although it was at a level which significantly exceeded the free-free emission expected from the partial H surveys available at the time. This dust-correlated anomalous emission has been ascribed to spinning dust (Draine & Lazarian 1998a, hereafter DL98, 1998b) and appears to fit the expected narrow frequency spectrum (de Oliveira-Costa et al. 1998, 1999, 2000, 2002), although Mukherjee et al. (2001) weaken some of these arguments and claim that definitive statements about the origin of the dust-correlated component cannot be made based on data at 10 and 15 GHz alone. Bennett et al. (2003b) find a dust-correlated component which they interpret as synchrotron emission with a flatter spectral index. Lagache (2003), however, argues that this emission is intrinsic to the dust itself and arises from small, cold grains. This is discussed further in section 5.4.
A significant development now available for assessing and quantifying the Galactic foregrounds is the unambiguous identification of the free-free component independent of the quasi-correlated dust. The new H surveys by the Wisconsin H-Alpha Mapper, WHAM (Reynolds et al. 1998; Haffner 1999), and the Southern H-Alpha Sky Survey Atlas, SHASSA (Gaustad et al. 2001), now make this possible. They can be used to produce an all-sky free-free template when corrected for H absorption by dust and when evaluated at the electron temperature appropriate to the ionized gas in the local region of the Milky Way (Dickinson et al. 2003).
In the present paper, using cross-correlation techniques, we quantify the synchrotron and free-free emission, leaving a clearer estimate of the microwave emission associated with Galactic dust. We use the -DMR data at 31.5, 53 and 90 GHz (Bennett et al. 1996) to identify an anomalous dust-correlated component which previously contained an unknown amount of free-free emission. Our results are strengthened by including correlations with a 19.2 GHz survey of the sky (Cottingham 1987; Boughn et al. 1992).
Our present study leads to a frequency spectral index for the synchrotron emission; although varies with position this global value is adequate for predicting the actual (small) contribution at higher radio frequencies ( GHz). We also investigate the effects of dust absorption and electron temperature in deriving the free-free template.
Finally, we utilise our improved understanding of the three Galactic templates to re-examine the determination of the quadrupole normalization and the scalar fluctuation index from the -DMR data (Górski et al. 1996). We extend the area of sky available by using data closer to the Galactic plane and examine the stability of and values as a function of the latitude range included in the analyses.
2 DMR data and the foreground templates
2.1 Synchrotron template
The synchrotron emission from the Galaxy originates in relativistic cosmic ray (CR) electrons spiralling in Galactic magnetic fields. These electrons will have a a range of spectral energy distributions depending on their age and the environment of origin (e.g. supernova explosions or diffuse shocks in the interstellar medium). The variations in CR electron spectral index will translate into variations in the frequency spectral index of the synchrotron continuum emission. Synchrotron emission, with its temperature spectral index of to (), dominates over thermal bremsstrahlung (free-free) emission with at frequencies below GHz over most regions of the sky. Exceptions are the Galactic ridge and the brighter features of the local Gould Belt system (Dickinson et al. 2003)
The only all-sky map at sufficiently low frequency to provide a template of Galactic synchrotron emission is the 408 MHz survey by Haslam et al. (1982). This has a resolution of 51 arcmin and has a brightness temperature scale “absolutely calibrated” with the 404 MHz survey of Pauliny-Toth & Shakeshaft (1962).
In the present investigation we will derive (for the sky area analysed) a mean spectral index between 408 MHz and 19.2 GHz from the Cottingham (1987) survey and 31.5, 53 and 90 GHz from the -DMR survey. It is important to remember that the spectral index of Galactic synchrotron emission varies with frequency and position on the sky. The analysis of low-frequency surveys by Lawson et al. (1987) indicates that the brighter regions away from the Galactic plane have typical spectral indices of and at 100 and 800 MHz respectively. Furthermore, the value of evaluated between any pair of frequencies separated by a factor of varies typically by over the sky (Reich & Reich 1988). Bennett et al. (2003b) propose a model using WMAP data which includes a flat spectrum synchrotron component () in regions of star formation near the Galactic plane and a steep spectrum component () from the Galactic halo.
At frequencies higher than GHz no reliable zero levels can be measured for large-area surveys at intermediate and high latitudes where CMB measurements are normally conducted and as a consequence, large area spectral index maps cannot be made. However, the spectral index of smaller angular scale ( and less) structures can be estimated from cross-correlation analyses of maps at different frequencies. For example, Hancock et al. (1997) found a spectral index of at 10 GHz from bremsstrahlung data at 10,15 and 33 GHz. It is interesting to note that the steepening of the brightness temperature spectral index by 0.5 at higher frequencies expected from synchrotron losses would lead to at higher frequencies; this is the value at these frequencies expected from the local CR electron spectrum (Platania et al. 1998).
2.2 H free-free template
For the free-free template, we use the all-sky H template described in Dickinson et al. (2003). The all-sky map is a composite of H data from the WHAM survey of the northern sky (Reynolds et al. 1998; Haffner 1999) and SHASSA survey in the southern sky (Gaustad et al. 2001). The SHASSA data are first smoothed to the WHAM resolution of and are preferred at declinations . It should be noted that the all-sky template is a first attempt at producing a high-sensitivity all-sky H map. SHASSA data have significantly lower sensitivity than data from the WHAM survey; the noise levels are estimated as and Rayleigh () respectively, where photons s-1 cm-2 sr erg s-1 cm-2 sr for K gas. Baseline uncertainties exist in both data-sets, particularly SHASSA data which results in loss of information on angular scales for data at due to the field-of-view of each pointing. However, the SHASSA background levels are fitted to WHAM data where WHAM data exist () with an assumed cosecant law for declinations further south. The different observing strategies result in different beam shapes which have not been accounted for. Finally, large H signals (emission and absorption) from bright stars have been filtered using different techniques; the WHAM team use data from nearby unaffected pixels, while the SHASSA team use a median filter to reduce star residuals. However, all these possible systematics are significantly reduced when the data, at a resolution of , are convolved with the DMR beam at resolution. Indeed, we have explicitly verified this by comparing the power spectra of the high-latitude H emission after varying the latitude at which the surveys are matched and adjusting baselines. Recently, Finkbeiner (2003) has produced an all-sky H map at 6 arcmin resolution which includes higher resolution data from the Virginia-Tech Sky Survey (Dennison et al. 1998). The differences in the power spectrum of our H map with that given by Finkbeiner (2003) are less than 10 per cent for and less than 30 per cent everywhere.
The optical H line ( nm) is well known to be a good tracer of the free-free continuum emission at radio wavelengths since they are both emitted by the same ionized gas. Since they are both proportional to the Emission Measure () there is a well-defined relationship between the H line intensity and the radio continuum brightness temperature (Osterbrock 1989; Valls-Gabaud 1998; Dickinson et al. 2003). There is a strong dependence on frequency since free-free emission scales as at GHz frequencies. There is also a modest dependence on the electron temperature (). In the Galaxy, can range between 3000 K and 15000 K (Shaver et al. 1983); the majority of Hii regions have between 5000 and 10000 K (Reynolds 1985). Shaver et al. (1983) show that the mean electron temperature of Hii regions at the galactocentric radius of the Sun ( kpc) is 7200 K with an r.m.s. spread of 1200 K. In the region of the Galaxy covered in the present study where the ionized hydrogen will be typically within kpc of the Sun and accordingly we adopt a value of K. With this value of , the conversions from H to free-free continuum for frequencies 31.5, 53 and 90 GHz are 5.25, 1.71 and 0.54 K respectively. In section 4 we will use this prior information to allow a fixed free-free component to be subtracted giving a clearer separation of the foregrounds. We will take a variation of K from the local value of 7000 K as in indication of the upper and lower bounds allowed. Other caveats become important at the few per cent level: i) the helium abundance is usually taken to be 8 per cent with a spread of a few per cent ii) the emitting medium is assumed to be optically thick (case B) to the Lyman continuum photons.
A major uncertainty when using the H template is the absorption of H by foreground dust. The absorption can be estimated using the m maps given by Schlegel, Finkbeiner & Davis (1998, hereafter SFD). The absorption at H in magnitudes using their temperature-corrected column density map () in units of MJy sr-1 is then where is the fraction of dust in front of the H actually causing absorption in the line of sight. The corrected H intensity is then . Although there are uncertainties in this relationship due to different reddening values expected from different dust populations, the largest uncertainty is in , the fraction of dust lying in front of the H-emitting region. Dickinson et al. (2003) show that for a range of longitudes (), and for , , while for local high latitude regions such as Orion and the Gum Nebula, there is little or no absorption by dust (). For much of the high latitude sky, is MJy sr-1 and therefore the absorption is likely to be small ( mag). At lower Galactic latitudes , the dust absorption strongly increases to 1 mag and above. For the majority of the Galactic plane (), the absorption is too great to make any reliable estimate of the true H intensity.
Finally, the scattering of H light from dust at high Galactic latitudes could, in principle, cause a degeneracy in the analysis since the scattered H light would be directly correlated with the dust. However, Wood & Reynolds (1999) predict that this accounts for less than 20 per cent of high latitude H emission. Since the anomalous component is larger than the free-free component at frequencies higher than GHz (see sections 4 and 5), this systematic will not significantly affect our results within the errors.
2.3 Dust templates
As templates for the thermal and anomalous dust-correlated emission, we utilise the -DIRBE data repixelised into the HEALPix pixelisation scheme. This was achieved using the publicly available Calibrated Individual Observations (CIO) files together with the DIRBE Sky and Zodi Atlas (DSZA, both products being described in Hauser et al. 1998), allowing the construction of DIRBE full sky maps corrected for the zodiacal emission according to the model of Kelsall et al. (1998). In particular, we use the DIRBE 140 m data at resolution: although the 100 m data has the best sensitivity, there remain more noticeable artifacts present in the sky map after zodiacal correction. While this is not likely to present a problem after the data has been convolved with the DMR beam profile ( FWHM), our choice allows maximal consistency with previous analyses by the DMR team (Banday et al. 1996; Górski et al. 1996; Kogut et al. 1996a, 1996b). Furthermore, the SFD version of the 100 m sky map has been used to correct for dust absorption in the H template, thus our choice allows some additional independence in the dust correlation results.
DL98 have suggested that the anomalous dust-correlated signal which we re-investigate in this work should be significantly correlated with 12 m emission, so that the corresponding DIRBE sky map may prove a better tracer for this foreground component. However, the 12 m map contains residual zodiacal artifacts in the region of the ecliptic plane which remain significant even after smoothing to DMR resolution. The impact of this could be minimised by excluding a region close to the ecliptic plane, but we prefer to make use of the greatest sky coverage possible. Further, de Oliveira-Costa et al. (2002) have tested this hypothesis, but it is clear from their fig. 4 that even after considerable processing of the 12 m DIRBE data for the removal of both zodiacal emission and point sources, the longer wavelength data at 100, 140 and 240 m remain equally viable for correlation studies.
Finally, in order to attempt to isolate the anomalous dust-correlated component signal, it is necessary to identify and subtract the thermal dust emission. We have employed the predictions of Finkbeiner, Davis & Schlegel (1999, hereafter FDS) for the thermal dust emission at DMR wavelengths. FDS consider 8 models based on the 100 and 240 m maps from SFD, and test them against the -FIRAS data. The inconsistency of extrapolations of the SFD maps using single component power-law emissivity functions with the FIRAS data over the range 200 - 2100 GHz motivated the development of generalised two-component models. We have considered FDS models 7 and 8 as plausible tracers of the thermal dust component emission. Masi et al. (2001) have demonstrated that model 8 extrapolated to 410 GHz is well correlated with the BOOMERanG data at that frequency, and a recent analysis of the MAXIMA data (Jaffe et al. 2003) also see consistency with these extrapolated dust models. It should be remembered that the FDS models are formally correct only on scales comparable to or larger than the FIRAS beam, hence the FDS predictions of model 7/8 should be well-matched to our purposes.
2.4 -DMR data
In this analysis, we utilise the -DMR 4-year sky maps (Bennett et al. 1996) at 31.5, 53 and 90 GHz in Galactic coordinates and the HEALPix***http://www.eso.org/science/healpix/ pixelisation scheme with a resolution parameter of , corresponding to 12 288 pixels on the sky. Inverse-noise-variance weighted combinations of the A and B channels are formed at each of the three DMR frequencies, the weights being (0.618, 0.382), (0.579, 0.421) and (0.382, 0.618) at 31.5, 53 and 90 GHz respectively. The dominant feature visible in the sky maps (given that the dipole anisotropy of amplitude 3 mK is largely removed in the pre-map-making data processing) is the enhanced emission along the Galactic plane. This emission is indeed a combination of the synchrotron, free-free and dust emission that we are interested in, however, the distribution and spectral behaviour at the lowest latitudes () is sufficiently complex that we do not attempt to fit or model it, considering only the mid- and high-latitude Galactic emission. Contrary to previous analyses, we attempt to fit our templates to somewhat lower latitudes, the results of which are discussed in section 4.
2.5 19.2 GHz data
In addition to the -DMR data, we also consider correlations of the foreground templates with a 19.2 GHz survey of the sky (Cottingham 1987; Boughn et al. 1992). Such an investigation is clearly of interest here since 19.2 GHz is close to the frequency at which the DL98 models for spinning dust show a maximum in spectral behaviour. Even if the anomalous dust-correlated component is not the putative rotational dust emission, the coupling amplitude of the dust template at 19.2 GHz should enable the spectrum of this foreground to be established, in particular since the frequency of observation is well-removed from that where a significant thermal dust contribution is present. The data are available in the QuadCube format (White & Stemwedel, 1992) with 24,576 pixels on the full sky of size , and contains observations of angular resolution 3° FWHM. A small region close to the South Ecliptic pole was not observed. The typical noise level is quoted as 1.5 mK per resolution element, but there is both variation in the number of observations per pixel and pixel-pixel covariance. In contrast to the analysis of de Oliveira-Costa et al. (1998) we take account of the former, but the information is not available for the latter. Some attempt to provide additional constraints on the noise uncertainty is performed by scaling the noise level by a factor in the range 0.9 - 1.1, and including this parameter in our later statistical analysis.
3 Analysis method
Each of the three DMR maps, the 19.2 GHz data, and the foreground sky map templates (after convolution to the correct angular resolution) are decomposed into harmonic coefficients using a basis of orthonormal functions explicitly computed on the incompletely sampled sky (Górski 1994), a procedure which is directly analogous to the expansion of a full-sky map in terms of spherical harmonic coefficients. This technique has the advantage of allowing exact exclusion of the monopole and dipole components from the analysis (which are unimportant for the investigation of cosmological anisotropy), and makes full use of all of the available spatial (phase) information.
We have adopted several definitions for the area of sky coverage, in particular the standard Galactic cut defined as the region with Galactic latitude, , above 20 with additional regions at Ophiuchus (up to at ) and Orion (down to at ) based on the DIRBE 140 m map (Banday et al. 1997, but recomputed explicitly for the HEALPix scheme), together with more aggressive and conservative cuts of greater than 15 and 30 respectively. For each sky coverage a new basis of orthonormal functions is computed. This procedure must also be performed separately for the 19.2 GHz data due to its different pixelisation scheme and pixel resolution (and indeed for the foreground templates matched to the same pixelisation and angular resolution).
The measured map coefficients in the new orthogonal basis at a given frequency, , can then be written in vector form as where , and are the coefficients describing the true CMB distribution, the noise and one foreground template map respectively. is now a coupling constant (with units K ) to be determined by minimizing
| (1) |
where M̃ is the covariance matrix describing the correlation between different Fourier modes on the cut-sky and is dependent on assumed CMB model parameters and the instrument noise. Full details of its computation can be found in Górski (1994) and Górski et al. (1996).
By minimising the with respect to we find that the coupling constant has an exact solution
| (2) |
and a Gaussian error given by
| (3) |
The contribution of component to the observed sky is the map (where is in the natural units of the foreground template map so that this scaled quantity is in K).
In this analysis, however, we treat multiple foreground templates and all three DMR channels simultaneously. This forces the CMB distribution (in thermodynamic units) to be invariant between the three frequencies, and suppresses the sensitivity of the method to noise features in the individual DMR maps which are clearly not common to all three frequencies, thus allowing an improved determination of the extent of chance cosmic or noise alignments with the template maps. We have tested the impact of such chance alignments to the method by repeating the fits after rotation of the foreground templates. We only find significant correlations when the templates are correctly aligned. Moreover, the r.m.s values of the coupling coefficients derived from the rotated sky maps are consistent with the errors determined directly in the analysis. The full details of this method are contained in Górski et al. (1996). The 19.2 GHz data are treated in a similar fashion, but we do not extend the method to include it in a simultaneous fit with the DMR data to the foreground templates because of complications introduced by its different angular resolution and noise properties.
Having solved for the values of the coupling coefficients and their Gaussian errors, we are then in a position to compute the likelihood of the foreground corrected data as a function of a given set of input cosmological parameters as contained in the matrix of equation 1. Indeed, this also allows us to assess the sensitivity of the coupling constant fits to the assumed cosmological power spectrum. We consider a full grid of power law models specified by the rms quadrupole normalisation amplitude and a spectral index as in Górski et al. (1996). The cosmological implications of the foreground corrections as reappraised in this work are discussed in section 6.
In order to quantify the uncertainty in the H template resulting from dust absorption, we generate corrected H templates for three values of – 0.0, 0.5 and 1.0 – which are then fitted successively to the data over the full , grid of cosmological models, and also test templates corrected assuming values of running from 0 to 1 in steps of 0.01 for a scale-invariant spectrum with 18 K. Since the correction is non-linear in (see section 2.2), modifications to the template are made before convolution with the appropriate beam response, at the 1° effective angular resolution of the H template (see section 4.3 for full discussion).
We also analyse the DMR and 19.2 GHz data after correction for free-free emission using the H templates scaled by the factors given in Table 4 of Dickinson et al. (2003). This enables us to test the impact of cross-talk between the templates, which is likely to be present at some level due to the large-scale cosecant variation with latitude of the Galactic emission present in each template (see section 4.4).
Finally, in an attempt to unambiguously identify the anomalous dust-correlated emission, we use the FDS models of thermal dust emission and subtract them from the observed data before correlation studies are performed (see section 5).
4 Results - foregrounds

The results of our correlation study for the three DMR frequencies are summarised in Figs 1(a)-(c). This summary gives information for six parameters as follows:-
1. Frequency. Data are grouped in each of the three figures (a)-(c) as three bands at each of the DMR frequencies 31.5, 53 and 90 GHz.
2. Foreground components. The three panels in each figure give the results for dust, free-free and synchrotron plotted from top to bottom.
3. Galactic cut. The results are shown for three Galactic cuts, namely (squares), the standard Galactic cut of Banday et al. (1997) (circles) and (diamonds).
4. H extinction. The effect of the three levels of H extinction, and , are shown in Figs (a), (b) and (c) respectively.
5. Forced/unforced fits to the H data. Open symbols are fits that are made to the dust and synchrotron templates after correcting the DMR data for the free-free contribution predicted by the H template; filled symbols correspond to fits made to the three templates simultaneously in which no constraints have been placed on the H template correlation.
6. Electron temperature. The free-free predictions from the H template depend upon the electron temperature; the dashed boxes in the middle panels show the range of predicted free-free emission for temperatures 5000 to 9000 K (open symbols are for 7000 K).
The results obtained from an analysis using only the DIRBE and synchrotron templates, consistent with previous work by the -DMR team (Kogut et al. 1996b), are shown with their errors by full-line boxes in the upper and lower panels of each figure†††Note that the boxes in the top and bottom panels of Fig. 1 show slightly different results to the previous analysis of Kogut et al. (1996b). However, this is not surprising since they used an earlier release of the DIRBE 140 m map and the data were analysed in the QuadCube format.. This allows a direct assessment of the impact of the inclusion of a free-free template on the analysis by comparison with results in which such a template has not been utilised.
The results presented here have been derived assuming a scale-invariant spectrum ( = 1) for the CMB contribution with an r.m.s quadrupole normalisation of = 18 K. However, as part of our studies of the impact of the foreground correction for cosmological interpretations of the DMR data, we have determined the coupling parameters over a grid in and . We compute an average of the coefficients weighted by the likelihood function over the grid and find that the marginalised coupling coefficients are essentially identical to those shown here, and that no conclusions derived from later analysis are compromised by adopting these values as canonical. As described above, we have adopted three Galactic cuts, and also computed correlations in which the coupling to the H template has been left unconstrained, or where we have fixed and subtracted the predicted free-free contribution according to the spectral behaviour predicted in Dickinson et al. (2003), determined for an electron temperature of 7000 K, the mean value in the solar neighbourhood (see section 2.2).
The following sections provide a detailed discussion of this data set.
4.1 DMR and Dust
| Component | Coverage | DMR Map (GHz) | ||||||||
|---|---|---|---|---|---|---|---|---|---|---|
| 31.5 | 53 | 90 | ||||||||
| 0.0 | 0.5 | 1.0 | 0.0 | 0.5 | 1.0 | 0.0 | 0.5 | 1.0 | ||
| 51.8 6.0 | 41.6 6.6 | 42.2 6.6 | 18.6 3.7 | 14.8 4.1 | 15.4 4.0 | 19.6 4.3 | 18.6 4.8 | 19.6 4.7 | ||
| Dust | standard | 19.9 5.9 | 17.9 6.1 | 17.3 6.3 | 10.0 4.1 | 8.9 4.3 | 8.7 4.3 | 11.0 4.5 | 9.9 4.7 | 9.6 4.8 |
| 13.6 7.1 | 10.6 7.4 | 9.9 7.6 | 14.0 4.8 | 11.8 4.9 | 11.7 5.1 | 10.8 5.3 | 8.8 5.5 | 8.3 5.7 | ||
| 29.1 4.4 | 35.8 4.8 | 35.4 4.8 | 12.9 2.6 | 14.2 2.8 | 13.8 2.7 | 5.3 3.0 | 4.1 3.3 | 3.4 3.3 | ||
| Free-free | standard | 10.0 4.2 | 11.2 4.2 | 11.5 4.3 | 2.9 2.5 | 3.5 2.5 | 3.4 2.5 | 3.6 2.9 | 4.1 2.9 | 4.2 3.0 |
| 10.8 5.6 | 13.6 5.4 | 14.1 5.7 | -3.9 3.5 | -0.9 3.1 | -0.8 3.2 | 0.3 4.0 | 2.7 3.8 | 3.2 3.9 | ||
| 5.3 5.4 | 8.5 5.4 | 8.5 5.5 | -1.6 3.8 | -0.5 3.8 | -0.6 3.8 | -2.7 4.2 | -2.5 4.2 | -2.6 4.2 | ||
| Synchrotron | standard | 4.7 5.4 | 5.0 5.4 | 5.2 5.4 | 0.2 3.7 | 0.2 3.7 | 0.3 3.7 | -3.2 4.1 | -3.1 4.1 | -3.0 4.1 |
| 8.0 5.9 | 8.6 5.9 | 8.7 5.9 | -4.5 3.9 | -4.5 3.9 | -4.5 3.9 | -2.7 4.4 | -2.6 4.4 | -2.5 4.4 | ||
In order to determine accurate values of the coupling amplitudes between the DMR data and the three foreground templates it is important that the templates are uncorrelated or largely uncorrelated, or that we know the precise emission expected from one of the partially correlated templates. The extent of the partial correlation between the dust and the free-free (H) emission can be elucidated in the present study by first removing the free-free emission derived from the H template (section 2.2) before deriving the coupling coefficient for DIRBE dust. The computation was also made without this H constraint; the results were not significantly different. It is also necessary to correct the H template for absorption by intervening dust by an absorption factor ; the analysis of Dickinson et al. (2003) indicates that this is between 0 and 0.3. At high Galactic latitudes this has little effect since the total absorption is small (H). The plots in Fig. 1 show the effect of assuming different values of . In fact, the stability of the dust couplings derived when the free-free coupling is unconstrained implies that there is minimal cross-talk between the components. The results when the free-free coupling is fixed are more strongly influenced by the relation between and as discussed in more detail in section 4.3.
The estimates of the coupling amplitudes of DMR data against the DIRBE 140 m template at the the three frequencies of DMR are given in the top panels of Fig. 1a. The best estimates are for =0 (see discussion in section 4.3), for the largest sky area covered () and for a fixed H contribution. The values are , , K/(MJy sr-1) at 31.5, 53 and 90 GHz respectively. We compare these values with those of Kogut et al. (1996b) using only the DIRBE and the Haslam templates of , and K/(MJy sr-1). There is a small reduction in coupling amplitude when the free-free (H) template is taken into account. Significantly, there is a factor of reduction in the r.m.s. error when the free-free emission is included in the analysis. This reduction is partly due to the larger area of sky covered but is mainly due to the substantial scatter in the correlation between dust and H emission (Dickinson et al. 2003) and the fact that they are individually cross-correlated with the DMR data.
We will now consider the r.m.s. brightness temperature contribution expected for each foreground component as calculated from the correlation coefficients in Fig. 1. The entries in Table 1 are the product of the correlation coefficient and the r.m.s. level on each of the template maps (after subtraction of the best-fitting monopole and dipole) for the relevant range of Galactic latitudes and for each of the three DMR frequencies. In Table 1 we have converted the conventional (Rayleigh-Jeans) brightness temperature units into thermodynamic temperature units (relative to a fixed CMB temperature, ) by multiplying by the Planck correction factor where ; the factors are 1.03, 1.07 and 1.23 at 31.5,53 and 90 GHz respectively. At the preferred value of =0, the rms dust emission at 31.5 GHz for the cut is times that for reflecting the strong increase towards the Galactic plane. The table shows that the dust emission is times stronger than the free-free, the next brightest component. We note that the r.m.s. error in the dust foreground estimate is similar (K) for each Galactic cut; this suggests that the precision with which the CMB can be corrected for dust emission is not degraded on extending the field of view to .
4.2 DMR and Synchrotron emission
Although synchrotron emission is weak at DMR frequencies, some significant conclusions can be drawn from the cross-correlation between the DMR data and the 408 MHz synchrotron template. The most compelling data are shown in the bottom panel of Fig. 1(a) which is for , and for the cross-correlation obtained with the free-free emission predicted from the H template subtracted, as shown by the open squares. The coupling constants for the largest sky coverage (), are , and K K-1 at 31.5, 53 and 90 GHz respectively. The coupling constant can be converted to limits on the brightness temperature spectral index between 0.408 GHz and the observing frequency, , using .
| Frequency (GHz) | Sky Coverage | ||
|---|---|---|---|
| Standard | |||
| 19.2 | 3.08 | 3.02 | 3.08 |
| 31.5 | 3.07 | 3.01 | 2.93 |
| 53.0 | 2.83 | 2.78 | 2.72 |
| 90.0 | 2.58 | 2.54 | 2.49 |
Table 2 gives the values of for the three sky cuts used in the present study. The most significant results are for the cut which includes the brightest backgrounds; () upper limits are given for . The 19.2 GHz result will be discussed in section 4.4.
The spectral index calculated between 0.408 GHz and 20 to 30 GHz where synchrotron signals can be detected is . is known to increase with frequency between and 1 GHz (see section 2.1) with typical values of 2.7 at 1 GHz. Clearly steepens further by GHz; the “local” value of the index will be greater than 3.1 at DMR frequencies if the synchrotron-loss turnover () occurs at frequencies higher than a few GHz. Spectral indices of were considered by Banday & Wolfendale (1991). Direct measurements at frequencies of and 15 GHz in the Tenerife and Jodrell Bank experiments (Jones et al. 2001, Hancock et al. 1997) indicate spectral indices of between 0.408 GHz and these frequencies. We note that the values derived in Table 2 are the average spectral index over a substantial part of the sky; there is presumably a scatter of spectral index at high frequencies corresponding to that found at low frequencies.
Table 1 shows that the r.m.s. synchrotron emission in the DMR data is essentially the same for each of the three latitude cuts in contrast to the dust and free-free emission which increases significantly towards the Galactic plane. This is because in the 408 MHz synchrotron template map, the North Polar Spur (NPS) dominates the emission in each latitude cut. The NPS is the major contribution to the synchrotron r.m.s. temperature at these frequencies. This will be discussed further in section 4.4.
4.3 DMR and Free-free
From Fig. 1, the H template appears to be well correlated against the DMR data at all frequencies for the 15°Galactic cut, and at better than the 2 level at 31.5 GHz for each of the cuts. The derived correlations with the H template are completely consistent with that expected for free-free emission due to thermal electrons with temperatures in the range K. For the larger values of , the picture is less consistent, and it appears that some of the H correlation is at the expense of the dust, particularly for the case of fixed scaling. For a value of of order unity, the derived scaling for a 15°cut is inconsistent with this temperature range.
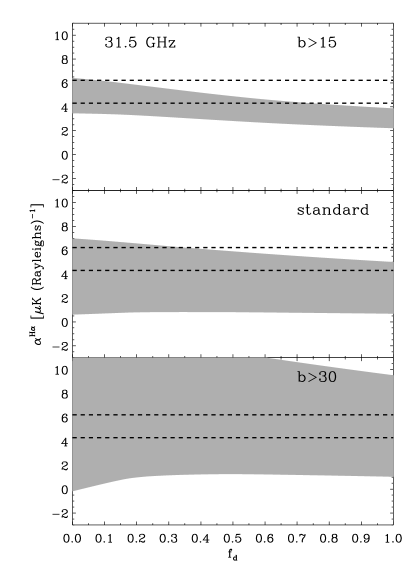
In order to study the dependence on the parameter more extensively, we have run a further set of fits to the data in which we keep and fixed at values of 18 K and 1 respectively, and vary over the range 0 - 1 in steps of 0.01. In Fig. 2 the results for the 31.5 GHz channel over the three Galactic cuts of choice in our analysis are shown. As before, it is clear that the derived scaling amplitude decreases as increases. This has a simple physical interpretation, namely that the amount of foreground emission correlated with the H template as admitted by the 31.5 GHz sky map is fixed (see Table 1), and since the predominant effect of the correction for extinction is simply to enhance the H signal with very little change in detailed structure at high latitudes and over the range of scale probed by -DMR, the coupling amplitude must fall with increasing as observed. This observation then allows us to restrict our investigations to low values of at high latitudes, consistent with the results of Dickinson et al. (2003).
In fact, we can take the analysis yet further. By noting that the scaling amplitude is effectively related to the value of the electron temperature in the interstellar medium (), then the 95% confidence limits on the scaling amplitude imply some joint constraint on and . By comparison of the predicted scaling of the H map, for the temperature range K (discussed in section 2.2), with the 95% confidence range for the 31.5 GHz coupling parameters, we infer a weak limit on of 0.75, but this also implies a value for lower than the 7000 K observed locally. Indeed, if we adopt this local value as the typical value for then is constrained to lower values still, 0.35, in good agreement with Dickinson et al. (2003).
4.4 Constraints from the 19.2 GHz data
Here we apply the analysis of the previous sections to derive the correlation coefficients between the three foreground templates and the 19.2 GHz data of Cottingham (1987). This will allow us to place stronger constraints on the synchrotron and free-free emissions which rise with decreasing frequency and to investigate any dust-correlated component at lower frequencies. The results are summarised in Fig. 3. The analysis has again assumed a scale-invariant () CMB component with normalisation K. We do not find any significant dependence on the choice of these parameters over the range allowed by the DMR data‡‡‡This is consistent with the analysis of Boughn et al. (1992) which placed only upper limits on the normalisation amplitude.. We also find that the spatially varying noise description is preferred over the constant noise level per pixel used in the previous analysis by de Oliveira-Costa et al. (1998).
Fig. 3 shows that there is a highly significant correlation between the 19.2 GHz data and all three foreground templates, particularly for the cut. The free-free coupling constant calculated as a free parameter agrees most closely with the expected emission at ; high values of are rejected.
The stronger synchrotron signal at 19.2 GHz compared with that at DMR frequencies enables a more definitive spectral index between 408 MHz and these higher frequencies to be obtained as shown in Table 2. The data are consistent with a brightness temperature spectral index of at these frequencies.
The 140 m dust couplings are of lower amplitude than those determined in de Oliveira-Costa et al. (1998); their analysis did not have the H template available to it, and moreover they removed the observed quadrupolar contribution to the sky signal before the correlation study. We also repeated our analysis in a similar fashion, using only the DIRBE 140 m and 408 MHz sky templates, and we indeed find results more consistent with this earlier treatment, although approximately lower in amplitude. We also note that de Oliveira-Costa et al. (1998) found that their statistical error was significantly lower than the dispersion in coupling amplitudes derived from correlations of the data with random rotations of the Galactic templates. The statistical error determined for our analysis is completely consistent with the value determined by such a sky rotation approach. We conclude that our method is unbiased, and affords statistically robust error estimates.
In the remainder of the paper, we will consider only those results where we have subtracted the predicted free-free contribution from the microwave data, and we adopt and K, the values which are maximally consistent with the picture we have established at this point.

5 The nature of the anomalous dust-correlated emission
We have shown that there is a diffuse foreground component in the -DMR data at 31.5 and 53 GHz and the 19.2 GHz data which is strongly correlated with the 140 m dust emission. In order to make further progress in determining the nature of the anomalous component of dust-correlated emission, it is necessary to identify its spectral behaviour over the range of frequencies studied. This in turn requires that we separate out from the higher frequency observations that fraction of the observed dust correlation which is associated with thermal dust emission.
There are several possible approaches to modelling the thermal dust at DMR frequencies. The first is to use an or DIRBE template of FIR emission and extrapolate to microwave frequencies using a simple model of the dust emissivity and temperature. In particular, we could use the model from DL98 where the emissivity index is set to and the temperature and optical depth are adjusted so that the peak dust emission occurs at 140 m, or set the emissivity index to 2 and dust temperature to 17.5 K, as derived in Lagache et al. (2000). Kogut et al. (1996a) combined the observed correlations between the DMR and DIRBE 140 m data with additional information about r.m.s fluctuations obtained directly from the DIRBE 100, 140 and 240 m sky maps to attempt to infer constraints on the thermal dust emission. These results are quite consistent with the two previous models. Another approach, which we adopt here, is to use a model which incorporates data available over a wide range of FIR and microwave frequencies; suitable models have been generated by FDS as described in the next section.
5.1 Estimation and removal of thermal dust in the DMR data
FDS have used resolution data in 123 frequency lines between 100 and 2100 GHz ( mm to mm) from -FIRAS data along with -DIRBE data in the range 100 to 240 m to produce models of dust emission which can be extrapolated to DMR frequencies. Their models 7 and 8 afford the most acceptable fits to the observations, according to a chi-square criterion. We have adopted model 7, differing little from model 8, which has two dust components, one at 9.6 K with and the other at 16.4 K with . We proceed by subtracting from the DMR data the model 7 predictions at each frequency, then correlate the residuals against the DIRBE and Haslam templates as before, with either an unconstrained and fitted free-free contribution, or after subtracting the predicted free-free component assuming = 0 and = 7000 K. Fig. 4 shows the results from this analysis. The conclusions reached based on model 8 are indistinguishable from those presented here (although model 7 has higher r.m.s fluctuations at 90 GHz relative to model 8).

It is apparent when comparing Fig. 4 with the left-hand panel of Fig. 1, that the thermal dust emission accounts for essentially the entire observed correlated signal at 90 GHz. The best estimate of the dust components comes from the cut and fixed H data. Here we find that at 90 GHz the model thermal dust component is equivalent to K/(MJy sr-1) at 140 m leaving K/(MJy sr-1) of anomalous dust-correlated emission. This signal may be indicative of a small anomalous component, but equally it could be a consequence of the FDS parameterisation inadequately predicting an enhanced (very) cold dust component (for example, see Reach et al. 1995). However, with the current data it is premature to radically alter the FDS model.
The most important result of this study is the high statistical significance of the identified anomalous dust-correlated component of K/MJy sr-1 at 31.5 GHz. At 53 GHz the dust-correlated DMR coefficient is K/(MJy sr-1), of which the thermal dust model 7 contributes K/(MJy sr-1). The two dust-correlated components will therefore be approximately equal in amplitude at frequencies of GHz and suggests that this may be close to the minimum in terms of Galactic foreground contamination on large () angular scales. The dust contribution is discussed further in sections 5.4 & 7.
5.2 Characterising the anomalous dust-correlated spectrum
In order to quantify the nature of the anomalous dust-correlated component, we first compute the effective power-law spectral index between pairs of frequencies, as tabulated in Table 3. We use the 19.2 GHz results directly from Fig. 3, without further correction for the thermal dust contribution since this is negligible at this frequency (comprising of the thermal contribution at 31.5 GHz which is in itself negligible). In addition, all data points are fitted simultaneously by a model of the form where , in units of K/(MJy sr-1) referred to the 140 m template, is the amplitude of the emission at the reference frequency , which we take as 31.5 GHz. The values are consistent with a spectrum steeper than the typical value of free-free emission, although in themselves not ruling out such an emission mechanism. Previous interpretations had proposed free-free as the source of the excess dust-correlated emission, yet in this work we have utilised a sky map of H optical line emission as an explicit tracer of this foreground component. The derived correlation with the data is consistent with that predicted for free-free emission and moreover, does not eliminate the dust-correlated emission.
| Sky Coverage | |||
|---|---|---|---|
| Standard | |||
| 2.51 0.30 | 2.66 0.78 | 2.99 0.80 | |
| 2.28 0.66 | 2.28 1.60 | 1.68 1.47 | |
| 1.66 1.54 | 1.04 2.82 | 1.84 3.36 | |
| Fitted | 2.44 | ||
| Fitted | 6.34 | 4.35 | 4.93 |
Microwave data on the anomalous dust-correlated emission in addition to that given in the DMR and the 19.2 GHz surveys made at intermediate Galactic latitude (), are presented in Fig. 5. To allow a direct comparison with these previous studies, we have recomputed the DMR and 19.2 GHz correlation coefficients at 100 m. These are a factor of higher than the corresponding values for the 140 m correlations, reflecting the weaker dust emission at 100 m. Both the total dust (filled circles) and anomalous dust-correlated (open circles) emission are shown for comparison. The best-fit power law is shown over the frequency range GHz. Tenerife data on a 5°scale at 10 and 15 GHz give correlation coefficients of and K/(MJy sr-1) for at 100 m respectively (de Oliveira-Costa et al. 2002). Mukherjee et al. (2001) suggested lower values based on a smaller Tenerife database. Finkbeiner et al. (2002) have also studied two isolated dust clouds on the Galactic plane at 5, 8.25 and 9.75 GHz; the dust emissivity differs by more than a factor of 10 in the two clouds and hence they have not been plotted. Nevertheless they find a dust-correlated emissivity which falls between 10 and 5 GHz. There is a suggestion of a turn-over in the anomalous component spectrum at GHz but the exact shape is still poorly defined. Information at frequencies of GHz is clearly important in defining the anomalous dust-correlated spectrum. A large area survey at intermediate and high Galactic latitudes has been made with the Jodrell Bank Interferometer at angular scales of 1°and 2°(Jones et al. 2001). At 2°resolution the observed r.m.s level is K; this includes all the foreground components and the CMB. The synchrotron and free-free components comprise more than half this value, leaving K for dust emission. The corresponding dust emissivity at 5 GHz is K/(MJy sr-1) at 140 m.

Fig. 5 also shows dust data at 150, 240 and 410 GHz from the BOOMERanG experiment (Masi et al. 2002) also for , corrected from thermodynamic units to brightness temperature units. The FDS thermal dust model 7 normalised to 100 m (dashed line) is in relatively good agreement with these points data.
Fig. 5 therefore presents our assessment of the relative contribution of the anomalous and thermal components of dust emission in the range 10 to 500 GHz. The contributions are equal at GHz. These results apply to large areas of sky ( sr) at intermediate and high latitudes where deep CMB observations are made; the situation closer to the plane near sources of heating and star-formation is likely to be different.
The best-fitting model to the anomalous dust-correlated component is a power law model spectrum of the form with , in the range GHz. This implies an emission component with a dust-like morphology but a synchrotron-like spectrum. The physical explanation of such a component is open to debate, and we explore dust-related alternatives below. It should be noted, however, that the evidence presented here for dust-correlated emission does not necessarily imply that the emission is intrinsic to the dust grains themselves. For example, it may arise from a source which is associated with the dust, such as may result from the star-formation process in a spiral arm environment. This is the interpretation taken by the team (Bennett et al. 2003) and is discussed in section 5.4.
5.3 Possible models of the anomalous emission
A widely discussed model is in terms of rotational emission from very small dust grains – a ‘spinning’ dust component, as proposed in DL98. They propose a three-component model of the spinning dust containing contributions from dust found in the Cold Neutral Medium (CNM), Warm Neutral Medium (WNM) or Warm Ionised Medium (WIM). The spectra for these three environments with the inferred anomalous emission are shown in Fig. 5 scaled to 100 m as dot-dashed lines. The preferred DL98 model has these components in the ratio 0.43, 0.43 and 0.14 respectively. The typical spectral index of the calculated dust emission over the frequency range GHz is between and , reasonably consistent with the observed values (Table 3). However, the results presented in this paper indicate that, whilst the preferred spinning dust model of DL98 has a spectral shape which can reasonably match the data, some adjustment of amplitude is required. Fig. 5 shows the model (solid line) scaled to approximately fit the plotted data points. A more formal analysis indicates that an improved fit results from models in which emission from the WNM is almost completely dominant. This can be understood rather easily: the CNM-component can be adjusted to give an excellent fit to the data points at 19.2 and 53 GHz, but then over-predicts emission at 31.5 GHz; the WNM-component is scalable to provide good agreement with the data at 19.2 and 31.5 GHz although then under-predicts the emission at 53 GHz; the WIM-component can only be matched well to one frequency. Since the two lowest frequency data points have the most statistical weight, models containing a substantial contribution from the WNM are favoured. Spinning dust models therefore remain a possibility to explain the anomalous dust-correlated component, although the observed spectrum is not as strongly peaked as the current dust models which therefore require some adjustments to match more closely with the new constraints. Given the uncertainties in the model predictions, depending on the composition, size and shape of the dust grains and conditions in the interstellar medium, this is certainly feasible.
An alternative model for the anomalous dust-correlated emission at frequencies GHz is due to thermal fluctuations in the magnetization of interstellar grains (Draine & Lazarian 1999) which results in magnetic dipole radiation. A population of Fe grains or grains with Fe inclusions are predicted to produce strong emission with a broad peak near 70 GHz due to the Fröhlic resonance. Normal paramagnetic grains give much weaker emission at a level of of the dipole emission expected from spinning dust grains. Hypothetical Fe-rich materials could produce radiation comparable to that from spinning grains in the 14 to 19 GHz range. Draine & Lazarian (1999) conclude that magnetic dipole emission at GHz might contribute significant emission if appropriate magnetic materials existed; both astronomical and laboratory measurements could clarify this situation. In the current context, the spectrum of the radiation is quite different; the magnetic dipole emission is relatively flat while the dipole (spinning) emission is peaked.
A possible explanation for excess microwave emission in the North Celestial Pole region, at 14.5 and 31.7 GHz, was proposed by Leitch et al. (1997) in terms of free-free emission from ionized gas at K. This explanation was considered unlikely because of the energetics in creating this hot gas. Draine & Lazarian (1998a) argue that the case against this hypothesis is even stronger for the larger DMR sky coverage since the power radiated is a factor of greater than that expected from the typical supernova rate in the Galaxy. The current analysis also argues against this in view of the strong dust correlation and the fact that it persists in the presence of a simultaneous fit to the H template. However, it should be noted that the ratio of H to free-free radio continuum drops as the gas temperature is increased above K, hence the requirement for temperatures above K. The definitive test of this model would be to analyse the correlation of microwave data with X-ray data at energies of keV. Indeed Kneissl et al. (1997) did find a significant () correlation of DMR data with ROSAT all-sky X-ray data but only for the quadrupole component. After removal of the quadrupole term, no significant correlation remained.
Another possible source of microwave emission from dust grains is in terms of low-lying 2-level tunnelling transitions at low temperatures. The laboratory measurements of Agladze et al. (1996) show surprisingly large and variable values for the millimetre (80 to 400 GHz) absorption coefficients of small silicate particles similar to interstellar grains; these effects occur at temperatures found in the interstellar medium (T K). This phenomenon is also found in amorphous silica-based glasses and is believed to be due to resonant tunnelling absorption, although the detailed physics is not fully understood (Bösch 1978, Agladze & Sievers 1998). The low frequency spectrum of this emission has not yet been determined so a comparison with Fig. 5 is not possible. Further progress awaits laboratory measurements.
5.4 Comparison with WMAP
Since our more detailed re-analysis of the -DMR data, the first results from the analysis of one year of observations by the WMAP satellite have been released (Bennett et al. 2003a and references therein). Their foregrounds analysis (Bennett et al. 2003b) uses a maximum entropy method applied to the 5 frequency channels of the WMAP observations, together with data from outside the microwave spectral regime, specifically the Haslam 408 MHz survey, the full-sky H map published by Finkbeiner (2003) and a dust template derived from -DIRBE and FIRAS data (FDS model 8 normalised at 94 GHz). These external data-sets are claimed to be the key to separating the three emission mechanisms (free-free, synchrotron and spinning dust) with a spectral index of at the WMAP frequencies. One should note, however, that no unique spinning dust template has been employed since this putative emission falls off rapidly outside the microwave regime, and therefore there is no obvious candidate (although DL98 have proposed that the 12 m map might be used). More importantly, the analysis is allowed only to produce a combined synchrotron/spinning dust solution at each frequency, with no attempt made to separately disentangle these two components. As a result of the analysis, they identify a dust-correlated component in the lower frequency (23, 33 and 41 GHz) WMAP channels. However, they interpret this as a synchrotron component with a spectral index of , a value which we emphasise is in close agreement to that derived in this analysis using -DMR data. They argue that this emission originates in star-forming regions close to the plane while the steeper ( synchrotron component is from gas in the halo, a picture which is consistent with what has been found in the integrated radio and FIR emission for several nearby star-forming galaxies.
In their figure 9, Bennett et al. (2003b) show the steepening of the mode for the spectrum of the synchrotron plus spinning dust component at 23-41 GHz and conclude that this is evidence for a spectral break, corresponding to a steepening of at frequencies of GHz. However, this could also be the signature of spinning dust. Current models of spinning dust (DL98) also give a steepening of index with spectral indices ranging from at 30 GHz and steepening to greater than 4 at frequencies GHz.
An independent re-analysis of the WMAP foregrounds has been performed by Lagache (2003). WMAP data is correlated with the neutral Hi component and an excess is similarly found at longer wavelengths. By comparing the correlations with the Hi column density, there is evidence that the excess emission is associated with small transiently heated dust particles. The exact physical mechanism of such emission remains to be determined, but possible models certainly include the spinning dust rotational emission mechanism or Very Small Grain (VSG) long-wavelength emission resulting from transient heating by UV photons.
In the previous discussion, we have attempted to present arguments as to why the interpretation of the WMAP foreground results remains open, and that a spinning dust component can be compatible with the observations. However, we would like to emphasise that we do not consider that this is an unambiguous solution to the origin of the dust-correlated emission. The results of our analysis based on independent data sets are completely consistent with that of the WMAP team, and indeed the flat spectrum fit we have derived to the anomalous dust-correlated component is formally better than any spinning dust model considered. In order to clearly distinguish the various models for this excess emission, low frequency data (few GHz to 15 GHz) will be vital. Evidence for WMAP-consistent spectral indices determined from lower frequency radio measurements may be important to corroborate the star-forming region, flat spectrum hypothesis. We await the forthcoming publication of a full-sky 1420 MHz survey with interest. Finally, detailed spatial comparisons between the radio and FIR emission will be critical in determining the physical processes associated with this dust-correlated component.
6 Results - CMB
We are now in a position to consider the implications of our better understanding of the Galactic diffuse foregrounds upon estimates of , the CMB quadrupole normalisation and , the power-law spectral index. In section 3 we describe how the simultaneous solutions for the coupling coefficients of the DMR data to the three foregrounds forces the CMB distributed power to be invariant between the three DMR frequencies, so that each set of foreground solutions has an accompanying estimate of and . Table 4 gives the and values for the following areas of parameter space.
-
•
Column 1: Foregrounds used in the fit– 140 m dust (D), synchrotron (S), free-free (F), free-free forced to the H-derived value (FixedF) and a fixed thermal dust component following FDS model 7 (FDS7).
-
•
Column 2. The Galactic cuts used in the fits– straight Galactic latitude cuts at and , and the standard DMR cut at which also excludes extra regions of stronger emission.
-
•
, the correction applied to the free-free (H) template for foreground dust absorption. We consider is the best value for the latitudes considered here (see section 4.3).
An examination of Table 4 immediately shows that the solution for and is strongly independent of the parameters incorporated in the present study. We believe that our best estimate of and are given for , fixed free-free and the FDS dust model included, namely K, . This may be compared with K, if only the dust and synchrotron foregrounds are used with an aggressive Galactic cut; the earlier analysis of Bennett et al. (1996) gave K, . The present analysis gives values in excellent agreement with the earlier values, but with smaller errors.
The reason that the solutions for and in Table 4 are not strongly dependent upon the precise values of the Galactic foregrounds used is that the weighting of the data from the three radiometers with respect to the likelihood analysis is strongest for 53 and 90 GHz; the weightings are approximately 8, 65, and 27 per cent at 31.5, 53 and 90 GHz respectively, which reflects the corresponding noise levels of the three frequencies. As will be shown in section 7, the minimal foreground contributions are in the range 50 to 100 GHz and therefore explains why there is only a small effect on and .
Indeed, even for a Galactic cut of 15°, there appears to be remarkable consistent with previous analyses, provided the three templates for foreground emission are included in the analysis. The worst perturbation in and corresponds to the result from the data corrected for dust and synchrotron alone for this cut. However, even here the changes are less than 1 for the quadrupole normalisation, and a less significant amount for the cosmological spectral index value. Clearly, the uncorrected fit for this latitude cut is inconsistent at worse than 2.
| Correction | Coverage | ||||||
|---|---|---|---|---|---|---|---|
| 0.0 | 0.5 | 1.0 | 0.0 | 0.5 | 1.0 | ||
| 24.45 | - | - | 0.94 | - | - | ||
| Uncorrected | standard | 15.85 | - | - | 1.22 | - | - |
| 15.31 | - | - | 1.20 | - | - | ||
| 16.49 | - | - | 1.19 | - | - | ||
| DS | standard | 15.08 | - | - | 1.23 | - | - |
| 15.02 | - | - | 1.19 | - | - | ||
| 15.34 | 15.18 | 15.12 | 1.22 | 1.23 | 1.23 | ||
| DSF | standard | 15.31 | 15.37 | 15.34 | 1.21 | 1.20 | 1.20 |
| 14.70 | 15.18 | 15.18 | 1.22 | 1.18 | 1.18 | ||
| 15.34 | 15.24 | 15.34 | 1.22 | 1.22 | 1.23 | ||
| DS-FixedF | standard | 15.47 | 15.63 | 15.79 | 1.20 | 1.18 | 1.17 |
| 15.66 | 15.56 | 15.66 | 1.15 | 1.15 | 1.15 | ||
| 15.12 | 14.86 | 14.80 | 1.23 | 1.25 | 1.26 | ||
| DS-FDS7 | standard | 15.18 | 15.18 | 15.18 | 1.21 | 1.21 | 1.21 |
| 14.64 | 15.05 | 15.05 | 1.22 | 1.19 | 1.19 | ||
| 15.18 | 14.86 | 14.83 | 1.23 | 1.25 | 1.27 | ||
| DS-FixedF-FDS7 | standard | 15.28 | 15.37 | 15.56 | 1.20 | 1.20 | 1.18 |
| 15.50 | 15.43 | 15.53 | 1.16 | 1.16 | 1.15 | ||
Given the success of the Galactic correction, we might wonder whether it is possible to be yet more aggressive, and attempt to correct for Galactic contamination at still lower latitudes. We have tried this using a cut in which we only eliminate those pixels lying within 10°of the Galactic plane, but in this case we find that, whilst the derived correlations of the foreground templates with the DMR maps are very consistent with the 15°results discussed above, the likelihood analysis begins to deteriorate. This close to the Galactic plane, there remains a sufficiently complex structure in the Galactic emission that it is inevitable that simple correlation studies which do not allow for variations in spectral behaviour cannot succeed in subtracting the foreground at the necessary level of accuracy. Moreover, for this case, half of the FWHM beam area of DMR lies at . Residual poorly corrected features contribute to an overall flattening of the cosmological power-law spectral index and increase in normalisation amplitude well beyond the allowed ranges yielded by the studies confined to more conventional latitude cuts. It is unlikely that even sophisticated analysis methods, such as those based on independent component analysis (Maino et al. 2002) or Maximum Entropy in harmonic space (Stolyarov et al. 2002) will be able to circumvent these issues. With higher sensitivity, higher angular resolution observations such as those due to WMAP and expected for Planck, such methods as applied to small regions or even on a pixel-by-pixel basis may yield an improved understanding of the physical nature of the foreground emission and allow greater sky coverage to be used for cosmological studies.
7 Conclusions
In this paper we have reappraised the contribution of Galactic foreground emission to the -DMR data, augmented with lower frequency information at 19.2 GHz. It has been demonstrated that a new template for Galactic free-free emission derived from observations of the H emission is in excellent agreement with expectations, and furthermore allows us to claim, with reasonable certainty, that the amount of emission absorbed by foreground dust is low at high Galactic latitudes, in particular for the preferred local value of the electron temperature of 7000 K. After subtraction of the free-free contribution, there is continued and unambiguous evidence of anomalous dust-correlated emission at low frequencies, consistent with previous analyses. Subtraction of an FDS model for Galactic thermal dust emission indicates that the correlated dust component at 90 GHz is essentially dominated by a vibrational (thermal) emission mechanism. The anomalous component at lower frequencies ( GHz) has a power-law spectral index of , somewhat flatter than the putative spinning dust component proposed in DL98. Indeed, their preferred mixture of spinning dust emission from a three-component dust model requires some adaptation to afford an improved fit. The level of Galactic synchrotron emission is consistent with expectations based on lower frequency observations at 408 MHz and a steep temperature spectral index of . The best-fit coupling coefficients (°) for each foreground component are given in Table LABEL:tab:summary_table for 19.2, 31.5, 53 and 90 GHz. Both the total and anomalous dust-correlated are given for comparison while the free-free scalings are those predicted by the H template assuming K and . These results are completely consistent with the recent WMAP analysis and independently confirm their results on large angular scales. In particular, we demonstrate the existence of an emission mechanism that has a spatial morphology similar to dust but with a synchrotron-like spectrum in the range GHz.
| Galactic | Frequency (GHz) | |||
|---|---|---|---|---|
| Coefficient [units] | 19.2 | 31.5 | 53 | 90 |
| Total Dust K/MJy sr | 21.55 1.53 | 6.25 0.60 | 2.42 0.36 | 2.16 0.37 |
| Anom. Dust K/MJy sr | 21.55 1.53 | 6.06 0.60 | 1.85 0.36 | 0.77 0.37 |
| Synchrotron K/K | 7.18 2.32 | 0.91 0.83 | -0.26 0.56 | -0.35 0.54 |
| Free-free K/ | 15.28 | 5.30 | 1.74 | 0.56 |
Our better understanding of the foregrounds allows us to correct for them over a larger region of the sky and reassess the value of and . The most significant changes in general result from an analysis made with an aggressive Galactic cut, yet even here the results are compatible with earlier results at better than the level, although the error is slightly smaller, suggesting some possibility of making use of modestly larger sky coverage for the inference of cosmological parameters. Interestingly, what might be considered our best model for the foreground correction – with this aggressive Galactic cut, utilising the FDS Model 7 dust template to correct for thermal dust emission, the H template from Dickinson et al. (2003) to trace the free-free emission (fixed assuming that the electron temperature is 7000 K), together with unrestricted fits to the DIRBE 140 m and 408 MHz sky surveys to correct for anomalous dust-correlated and synchrotron emission respectively – results in shifts in and of only K and relative to the previous standard uncorrected result. All results with are consistent with values of = 15.3 K and = 1.2.

Fig. 6 summarises the integrated amplitudes of Galactic foregrounds at large (°) angular scales over the most important frequencies for CMB studies. Our best models for synchrotron ( scaled to the 408 MHz map), free-free (scaled H predictions assuming K; dot-dashed line) and thermal dust model (FDS7; dashed line) emissions are plotted in terms of thermodynamic temperature units (relative to K). The best-fit anomalous component is shown (heavy dotted line) over the range GHz. Data points are shown for synchrotron at 19.2 GHz (open triangle) anomalous dust at 19.2, 31.5, 53 and 90 GHz (open circles), total dust at 90 GHz (filled circle). The CMB signal is plotted at a level of K. The approximate total foreground level is represented by adding the four components in quadrature, with the anomalous component set to 52 K (the value at 19.2 GHz) for frequencies below 19.2 GHz. This suggests that the minimum foreground contamination for these data, is GHz. This is in good agreement with the WMAP analysis which predicts the minimum to lie at GHz.
The amplitudes for each of the foreground signals are now relatively well known as shown in Fig. 6. Strictly, Fig. 6 applies only for angular scales of and larger, and for all-sky observations with a Galactic cut of . For different Galactic cuts, there are likely to be variations of a factor of for reasonable Galactic cuts as indicated in Table 1. Observations covering smaller regions of sky, perhaps cleaner regions (for example, away from the North Polar Spur), may be have reduced foreground contamination by a factor of . Finally, at higher -values (smaller angular scales), it is known that diffuse Galactic foregrounds reduce in amplitude. The power spectra of Galactic emission have a typical power-law indices () of (Giardino et al. 2001). Thus at angular scales, the Galactic foregrounds, in terms of , will be reduced by a factor . However, at angular scales °, discrete extragalactic sources become the dominant foreground.
With relevance to the satellite missions WMAP and Planck, our analysis implies that the lowest level of foreground contamination from diffuse Galactic foregrounds at least on a 7°angular scale will be between 50 and 100 GHz. This has been confirmed by Bennett et al (2003b) and seems to hold to yet smaller scales 1°. Our study also predicts that for the WMAP experiment, the predominant foreground at 22, 30 and perhaps 40 GHz, will be due to the dust-correlated component. This is indeed found to be the case by the recent WMAP analysis, although the interpretation of the physical origin of the emission remains open to debate. More accurate determination of its spectral behaviour, allied to lower frequency observations (5-15 GHz) and higher angular resolution observations, should allow the mechanism behind this unexpected foreground to be ascertained. Moreover, given the likely region of minimal foreground contamination in frequency space, the importance of the Planck-LFI instrument to the Planck mission as a whole cannot be overemphasised.
Acknowledgments
The datasets were developed by the NASA Goddard Space Flight Center under the guidance of the Science Working Group and were provided by the NSSDC. The Wisconsin H-Alpha Mapper project is funded by the National Science Foundation. The Southern H-Alpha Sky Survey Atlas project is supported by the NSF. We acknowledge Dave Cottingham for providing us with a copy of the 19.2 GHz survey.
References
- (1) Agladze N.I., Sievers A.J., Jones S.A., Burlitch J.M., Beckwith S.V.W., 1996, ApJ, 462, 1026
- (2) Agladze N.I., Sievers A.J., 1998, Phys. Rev. Lett. 80, 4209
- (3) Banday A.J., Wolfendale A.W., 1991, MNRAS, 248, 705
- (4) Banday A.J., Górski K.M., Bennett C.L., Kogut A., Smoot G.F., 1996, ApJ, 468, L85
- (5) Banday A.J., Górski K.M., Bennett C.L., Kogut A., Lineweaver C.H., Smoot G.F., Tenorio L., 1997, ApJ, 475, 393
- (6) Bennett C.L. et al., 1996, ApJ, 464, L1
- (7) Bennett C.L. et al., 2003a, submitted to ApJ (astro-ph/0302207)
- (8) Bennett C.L. et al., 2003b, submitted to ApJ (astro-ph/0302208)
- (9) Bösch M.A., 1978, Phys. Rev. Lett., 40, 879
- (10) Boughn S., Cheng E.S., Cottingham D.A., Fixsen D.J., 1992, ApJ, 391, L49
- (11) Cottingham D.A., 1987, PhD Thesis, Princeton Univ.
- (12) Davies R.D., Watson R.A., Gutiérrez C.M., 1996, MNRAS, 278, 925
- (13) Dennison B., Simonetti J.H., Topasna G.A., 1998, Publ. Astron. Soc. Aust., 15, 147
- (14) de Oliveira-Costa A., Kogut A., Devlin M.J., Netterfield C.B., Page L.A., Wollack E.J., 1997, ApJ, 482, L17
- (15) de Oliveira-Costa A., Tegmark M., Page L.A., Boughn S., 1998, ApJ, 509 L9
- (16) de Oliveira-Costa A., Tegmark M., Gutiérrez C.M., Jones A.W., Davies R.D., Lasenby A.N., Rebolo R., Watson R.A., 1999, ApJ, 527, L9
- (17) de Oliveira-Costa A. et al., 2000, ApJ, 542, L5
- (18) de Oliveira-Costa A. et al., 2002, ApJ, 567, 363
- (19) Dickinson C., Davies R.D., Davis R.J., 2003, MNRAS, 341, 369
- (20) Draine B.T., Lazarian A., 1998a, ApJ, 494, L19 (DL98)
- (21) Draine B.T., Lazarian A., 1998b, ApJ, 508, 179
- (22) Draine B.T., Lazarian A., 1999, ApJ, 512, 740
- (23) Finkbeiner D.P., Davis M., Schlegel D.J., 1999, ApJ, 524, 867 (FDS)
- (24) Finkbeiner D.P., Schlegel D.J., Frank C., Heiles C., 2002, ApJ, 566, 898
- (25) Finkbeiner D.P., 2003, ApJS, in press
- (26) Gaustad J.E., McCullough P.R., Rosing W.R., Buren D.V., 2001, PASP, 113, 1326
- (27) Giardino G., Banday A.J., Fosalba P., Górski K.M., Jonas J.L., O’Mullane W., Tauber J., 2001, A&A, 371, 708
- (28) Górski K.M., 1994, ApJ, 430, L85
- (29) Górski K.M., Banday A.J., Bennett C.L., Hinshaw G., Kogut A., Smoot G.F., Wright E.L., 1996, ApJ, 464, L11
- (30) Haffner L.M., 1999, PhD Thesis, University of Wisconsin
- (31) Hancock S., Gutiérrez C.M., Davies R.D., Lasenby A.N., Rocha G., Rebolo R., Watson R.A., Tegmark M., 1997, MNRAS, 289, 505
- (32) Haslam C.G.T., Salter C.J., Stoffel H., Wilson W., 1982, A&AS, 47, 1
- (33) Hauser M.G., Kelsall T., Leisawitz D., Weiland J., 1998, Diffuse Infrared Background Experiment (DIRBE) Explanatory Supplement
- (34) Jaffe A.H. et al., 2003, ApJ, submitted
- (35) Jonas J.L., Baart E.E., Nicolson G.D., 1998, MNRAS, 297, 977
- (36) Jones A.W., Davis, R.J., Wilkinson A., Giardino G., Melhuish S.J., Asareh H., Davies R.D., Lasenby A.N., 2001, 327, 545
- (37) Kelsall T. et al., 1998, ApJ, 508, 44
- (38) Kneissl R., Egger R., Hasinger G., Soltan A.M., Trümper J., 1997, A&A, 320, 685
- (39) Kogut A., Banday A.J., Bennett C.L., Górski K.M., Hinshaw G., Reach W.T., 1996a, ApJ, 460, 1
- (40) Kogut A., Banday A.J., Bennett C.L., Górski K.M., Hinshaw G., Smoot G.F., Wright E.L., 1996b, ApJ, 464, L5
- (41) Kogut A., 1999, in de Oliveira-Costa A., Tegmark, M., eds, ASP Conf. Ser. Vol. 181, Microwave Foregrounds. Astron. Soc. Pac., San Francisco, p. 91
- (42) Lagache G., Haffner L.M., Reynolds R.J., Tufte S.L., 2000, A&A, 354, 247
- (43) Lagache G., 2003, submitted to A&A (astro-ph/0303335)
- (44) Lawson K.D., Mayer C.J., Osborne J.L., Parkinson M.L., 1987, MNRAS, 225, 307
- (45) Leitch E.M., Readhead A.C.S., Pearson T.J., Myers S.T., 1997, ApJ, 486, L23
- (46) Maino D. et al., 2002, MNRAS, 334, 53
- (47) Masi S. et al., 2001, ApJ, 553, L93
- (48) Mukherjee P., Jones A.W., Kneissl R., Lasenby A.N., 2001, MNRAS, 320, 224
- (49) Osterbrock D.E., 1989, Astrophysics of Gaseous Nebulae and Active Galactic Nuclei, University Science Books, Mill Valley, California
- (50) Pauliny-Toth I.K., Shakeshaft J.R., 1962, MNRAS, 124, 61
- (51) Platania P., Bensadoun, M., Bersanelli, M., de Amici, G., Kogut, A., Levin, S., Maino, D., Smoot, G.F., 1998, ApJ, 505, 473
- (52) Reach W.T. et al., 1995, ApJ, 451, 188
- (53) Reich P., Reich W., 1988, A&AS, 74, 7
- (54) Reynolds R.J., 1985, ApJ, 294, 256
- (55) Reynolds R.J., 1992, ApJ, 392, L35
- (56) Reynolds R.J., Tufte S.L., Haffner L.M., Jaehnig K.P., Percival J.P., 1998, Publ. Astron. Soc. Aust., 15, 14
- (57) Schlegel D.J., Finkbeiner D.P., Davis M., 1998, ApJ, 500, 525 (SFD)
- (58) Stolyarov, V., Hobson, M.P., Ashdown, M.A. J., Lasenby, A.N., 2002, MNRAS, 336, 97
- (59) Shaver P.A., McGee R.X., Newton L.M., Danks A.C., Pottasch S.R., 1983, MNRAS, 204, 53
- (60) Tauber J.A., 2000, in Harwitt M., Hauser M.G., eds, IAU Symp. 204, The Extragalactic Infrared Backgrounds and its Cosmological Implications’, ASP, San Francisco, p. 93
- (61) Valls-Gabaud D., 1998, Publ. Astron. Soc. Aust., 15, 111
- (62) White R.A., Stemwedel S.W., 1992 in Worrall D.M., Biemesdefer C., Barnes J., eds, ASP Conf. Ser. Vol. 25, Astronomical Data Analysis Software and Systems I. Astron. Soc. Pac., San Francisco, p. 379
- (63) Wood K., Reynolds R.J., 1999, ApJ, 525, 799