Radio Emission from an Ultraluminous X-Ray Source
The physical nature of ultraluminous x-ray sources is uncertain. Stellar mass black holes with beamed radiation and intermediate mass black holes with isotropic radiation are two plausible explanations. We discovered radio emission from an ultraluminous x-ray source in the dwarf irregular galaxy NGC 5408. The x-ray, radio and optical fluxes as well as the x-ray spectral shape are consistent with beamed relativistic jet emission from an accreting stellar black hole. If confirmed, this would suggest that the ultraluminous x-ray sources may be stellar-mass rather than intermediate mass black holes. However, interpretation of the source as a jet-producing intermediate-mass black hole cannot be ruled out at this time.
One of the most enigmatic results to emerge from x-ray population studies of galaxies is the discovery of non-nuclear x-ray sources which appear to have luminosities factors of 10 to 100’s times the Eddington luminosity for a neutron star – the so-called ultraluminous x-ray sources (?, ?, ?). The physical nature of these sources is controversial and possible models include very luminous supernova remnants (?), gamma-ray burst remnants (?), accreting stellar-mass compact objects with radiation which is beamed mechanically (?) or relativistically (?), or accreting intermediate mass black holes (?) with masses between 100 to several 1000 solar masses. The detection of x-ray variability in several sources suggests that these sources are powered by accretion of material from a companion star or interstellar gas (?, ?) and are not supernova or gamma-ray burst remnants. If the radiation from these variable sources is isotropic, then a high inferred luminosity requires an intermediate-mass black hole. If the radiation is beamed, then a stellar-mass black hole could explain the observations.
Optical counterpart searches have shown that ultraluminous x-ray sources preferentially occur near star-forming regions (?) although they are also found in old globular clusters (?, ?). In star-forming systems, one unique massive star counterpart has been identified (?) and nebulae have been detected around several sources (?). In some cases, counterpart searches have shown that the sources are background objects (?). Further identification of optical and radio counterparts is needed to reveal the physical nature of the ultraluminous x-ray sources.
The dwarf irregular galaxy NGC 5408 contains a well studied ultraluminous x-ray source, 2E 1400.2-4108 (?, ?, ?, ?). We observed the galaxy for a total exposure of 4683 s with the Chandra X-Ray Observatory on 7 May 2002 using the High-Resolution Mirror Assembly and the Advanced Camera Imaging Spectrometer spectroscopic array operated in an imaging mode suitable for a high count rate source (?). Images in the 0.3–8 keV band showed a point source (we place an upper limit on the source diameter of ) at a position of 14h 03m 19s.63, -41∘ 22′ 58′′.7 with an error radius of at 90% confidence and a flux of in the 0.3–8 keV band corrected for Galactic absorption along the line of sight. If the x-ray emission is isotropic, then the source luminosity would be in the 0.3–8 keV band at the distance of 4.8 Mpc to NGC 5408 (?). The long-term x-ray light curve (Fig. 1) shows variability at a level of 40%.
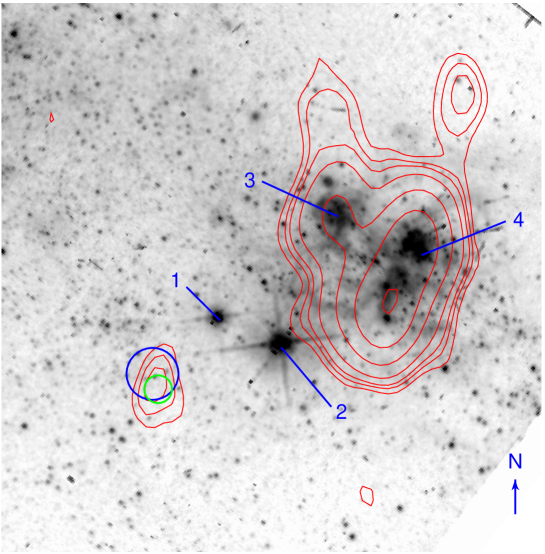
A 4.8 GHz radio map of NGC 5408 from the Australia Telescope Compact Array (ATCA) showed a radio source at the location of the x-ray source. We reprocessed the 8 hour ATCA observation of NGC 5408 taken on 31 March 2000 (?) to produce a natural weighted map that provides optimum signal to noise ratio for point sources at the cost of angular resolution. We detected a 4.8 GHz radio source with a flux of (1 error) at a position of 14h 03m 19s.606 and -41∘ 22′ 59′′.572 (J2000) with an error radius of at 90% confidence (?), consistent with the Chandra position within the astrometric uncertainties. No source is present at the same location in 8.64 GHz data obtained simultaneously with the 4.8 Ghz data and we place an upper limit (3) on the flux of 0.12 mJy based on the rms noise near that location. From the 4.8 GHz detection and the 8.64 GHz upper limit, we place a lower bound on the radio spectral index , defined so . From radio source counts (?) at 4.9 GHz, the probability of chance occurrence of a 0.18 mJy or brighter background radio source within the Chandra error circle is less than . To estimate the probability of chance coincidence with a radio source internal to the galaxy, we compare with NGC 1569 which is a dwarf irregular similar to NGC 5408 and has two sources which would have a 4.8 GHz flux of 0.18 mJy or larger if placed at the distance to NGC 5408 (?). The probability of chance coincidence within of the Chandra source given 2 radio sources within the optical extent of NGC 5408 is less than 0.002. Further, all of the radio sources in NGC 1569 have , which is inconsistent with the steep spectrum of our radio source.
Several optical sources in a Hubble Space Telescope (HST) image of NGC 5408 (Fig. 2) lie within the ATCA/HST error circle; note that the relative error circle is dominated by the HST astrometric uncertainty. The brightest object in the radio or x-ray error circles has a visual magnitude of 22.1. The colors of the objects detected in both bands are similar to those of the overall stellar population of the galaxy (?). None of the objects show evidence of extended emission.
Given the radio counterpart and the brightest optical counterpart in the Chandra error circle (which we take as an upper limit to the optical flux), we find that the x-ray to optical flux ratio (?) is . We can also calculate two-point spectral indices (?, ?) between the radio, optical, and x-ray bands using the flux density at 4.8 GHz, the V band, and 1 keV. We find that the radio to x-ray index , the optical to x-ray index , and the radio to optical index . The ratio of the object is much larger than the ratios found for stars, normal galaxies, clusters of galaxies, and AGN (?, ?). We rule out the possibility that the object is a member of any of these classes of source. Identification as a blazar is ruled out because the exceeds that of known blazars (?, ?), the radio spectrum is inconsistent with those of blazars which have (?), and the x-ray to radio flux ratio is which is an order of magnitude larger than the most extreme known blazar (?).
Some young supernova remnants have high x-ray luminosities. However, supernova remnants produce copious optical line emission, which is not detected here. Taking the brightest source in the Chandra error circle, the upper limit on the H emission is if all of the flux in the HST F606W filter is H emission. A similarly obtained upper limit on the [Oiii] emission is . These upper limits are below the line fluxes measured for highly x-ray luminous supernova remnants (?, ?). Optical line emission could be hidden by a high obscuring column (?), but such obscuration is inconsistent with the relatively low absorbing column density found from the x-ray spectrum (Fig. 3). Also, the observed x-ray variability would be unexpected for a supernova remnant. The line fluxes and the ratio are also inconsistent with identification of the source as a young supernova.
X-ray binaries and rotation-powered neutron stars sometimes have high ratios similar to what we find for the source in NGC 5408. The x-ray variability indicates the source is not a rotation-powered neutron star. If the source was located in the Milky Way, the luminosity would be of order . Radio emissions when detected from Galactic x-ray binaries in such low luminosity states (?, ?) have a flat or inverted spectra which is inconsistent with the steep spectrum of the source and suggests that the source is not a low-luminosity x-ray binary in the Milky Way. The steep radio spectrum is consistent with optically thin synchrotron emission as produced by x-ray binaries in high luminosity states or during state transitions (?, ?, ?) and is consistent with the source being an x-ray binary in NGC 5408. The source x-ray variability may be less than seen from many x-ray binaries, but is consistent with that of Cyg X-1.
Radio emissions from x-ray binaries are associated with relativistic jets. The radio emission we detected from the ultraluminous x-ray source in NGC 5408 is probably from a relativistic jet. It could be from an accreting stellar-mass black hole producing relativistic jets (a microquasar) beamed toward us (?). The intensity of isotropic rest-frame emission from a continuous jet with a power law spectrum with radio spectral index is amplified by a factor where is the Doppler factor (for the approaching jet) where is the jet speed as a fraction of the speed of light and . The Galactic microquasar GRS 1915+105 has and a distance near (?). GRS 1915+105 is highly variable. Radio fluxes of about at 4.8 GHz are observed in bright radio flares when superluminal jets are resolved, whereas the more typical radio fluxes are about while the source is x-ray active but not undergoing a bright radio flare. If the ATCA observation happened to catch the NGC 5408 source during such a bright flare, then a Doppler factor as low as would suffice to produce the observed radio flux (with ). However, the probability of catching such an event with a single radio observation is low unless the NGC 5408 source is an extremely active jet source. Scaling from the more typical radio flux of GRS 1915+105 of about , we find that a Doppler factor would be needed to produce the observed flux. This is compatible with the constraints on the ejecta velocities for GRS 1915+105. If as inferred for GRS 1915+105, then tilts of the jet axis relative to the line of sight of up to could produce . Roughly 1 out of 70 of extragalactic microquasars should be aligned like this. A steeper radio spectral index or higher intrinsic luminosity would reduce the required .
The x-ray emission could also be relativistically beamed jet emission (?). The fact that rules out the possibility that a single component spectrum, like synchrotron emission, produces both the radio and x-ray emission. Inverse-Comptonization of photons from a massive companion star by a jet may power the ultraluminous x-ray sources (?). The x-ray spectrum predicted by this process has the form of a broken power law with the break near 1 keV and a cutoff at energies above the x-ray band. The Chandra x-ray spectrum is consistent with this form (Fig. 3) with a break energy of and a spectral index at high energies of . The beaming pattern for inverse-Compton emission with a photon source external to the jet, e.g. from the companion star, varies as for a continuous jet, so very large amplifications are possible, e.g. for . Hence, the jet x-ray luminosity may be as low as . The break energy we measure is similar to what has been modeled (?). However, our measured x-ray spectral parameters would imply an unusually steep power law index for the injected relativistic electrons of .
If the source is an accreting black hole and the x-ray emission is isotropic, then the luminosity implies a minimum mass of . The spectral index of the hard spectral component, if the spectrum is fitted with the sum of a power law plus thermal accretion disk emission, is which is similar to that found for black hole candidate x-ray binaries in their high flux states (?). The temperature of the soft thermal component is which is lower than found for stellar mass black holes in the Milky Way (?). Such a low temperature is also unlikely to arise from mechanically beamed radiation from a stellar-mass black hole (?). Some other ultraluminous sources have high temperatures, which is inconsistent with the presence of intermediate mass black holes unless they are very rapidly rotating (?). The low temperature found for the NGC 5408 source is consistent with that expected for a non-rotating black hole with a mass above (?, ?). The radio spectral index and the radio to x-ray flux ratio are similar to the (highly variable) ones measured for microquasars (?, ?) suggesting that the radio emission could arise from jets similar to those produced by microquasars. The source lies about from the star formation regions of NGC 5408 that contain super star clusters, giving a projected displacement of 280 pc. An x-ray binary with a speed of 10 km/s, from either interactions in a cluster or a supernova kick, could traverse this distance in 30 My. Hence, an intermediate mass black hole could have formed in one of the observed super star clusters (?) and moved to the present location within the life time of a massive companion star.
The ultraluminous x-ray sources have been interpreted as evidence for intermediate mass black holes (?). The results presented here show that the radio, optical, and x-ray properties of the ultraluminous x-ray source in NGC 5408 are consistent with beamed emission of a relativistic jet from a stellar-mass black hole. This suggests that, at least some of, the ultraluminous x-ray sources may be beamed emission from stellar-mass black holes (?).
References
- 1. G. Fabbiano, Annu. Rev. Astron. Astrophys. 27, 87 (1989).
- 2. E.J.M. Colbert, R.F. Mushotzky, Astrophys. J. 519, 89 (1999).
- 3. T.P. Roberts, R.S. Warwick, Mon. Not. R. Astron. Soc. 315, 98 (2000).
- 4. A.C. Fabian, R. Terlevich, Mon. Not. R. Astron. Soc. 280, L5 (1996).
- 5. Q.D. Wang, S. Immler, W. Pietsch, Astrophys. J. 523, 121 (1999).
- 6. A.R. King et al., Astrophys. J. 552, L109 (2001).
- 7. K. Makishmia et al., Astrophys. J. 535, 632 (2000).
- 8. P. Kaaret et al., Mon. Not. R. Astron. Soc. 321, L29 (2001).
- 9. T.P. Roberts et al., Mon. Not. R. Astron. Soc. 325, L7 (2001).
- 10. L. Angelini, M. Loewenstein, R.F. Mushotzky, Astrophys. J. 557, L35 (2001).
- 11. H. Wu et al., Astrophys. J. 576, 738 (2002).
- 12. J.-F. Liu, J.N. Bregman, P. Seitzer, Astrophys. J. 580, L31 (2002).
- 13. Pakull, M.W. & Mirioni, L. in ’New Visions of the X-ray Universe in the XMM-Newton and Chandra Era’, 26-30 November 2001, ESTEC, The Netherlands, astro-ph/0202488 (2002).
- 14. L. Foschini et al., Astron. Astrophys. in press, astro-ph/0209500 (2002).
- 15. G.C. Stewart et al., Mon. Not. R. Astron. Soc. 200, 61P (1982).
- 16. A.C. Fabian, M.J. Ward, Mon. Not. R. Astron. Soc. 263, L51 (1993).
- 17. C. Motch, M.W. Pakull, W. Pietsch, in Violent Star Formation from 30 Doradus to QSOs, G. Tenorio-Tagle, Ed. (Cambridge Univ. Press, 1994), pp. 208-213.
- 18. M.C. Weisskopf et al., Proc. Astron. Soc. Pacific 114, 1 (2002).
- 19. I.D. Karachentsev et al., Astron. Astrophys. 385, 21 (2002).
- 20. I.R. Stevens, D.A. Forbes, R.P. Norris, Mon. Not. R. Astron. Soc. 335, 1079 (2002).
- 21. J.E. Reynolds et al., Astron. Astrophys. 304, 116 (1995).
- 22. A. Greve et al., Astron. Astrophys. 381, 825 (2002).
- 23. R.B. Partridge, K.C. Hilldrup, M.I. Ratner, Astrophys. J. 308, 46 (1986).
- 24. T. Maccacaro et al., Astrophys. J. 253, 504 (1982).
- 25. H. Tananbaum et al., Astrophys. J. 234, L9 (1979).
- 26. J.T. Stocke et al., Astrophys. J. 76, 813 (1991).
- 27. H. Landt et al., Mon. Not. R. Astron. Soc. 323, 757 (2001).
- 28. Y.-H. Chu, C.-H. Chen, S.-P. Lai, in Supernovae and Gamma-Ray Bursts, ed. M. Livio, N. Panagia, K. Sahu, Ed. (Cambridge Univ. Press, 2001), pp. 131-143.
- 29. W.P. Blair et al., Astrophys. J. 272, 84 (1983).
- 30. T.P. Roberts et al., Mon. Not. R. Astron. Soc. in press, astro-ph/0208196 (2002).
- 31. R.P. Fender, Mon. Not. R. Astron. Soc. 322, 31 (2001).
- 32. S. Corbel et al., Astrophys. J. 554, 43 (2001).
- 33. I.F. Mirabel, L.F. Rodríguez, Annu. Rev. Astron. Astrophys. 37, 409 (1999).
- 34. R.P. Fender et al., Mon. Not. R. Astron. Soc. 304, 865 (1999).
- 35. E. Körding, H. Falcke, S. Markoff, Astron. Astrophys. 382, L13 (2002).
- 36. M. Georganopoulos, F.A. Aharonian, J.G. Kirk, Astron. Astrophys. 388, L25 (2002).
- 37. Y. Tanaka, N. Shibazaki, Annu. Rev. Astron. Astrophys. 34, 607 (1996).
- 38. K. Ebisawa et al., Proc. Astron. Soc. Japan 46, 375 (1994).
- 39. T. Ebisuzaki et al., Astrophys. J. 562, L19 (2001).
- 40. Harris, D.E. et al. 1993, The Einstein Observatory catalog of IPC X ray sources, (Cambridge, MA, Smithsonian Institution, Astrophysical Observatory).
- 41. A.E. Dolphin, A.E. Proc. Astron. Soc. Pacific 776, 1383 (2000).
- 42. D. Schlegel, D. Finkbeiner, M. Davis, Astrophys. J. 500, 525 (1998).
- 43. We thank Markos Georganopoulos for explaining the details of his model, the Chandra team for carrying out the observations, Michael Garcia and Albert Kong for useful comments, John Reynolds and Taso Tzioumis for discussions of ATCA position uncertainties, and the Aspen Center for Physics where part of this work was carried out. This work was supported in part by a NASA LTSA grant and a Chandra grant. We made use of NASA’s HEASARC. The Australia Telescope is funded by the Commonwealth of Australia for operation as a National Facility managed by CSIRO.