Using bright ellipticals as dark energy cosmic clocks
Abstract
The age of the Universe has been increasingly constrained by different techniques such as the observations of type Ia supernovae at high redshift or dating the stellar populations of globular clusters. In this paper we present a complementary approach using the colours of the brightest elliptical galaxies in clusters over a wide redshift range (). We put new and independent bounds on the dark energy equation of state parameterised by a constant pressure-to-density ratio as well as by a parameter () which determines the scaling between the matter and dark energy densities. We find that accurate estimates of the metallicities of the stellar populations in moderate and high redshift cluster galaxies can pose stringent constraints on the parameters which describe the dark energy equation of state. Our results are in good agreement with the analysis of dark energy models using SNIa data as constraint. Accurate estimates of the metallicities of stellar populations in cluster galaxies at will make this approach a powerful complement to studies of cosmological parameters using high redshift SNIa.
keywords:
galaxies: elliptical and lenticular, cD — galaxies: evolution — cosmology: Cosmic Microwave Background, anisotropy, power spectrum1 Introduction
The discovery that the evolution of the Universe may be dominated by an effective cosmological constant is one of the most remarkable findings of recent years. An exceptional opportunity is now opening up to decipher the nature of dark energy, to test the veracity of theories and to reconstruct the dark energy’s profile using a wide variety of observations over a broad redshift range.
One energy candidate that could possibly explain the observations is a dynamical scalar “quintessence” field. In many cases these models alleviate the fine-tuning and coincidence problems carried by a cosmological constant (Zlatev et al. 1999). The most relevant observational evidence for quintessence is that its equation of state parameter, can assume values different from , which is the expected value in the case of a cosmological constant. Moreover, since very little is known currently about the nature of dark energy, an interaction (aside from gravity) of quintessence with the remaining forms of matter could be expected as well (e.g. Wetterich 1995).
Other deviations from a cosmological constant can be considered as, for example, a sound speed different from light or perturbations in the dark energy fluid. However these aspects of quintessence affect mainly the growth of perturbations and their detectability is therefore subjected to the assumption of a model of structure formation. In this work we will be most interested in the effect that dark energy causes on the background evolution. In particular, we show that an accurate determination of the age of the Universe can be used to obtain important and independent information on the dark energy component.
Discrepancies between age determinations have long plagued cosmology. The situation has changed drastically in recent years: Type Ia supernova measurements (Perlmutter et al. 1999; Riess et al. 1998), the acoustic peaks in the CMB anisotropies (Netterfield et al. 2001), cosmochronology of long-lived radioactive nuclei in old Population II stars (Cayrel et al. 2001), just to name a few, are all consistent with an age Gyr. Furthermore, the recent age determination of the oldest white dwarf in the globular cluster M4 by the Hubble Space Telescope, with at c.l. (Hansen et al. 2002), can be used to put the strongest lower limit to date on the age of the Universe.
It is therefore timely to investigate if the new age determinations can be used to produce new constraints on dark energy. These results could also prove very useful in breaking some of the degeneracies that arise in cosmological parameter estimations from other observational sources (e.g. Bean & Melchiorri 2002; Maor et al. 2002).
Recently, Krauss & Chaboyer (2001), have provided constraints on by using new globular cluster age estimates. Our analysis will differ in two new fundamental aspects: first we will use age estimates based on old stellar populations at moderate redshift. As in (Ferreras, Melchiorri & Silk 2001) we will provide estimates on the age of the Universe via a comparison of population synthesis models with the photometry of the oldest stellar populations in bright cluster ellipticals. Second, following the parametrization of Dalal et al. (2001) we will also investigate the possibility of an interaction besides gravity between dark energy and dark matter.
2 Models of Dark Energy and the age of the Universe.
In the literature one can find many proposals of scalar field dark energy models, differing by the choices of the self-interacting potentials (e.g. Sahni 2002), resulting in equations of state that in general depend on time. On the other hand, the age of the Universe is most influenced by the relatively late evolution history. This enables us to simplify the problem by assuming a constant equation of state for the dark energy. A parameter determination through a likelihood analysis would very probably have a few chances of detecting a relatively smooth variation of the equation of state. This line of reasoning is very similar to the one usually expressed in many studies of constraint from SN-Ia (Maor et al. 2002).
In fact, as our results will show, the SNe parameter degeneracy is significantly similar to our case. Thus our work in a way offers an independent check of those findings. This has its own relevance due to the intense debate on whether all the important systematic errors have been taken into account in SNe data reports. In what follows the sub-indices , and indicate respectively the contributions from dark energy-quintessence, cold dark matter (CDM) and baryons. The collective CDM and baryonic contribute will be represented by the label . We will adopt a quite general phenomenological model in which the ratio of the dark energy and dark matter densities scale as a power law:
| (1) |
with kept constant (as in Dalal et al. 2001). It should be noted that this assumption generally involves an interaction besides gravity. The dark energy equation of state, , is held fixed as stated above. Three interesting cases deserve particular attention. Putting and gives the CDM model. The condition corresponds to decoupled quintessence. Furthermore the choice implies models that may explain the coincidence problem through an identical scaling of the two energy densities (e.g. Tocchini-Valentini & Amendola 2002, Amendola & Tocchini-Valentini 2001). The baryons are assumed coupled only through gravity to the rest of the world.
To perform a comparison with the data we will need an expression of the age of the Universe for this class of models. This is given by:
| (2) |
If then
| (3) |
While when we have that
| (4) |
where
| (5) |
The inclusion of baryons is important since their contribution may become significant not too far in the past history of the Universe and their exclusion may overestimate the age of the Universe by more than relative to the complete case, especially for highly negative values of .
In the decoupled case it has been shown that values of the equation of state such that are not completely excluded by observations (Melchiorri et al 2002, Schuecker et al. 2002). Therefore in our analysis we will consider the interval . The limitations will be imposed on the parameter . To reduce the number of free parameters we consider a flat Universe. For models of coupled quintessence we fix for the density of CDM and baryons altogether, and we also fix for baryons.
3 Using bright ellipticals as dark energy cosmic clocks
The use of bright cluster ellipticals over a wide range of redshifts allow us to set contraints on the age of the Universe. In the volume spanned by the various cosmological parameters involved, these constraints go roughly “in the same direction” as the constraints from high redshift SNe data — which depend on the luminosity distance, and thus provide an independent method to explore the allowed values of the parameters. Ferreras et al. (2001) used this approach to determine the age of the Universe and showed that the results were consistent with estimates using other observations such as high redshift SNIa (Riess et al. 1998; Perlmutter et al. 1999), age dating of globular clusters (Salaris & Weiss 1998; Pont et al. 1998; Carretta et al. 2000) or nucleocosmochronology of old halo stars (Cayrel et al. 2001).
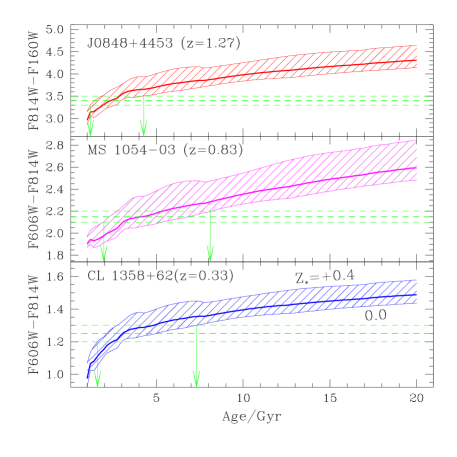
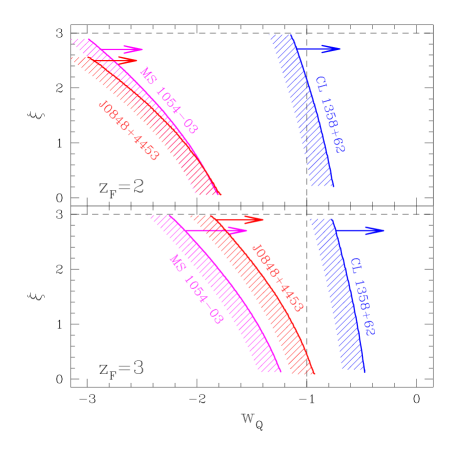
Figure 1 shows the methodology of this approach. The colours of the first few brightest ellipticals from clusters at moderate redshift is compared with the predictions of the population synthesis models of Bruzual & Charlot (1993) for a range of ages and metallicities. The latest available version of these models have been used. The shaded area represents the colours for the metallicity range dex, as expected in the central regions of bright ellipticals (Henry & Worthey 1999). The dashed lines in each panel correspond to the observed colours of the brightest ellipticals in clusters: CL 1358+62 (; Van Dokkum et al. 1998); MS 1054+03 (; Van Dokkum et al. 2000), and J0848+4453 (; Van Dokkum & Stanford 2002). The arrows give the allowed age of the Universe at the redshift of the cluster for the metallicity range expected in bright early-type galaxies. The upper limit can be used to constrain the allowed values of the parameters and . Figure 2 shows the constraint imposed by the upper limit expected for the three clusters shown in the previous figure. Some of the cosmological parameters have been fixed, namely: , , km s-1 Mpc-1, and . The allowed region stays to the right of the shaded line for each of the three clusters. As reference, a CDM cosmology corresponds to . A formation redshift of is assumed, an arguably late epoch for the formation of massive elliptical galaxies given the redshift evolution of the colour-magnitude relation (e.g. Stanford, Eisenhardt & Dickinson 1998). Earlier formation epochs are possible and will further constrain the region of parameter space to the right of the figure.
A more comprehensive analysis was performed using the complete sample of 17 clusters from Stanford et al. (1998) over the redshift range . This sample was extracted from a larger sample of clusters drawn from a variety of optical, X-ray and radio-selected clusters. The morphological classification was done from high resolution images taken by the Wide Field and Planetary Camera 2 on board the Hubble Space Telescope. We selected the three brightest early-type galaxies for each cluster, and used the published photometry in NIR passbands , and , as well as on two optical filters which straddle the 4000Å break. Along similar lines as the method shown above, we compare the photometry with the predictions of the latest population synthesis models of Bruzual & Charlot (1993). Furthermore, the stellar populations in these bright galaxies are assumed to evolve into those observed in bright ellipticals in local clusters such as Coma or Virgo. Hence, a further constraint is imposed comparing the colour when the galaxy is evolved to zero redshift.
The models are run assuming a flat cosmology. The dark energy parameters are explored over a large range: ; and either or for coupled and uncoupled models, respectively. The former assume fixed values for and . Uncoupled models are obviously independent of the baryon density. We assume a wide range of formation redshifts: and stellar metallicities: . A Salpeter (1955) initial mass function (IMF) was used, although the results – which are purely constrained by galaxy colour, not absolute luminosity – are rather insensitive to the choice of IMF.
4 Discussion
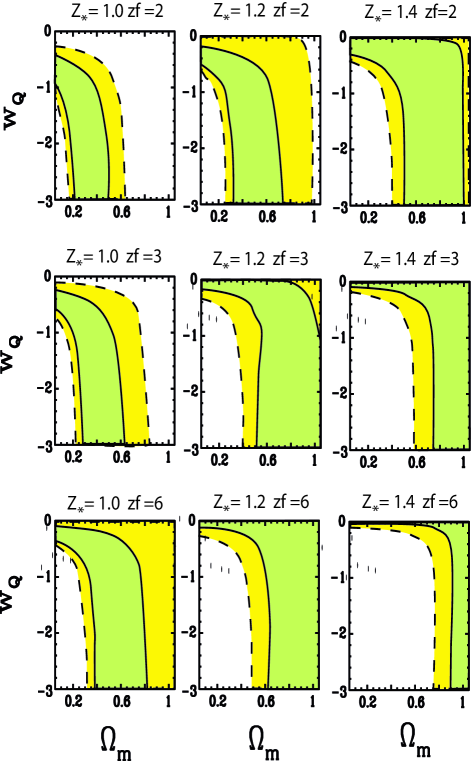
The results of our analysis are reported in figures 3 and 4. For each theoretical model we compare the ages obtained through equation 2 with the observational data. Likelihood contours at the (solid), and (dashed) confidence levels are shown in the (uncoupled, Fig. 3) and (coupled, Fig. 4) planes. Since the results depend also on extra parameters involving the stellar populations, namely the metallicity () and the formation redshift () we have investigated different possible values for these two parameters. In all the plots we have assumed a gaussian distributed prior on the Hubble parameter as indicated by the Hubble Space Telescope Key project (Freedman et al. 2001). In Fig. 3 we report the results of our analysis assuming uncoupled dark energy models and for different choices of and . As we can see from the plots a degeneracy is present in the tradeoff between and (higher values of are consistent with a higher ) and no strong independent constraint can be obtained on these parameters. Furthermore, there is a strong and similar dependence on formation redshift and metallicity. Namely, an increase in or shifts the likelihood contours towards higher values of . A model with and , for example, is excluded at high significance when “reasonable” values of and are assumed, while an increase in formation redshift or metallicity pushes this model back to the confidence level. On the other hand, a low value of can be used as a way to revert the argument: if we assume a “concordance” model with and , then high values of the formation redshift and the metallicity of the stellar populations in bright cluster ellipticals are disfavoured. Marginalizing over and gives the upper limits and at C.L.. These limits even if less stringent are in good agreement with those obtained from observations of luminosity distances of type Ia supernovae.
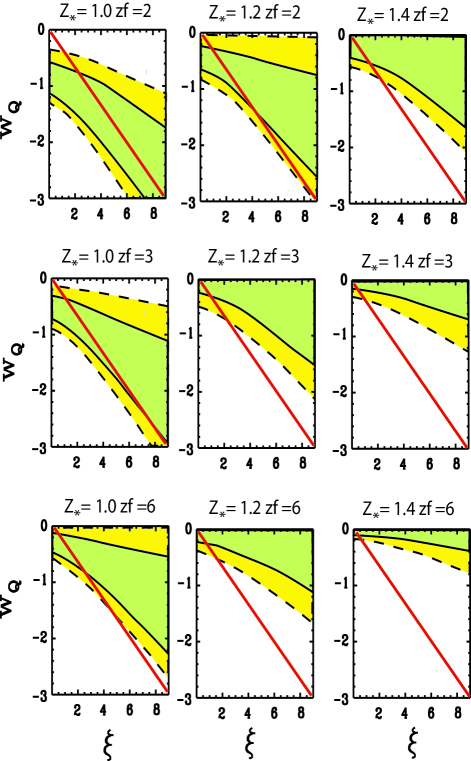
In figure 4 we plot the contours in the planes fixing . The thick diagonal line represents uncoupled models. The figure shows that even if is kept fixed, no strong limit on can be placed. We cannot disentangle the degeneracy between and if low metallicities () or late formation epochs () are assumed. However, coupled models () are not favoured in our analysis, unless one is willing to have high and . We should emphasize that is treated as a free parameter that determines the ages of the stellar populations. Structure formation studies for the models explored in this paper would provide further constraints on the allowed region of parameter space. Nevertheless, the models with are disfavoured in the light of the results from high redshift SNIa (Dalal et al. 2001) which rule out models with regardless of at the C.L. Even models with would be hard to reconcile with the SNIa data if the formation redshift is too high.
Figures 3 and 4 illustrate the fact that an accurate estimate of the metallicity along with a combined analysis with high redshift SNIa would pose strong constraints on dark energy parameters. High metallicities in massive ellipticals are expected if we assume a scenario with a highly efficient star formation in which most of the ejecta from stars is recycled back into subsequent generations of stars. Wind models for elliptical galaxy formation support a mass-metallicity relation which is caused by the potential well of the galaxy which prevents significant gas outflows in massive galaxies thereby achieving high metallicities (Larson 1974; but see Silk 2003). Massive elliptical galaxies such as those targeted in this study should have solar or even supersolar average metallicities. However, the current data does not allow us to set a stringent constraint on . Hence, in addition to advancing our knowledge of galaxy formation and evolution, accurate measurements of stellar metallicities in galaxies at moderate and high redshift will have a very significant impact on estimates of the cosmological parameters.
The likelihood regions shown in the figure are in good agreement and/or consistent with those obtained by the analysis of high redshift SNIa (Dalal et al. 2001) for most of the models explored in this paper. Furthermore, our decoupled models (figure 3) agree well with the estimates from globular cluster ages (Krauss & Chaboyer 2001). Hence, the study of the colours of the stellar populations in moderate redshift elliptical galaxies deserves a place of its own as an estimator of cosmological parameters.
Acknowledgments
It is a pleasure to thank Rachel Bean, Licia Verde and Joe Silk for useful comments. AM is supported by PPARC, DT-V is funded by a Scatcherd Scholarship.
References
- (1) Amendola, A. & Tocchini-Valentini D., 2001, PRD, 64, 043509
- (2) Bean, R. & Melchiorri, A., 2002, PRD, 65, 041302
- (3) Bruzual, A. G. & Charlot, S. 1993, ApJ, 405, 538
- (4) Carretta, E., Gratton, R. G., Clementini, G. & Fusi Pecci, F. 2000, ApJ, 533, 215
- (5) Cayrel, R. et al. 2001, Nature, 409, 691
- (6) Dalal, N., Abazajian, K., Jenkins, E. & Manohar, A. V., 2001, PRL, 87, 1302
- (7) Ferreras, I., Melchiorri, A. & Silk, J., 2001, MNRAS, 327, L47
- (8) Freedman, W. L., et al., 2001, ApJ, 553, 47
- (9) Henry, R. B. C. & Worthey, G., 1999, PASP, 111, 919
- (10) Larson, R. B., 1974, MNRAS, 169, 229
- (11) Maor, I. et al., 2002, PRD, 65, 123003
- (12) Melchiorri, A. et al., 2002, astro-ph/0211522
- (13) Krauss, L. M. & Chaboyer, B. 2001, astro-ph/0111597
- (14) Netterfield, C. B., et al. 2001, ApJ, submitted. astro-ph/0104460
- (15) Perlmutter, S., et al. 1999, ApJ, 517, 565
- (16) Pont, F., Mayor, M., Turon, C. & VandenBerg, D. A. 1998, A&A, 329, 87
- (17) Riess, A. G. et al. 1998, AJ, 116, 1009
- (18) Sahni, V., 2002, Class. Quant. Grav., 19, 3435
- (19) Salaris, M. & Weiss, A. 1998, A&A, 335, 943
- (20) Salpeter, E. E. 1955, ApJ, 121, 161
- (21) Schuecker, P. et al., 2002, astro-ph/0211480
- (22) Silk, J., 2003, MNRAS, astro-ph/0212068
- (23) Stanford, S. A., Eisenhardt, P. R. & Dickinson, M. 1998, ApJ, 492, 461
- (24) Tocchini-Valentini, D. & Amendola, L., 2002, PRD, 65, 063508
- (25) van Dokkum, P. G., Franx, M., Kelson, D. D., Illingworth, G. D., Fisher, D. & Fabricant, D., 1998, ApJ, 500, 714
- (26) van Dokkum, P. G., Franx, M., Fabricant, D., Illingworth, G. D. & Kelson, D. D., 2000, ApJ, 541, 95
- (27) Van Dokkum, P. G. & Stanford 2002, ApJ, in press, astro-ph/0210643
- (28) Wetterich, C., 1995, A&A, 301, 321
- (29) Zlatev, I. et al., 1999, PRL, 82, 896