Constraints to the evolution of Ly- bright galaxies between and ††thanks: Based on observations obtained at the ESO VLT, Paranal, Chile; ESO programs 67.A-0175 and 68.B-0088
Galaxies at high redshift with a strong Ly- emission line trace massive star formation in the absence of dust, and can therefore be regarded as a prime signature of the first major starburst in galaxies. We report results of the Ly- search within the Calar Alto Deep Imaging Survey (CADIS). With imaging Fabry-Perot interferometer CADIS can detect emission lines in three waveband windows free of night-sky emission lines at 700 nm, 820 nm, and 920 nm. The typical flux detection limit for Ly- emission redshifted into these windows, , corresponds to (unobscured) star formation rates of /yr at . Candidate Ly--emitting galaxies are selected from the total emission line sample, which contains more than 97% of objects at , by the absence of flux below the Lyman limit (B-band “dropouts”), and the non-detection of secondary emission lines in narrow band filters. We have detected 5 bright Ly--emitting galaxy candidates at , and 11 candidates at . For two of four observed Ly- candidates, one candidate at , and the other at , the emission line detected with the Fabry-Perot has been verified spectroscopically at the VLT. When compared to Ly- surveys at even the upper limits set by our list of candidates show that bright Ly- galaxies are significantly rarer at than the assumption of a non-evolving population would predict. Therefore we conclude that the Ly- bright phase of primeval star formation episodes reached its peak at redshifts .
Key Words.:
galaxies:evolution – galaxies:formation – galaxies: emission lines – galaxies: Ly-1 Introduction
Important observational information about the epoch of galaxy formation can only be gained from the existence, number counts and properties of galaxies at very high redshift. In the past couple of years substantial progress has been made in discovering galaxies at redshifts . Several dozens of Lyman break galaxies have been detected at (e.g., Steidel et al. steidel99 (1999)). In addition, a substantial number of galaxies at have been detected and verified spectroscopically (e.g., Dey et al. dey (1998); Weyman et al. weyman (1998); van Breughel et al. vanBr (1998); Hu et al. hu99 (1999); Hu et al. hu02 (2002); Ellis et al. ellis (2001); Dawson et al. dawson (2002); Ajiki et al. ajiki (2002); and Rhoads et al. rhoads02 (2002)); one of these (van Breughel et al. vanBr (1998)) is a radio galaxy at . Quasars have been identified out to (e.g., Pentericci et al. pent (2002); Fan et al. fan01 (2001)). However, there is a lack of systematic surveys for high redshift primeval galaxies. Many of the galaxies at have been detected serendipitously.
Moreover, as it has been pointed out, e.g., by Steidel et al. (steidel96 (1996)), the strong metal absorption lines in the spectra of Lyman break galaxies indicate that they have already formed at least one generation of stars which has chemically enriched the systems and lead to dust formation, making Ly- emission weak or undetectable. Therefore, the Lyman break galaxies do not show the properties expected for primeval galaxies. In contrast to the Lyman break galaxies, all but one of the galaxies found at exhibit a very strong Ly- emission line, in agreement with population synthesis models for primeval galaxies of Charlot & Fall (charlot (1993)), which predict that a young, dust free, star forming galaxy should show strong Ly- emission with (intrinsic) equivalent widths in the range of 5-25 nm.
A direct probe of galaxy formation is to determine the number counts and redshift evolution of those nascent galaxies. Several systematic surveys aimed at discovering a significant number of galaxies have now been proposed and are being carried out, e.g., Cowie & Hu (cowie (1998)), Rhoads et al. (rhoads (2000)) and our survey, the Calar Alto Deep Imaging Survey (CADIS, Meisenheimer et al. meise98 (1998), meise03 (2003)). At , a universe with standard parameters km s-1 Mpc-1, , is only 1.2 Gyr old, corresponding to a look-back time of % of the age of the universe. Any object observed at this or an earlier epoch should mark the early stages of galaxy formation.
Unlike the Lyman break technique (e.g., Steidel & Hamilton steidel92 (1992), steidel93 (1993)), which selects galaxies by the presence of young stars and intervening HI absorption, CADIS selects galaxies by the extreme equivalent widths of their Lyman--emission (). It has been demonstrated by Kudritzki et al. (kudr (2000)) that the high Ly- equivalent width of these galaxies can only arise in regions nearly free of dust, and therefore the Ly- emission line is a good tracer of star formation from primordial material. Unlike similar programmes at 810 m telescopes, CADIS aims to find the most luminous starbursts, with SFR /year, which most likely led to the formation of the galactic bulge. Even in the age of 10-m telescopes, only these luminous starbursts are accessible for detailed spectroscopic follow-up.
This paper is structured in the following way: In section 2 we describe how we select Ly- galaxy candidates at with CADIS. In section 3 we present the spectroscopic follow-up of some Ly- candidates. Finally, in section 4 we discuss the comparison between observed and theoretical number counts of Ly--emitting galaxies up to .
2 Lyman- candidates from the CADIS survey
CADIS combines a moderately deep multi-band survey (10 limit, R) with a deep emission line survey employing an imaging Fabry-Perot-Interferometer (), which covers three waveband windows essentially free from atmospheric OH emission lines: A ( nm), B ( nm), and C ( nm). The classification and analysis of emission line galaxies from CADIS are outlined in Hippelein et al. (hippe (2003)), Meisenheimer et al. (meise03 (2003)). Therefore, in this section we will present only those aspects which are relevant to the search of Ly- galaxies using the CADIS (emission line) survey.
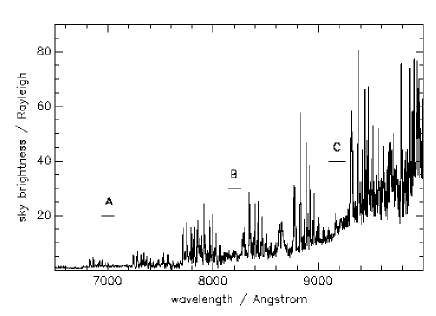
The optimal detection of a weak emission line galaxy superimposed on the bright night sky is reached when the instrumental resolution is adapted to the expected line width. Assuming , a typical virial velocity of a Milky Way-like galaxy, yields nm for a Lyman- emission line at . On the other hand, the detection probability increases with the observed volume , where denotes the solid angle surveyed. Using a Fabry-Perot (FP) Etalon with nm, which is tuned in 9 steps and covers an interval of nm, CADIS provides an optimal compromise of both sensitivity and search volume. The three wavelength intervals (A, B, and C, see Figure 1) which are scanned by CADIS correspond to Lyman- redshifts of , 5.7, and 6.6, respectively. The field size is arcmin2. Model predictions (Thommes & Meisenheimer 1995) of the galaxy abundance down to a line flux limit F (which can be reached with the Calar Alto 2.2- and 3.5-m telescopes within a few hours of observing time) made clear, before the project had even started, that at most a handful of Lyman- galaxies would be expected per field and wavelength interval in the case of an open universe, which is commonly assumed today (, ). Accordingly we decided to search every wavelength interval in five fields. After six years of observations on Calar Alto, 90% of the planned Fabry-Perot data have been obtained. The Fabry-Perot wavelength intervals which have been almost completely analysed are given in Table 1. The analysis of interval C has been postponed for the moment because of technical problems (strong “fringing” in the CCD images), and low expectations of success on the basis of the present results at , which will be presented in this paper.
| Field | FP-window | Center coordinates | |||
| name | observed | (2000) | (2000) | arcmin2 | analysed |
| () | (∘ ′ ′′) | ||||
| 01h | B | 01 47 33.3 | 02 19 55 | 105 | 0.095 |
| 09h | A | 09 13 47.5 | 46 14 20 | 98 | 0.082 |
| B | 0.070 | ||||
| 16h | B | 16 24 32.3 | 55 44 32 | 107 | 0.095 |
| 23h | A | 23 15 46.9 | 11 27 00 | 103 | 0.057 |
| B | 0.082 | ||||
The following results are based on the data in the FP-windows in four CADIS fields presented in Table 1. It should be noted that the analysis of 69% of window B, and only 27% of window A has been finished (see Table 1), in terms of the final : will be , corresponding to five CADIS fields, for each Fabry-Perot window will be .
The current classification of emission line galaxies shows that more than 97% of the emission line galaxies are foreground galaxies (), in which we mainly detect the lines , , , and . Therefore, the main challenge is to separate those foreground objects from the Ly- candidates. We identify Lyman--galaxy candidates among the emission line galaxies by the following exclusion criteria:
(1) There should be no flux below the Lyman limit of a Lyman- galaxy, because of an intrinsic drop in the spectra of hot O and B stars at the Ly-limit (Charlot & Fall charlot (1993)), and absorption by the neutral interstellar medium either in the galaxy itself (Leitherer et al. 1995a , 1995b ) or in Lyman-limit foreground systems close to the primeval galaxy. For the Lyman limit lies at nm. Therefore, no flux should be detected in the CADIS B filter ( nm, FWHM nm). Accordingly, we require that (“blue dropouts”), where is the flux measured in the B filter, and its true overall error which takes into account both calibration errors and the scatter of the flux between the individual images. From 614 emission line galaxies selected in four fields in the FP-windows given in Table 1 this criterion yields galaxies, i.e. 13.8% of the 614 emission line galaxies.
(2) Every single remaining Ly- candidate has to be carefully checked on the FP, pre-filter and R images because of the possible contamination by nearby bright objects. Candidates which are closer than about 3′′ to a bright object are most likely spurious, since the changing atmospheric conditions change the tails of bright objects affecting the photometry of close-by galaxies. Therefore, such spurious objects are removed from the list of candidates. After this step, 5.7% of the emission line galaxies remain.
(3) Foreground galaxies, for which we detect one of the prominent emission lines , , , or in the Fabry-Perot, can be excluded as soon a secondary line is detected in one of the veto filters, leaving 4.7% of the galaxies.
(4) The distinction between a (rare) galaxy with bright emission but weak restframe UV continuum, i.e., undetectable in the CADIS B filter, and a Lyman--galaxy is ambiguous based on the CADIS veto filters, because no line bluewards of can be detected. Instead, we have to use the entire spectrum for this decision. Lyman- galaxies at high redshift should distinguish themselves by a continuum step across the Lyman- line, due to absorption from neutral hydrogen in the Ly- clouds and Ly-limit systems along the line of sight (Madau madau (1995)). Therefore, the candidates which remain after step (3) are classified in two categories: likely Ly-, if they show almost no continuum on the blue side of the Ly- emission line, e.g., no significant flux in the R filter, and likely objects otherwise. However, we need spectroscopic follow up observations of candidates belonging to both categories, since it cannot be excluded for sure, that some Ly- galaxies fall between the likely objects. After this step, 16 Lyman--candidates (classified as most likely Ly-) remain (see Table 2), i.e., 2.6% of the emission line galaxies we found in four CADIS fields. In addition we are left with 13 likely candidates.
| FPI | Field | Nr | z | |
| A | 09h | 21556 | 4.734 | 5.7 |
| 23h | 34751 | 4.772 | 5.0 | |
| 23h | 34105 | 4.793 | 4.2 | |
| 23h | 50707v | 4.801 | 4.0 | |
| 09h | 38114 | 4.741 | 3.7 | |
| B | 23h | 40663 | 5.732 | 6.4 |
| 23h | 23836 | 5.705 | 5.7 | |
| 23h | 28548 | 5.694 | 5.6 | |
| 23h | 45745 | 5.733 | 5.1 | |
| 23h | 9324 | 5.730 | 4.8 | |
| 16h | 3171 | 5.746 | 4.3 | |
| 01h | 3238v | 5.732 | 4.1 | |
| 23h | 45065 | 5.735 | 4.1 | |
| 16h | 2314q | 5.694 | 3.4 | |
| 01h | 27927n | 5.677 | 3.1 | |
| 01h | 28090n | 5.681 | 2.9 |
3 Spectroscopic observations
Due to the low abundance of Ly- galaxies (see section 4), spectroscopic follow-up at large telescopes constitutes an important part of the survey: First, we have to search close to the detection limit, which makes contamination by noise nonnegilible, and second, even very rare and unlikely contaminants, like distant supernovae or other transient objects, reach surface densities comparable to that of the Ly- candidates, and can be mistaken as emission line galaxies in our observations of the FPI scans which are spread over years in some fields.
The first goal of the spectroscopic follow-up of likely Ly- galaxies with 8-m class telescopes is therefore to verify the emission line. Furthermore, the line shape and the continuum blue- and red-wards of the emission line could allow us to decide between Ly- and : If the line has been verified, but the resolution is not good enough to identify the emission line, a second step is the clear confirmation of the line using higher resolution grisms, in order to see if the line shows the asymetric profile expected for Ly-, or the double [O II]3726,3729 line with separation , where Å . If galaxies with bright Ly- line at are confirmed, we plan a detailed study of the corresponding galaxy as third step.
Thus, confirming Ly- candidates by spectroscopy is a slow process. Nevertheless, the verification or non-verification of a line for every single Ly- candidate is very important in order to set more robust upper limits to the number counts of galaxies at high redshift, which can set stringent constraints on theoretical models (see section 4).
Spectroscopic follow-up observations of Ly- candidates in the 01h- and 23h-fields were obtained in the summer and autumn of 2001, using FORS 2 at the VLT. The slitmasks contained 1.0′′ wide slits of length between 10′′ and 20′′. The position angle of each mask was chosen such that the number of Ly- candidates in the 6.8′ 6.8′ FORS field of view is maximized. Regions of the slitmasks not devoted to primary targets were used to obtain spectra of low metallicity emission line galaxies. The results of the observations of these low metallicity emission line galaxies will be presented and discussed in another paper (Maier et al. maier03 (2003), in preparation).
Depending on the distribution of candidates, we used two different grisms, the lower resolution 300 I grism, which gives a spectral resolution of about 1.2 nm, at 800 nm, for slitlets 1′′ wide, and the 600 RI grism, which gives a higher spectral resolution of about 0.8 nm, at 800 nm, for slitlets 1′′ wide. Three Ly- candidates, 01h-3238, 01h-28090, and 01h-27927, were observed for 215 min using the 300 I grism with FORS2, and one Ly- candidate, 23h-50707, was observed for a total of 150 min using the 600 RI grism with FORS2. Fluxes were calibrated using multiple observations of the spectrophotometric standard stars LTT 7379, EG 274 and LTT 7987 (Hamuy et al. hamuy92 (1992),hamuy94 (1994)). Seeing varied between 0′′.5 and 1′′.2.
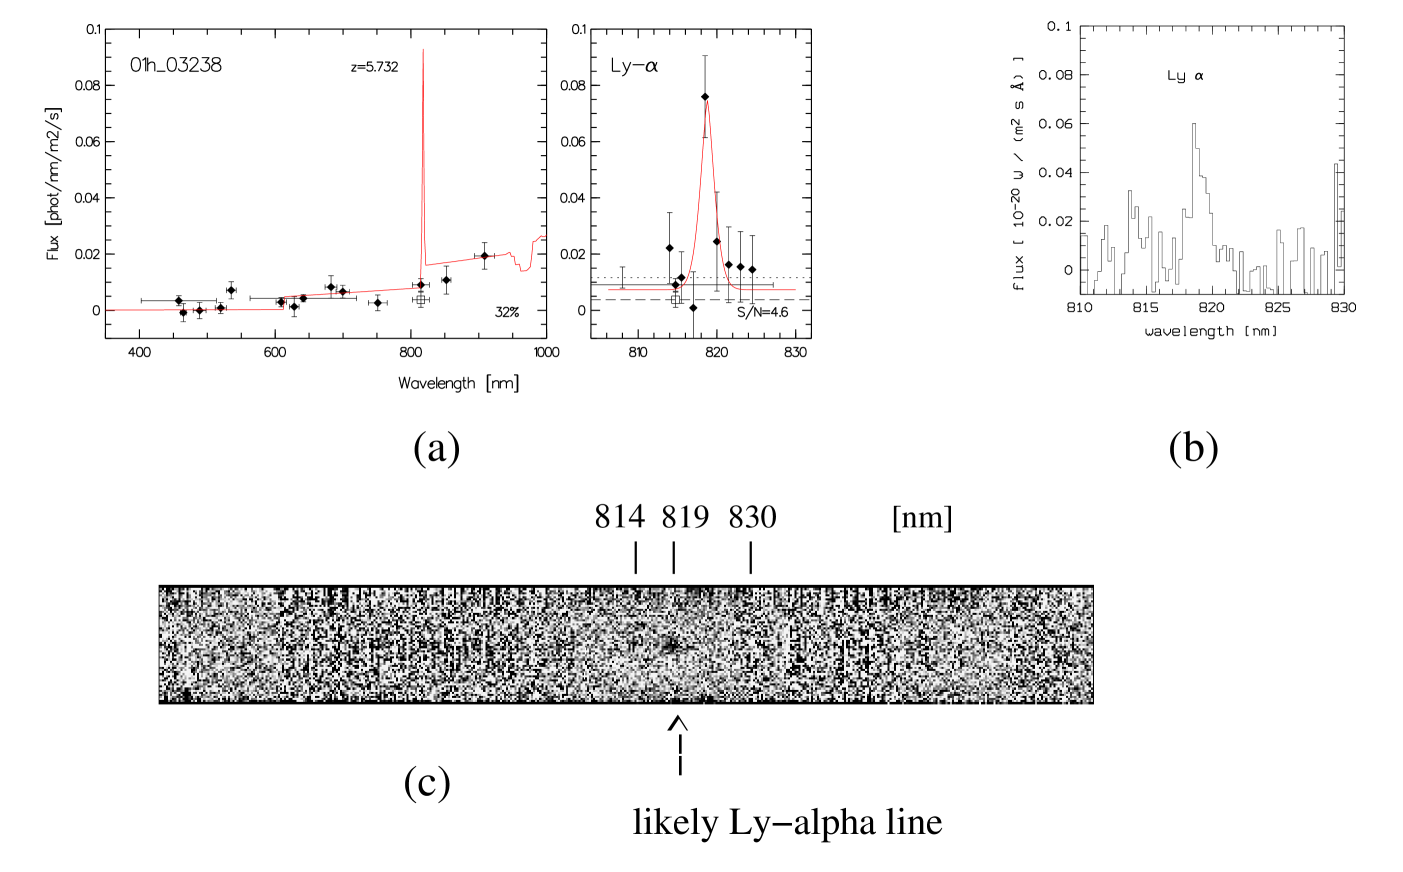
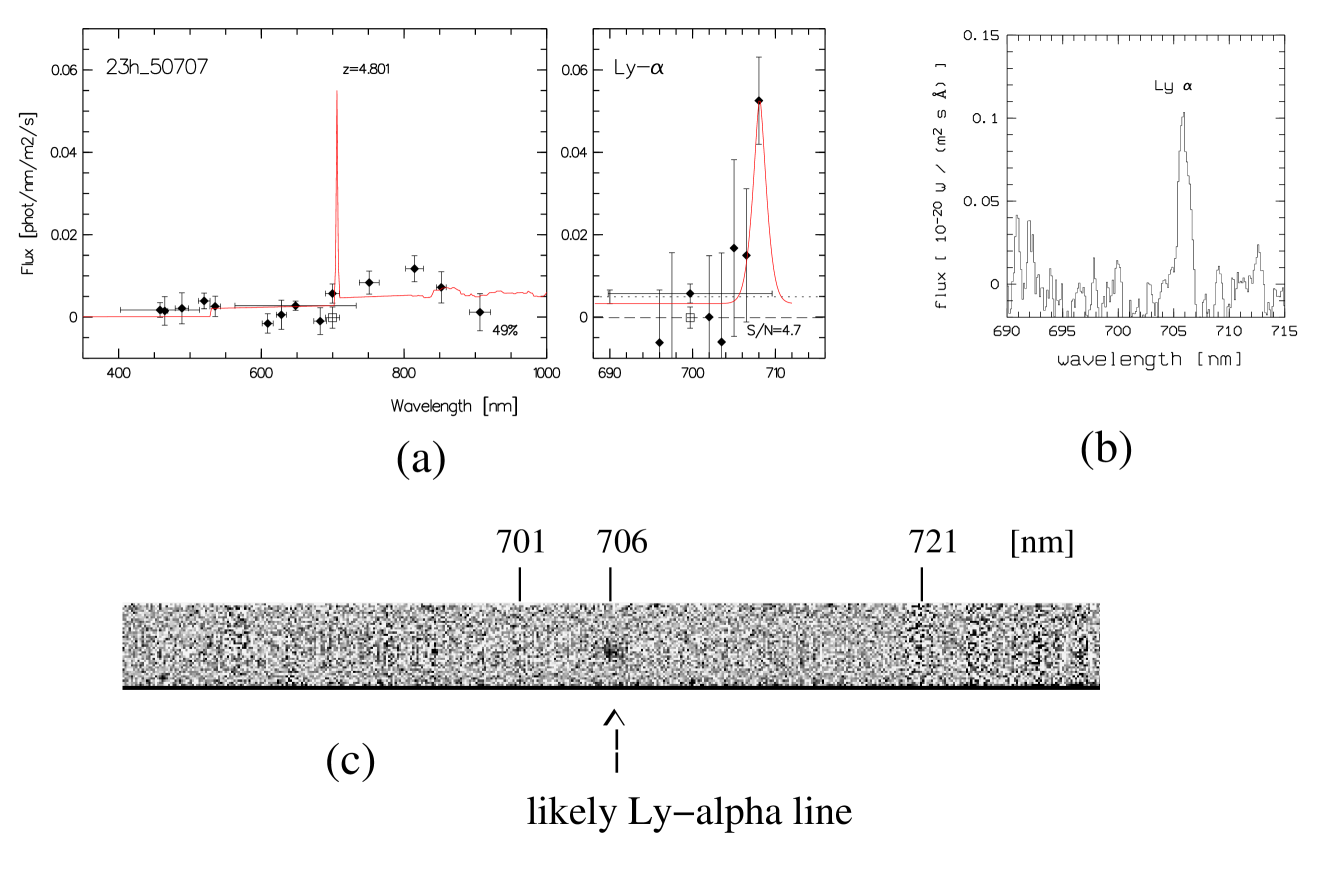
For two of the four observed Lyman- candidates we verified the emission line, for 01h-3238 at nm, and for 23h-50707 at nm (see Figure 2 and Figure 3). No continuum and no additional emission lines are seen on the VLT spectra, and, according to the CADIS measurements, these two objects satisfy the criteria (1)-(4) for Ly- candidates. Therefore, we conclude that the two emission lines are very likely Ly- lines of high redshift galaxies, 01h-3238 at and 23h-50707 at , respectively.
The line of the other two observed Ly- candidates, 01h-28090 and 01h-27927, is not seen on the VLT spectra. These are the Ly- candidates with the faintest fluxes of our Ly- candidates list. One explanation for the non-detection could be that the slit possibly missed (part of) the line emitting region of these two galaxies. This is indicated by some emission line objects on the same masks as the Ly- candidates which show a spectroscopic determined flux smaller than the CADIS flux. Thus, the slit width of 1′′.0 used for the VLT observations was possibly too narrow, and we may have thus measured only a fraction of the emission line flux of the Ly- candidates. The reason for this is that our astrometry delivers rather accurate coordinates (better than 0′′.2) for objects with multiple detections (FP and continuum), but can be off by more than 0′′.5 for objects detected only in the Fabry-Perot (Ly- candidates). On the other hand, the two Ly- candidates could be indeed spurious, since we expect a residual contamination of about 50% in our list of Ly- candidates. The reason for the non-verification of the lines has to be established by extending the statistics of spectroscopic follow-up observations.
It should be noted that we could verify an emission line (at nm) also for the galaxy 01h-4616. This object, which shows no flux in the B filter and in the veto filters, passed the criteria (1)-(3), but was classified as a probable galaxy at according to criterion (4). No other lines are seen on the VLT spectrum, and a continuum on both sides of the line is detected. Therefore, the emission line is indeed likely to be at .
We calculate the absolute Ly- luminosity of 01h-3238 and 23h-50707 from the observed fluxes measured in the FP scan (since the spectroscopic observations are subject to slit losses, see above). The Ly flux is (Ly) = W m-2 for 01h-3238, and (Ly) = W m-2 for 23h-50707. Using a , , and H km s-1 Mpc-1 cosmology, we obtain an absolute Ly luminosity of (Ly) W for 01h-3238, and (Ly) W for 23h-50707. Note that these Ly luminosities are the highest found among any galaxies (luminosities are estimated by using the same cosmology): e.g., W for the lensed galaxy HCM 6A at (Hu et al. 2002); W for SSA22-HCM1 at (Hu et al. 1999); W for HDF 4-473.0 at (Weymann et al. 1998). Taking the Ly- to ratio for Case B recombination and no dust (Brocklehurst brockl (1971)), together with the Kennicutt (kenn (1983)) conversion between luminosity and star formation rate, the derived star formation rates for the two Ly- galaxies are: for 01h-3238, and for 23h-50707. Kudritzki et al. (kudr (2000)) found that the derived star formation rates depend very strongly on the assumption whether we witness a burst or continuous star formation, the SFR being higher in the case of a starburst. Therefore, the derived SFRs using Kennicutt (kenn (1983)) empirical formula for the case of continuous star formation represent only lower limits for the SFRs. The true values of the SFRs in case of a starburst may be a factor of five higher.
4 Comparison between observed and theoretical abundances of Ly- emitting primeval galaxies
The CADIS selection suppresses the contamination in the list of Ly- candidates to less than 50% (see section 2). As a consequence, the list of CADIS Ly- candidates allows us to set stringent upper limits for the density of Ly--emitting galaxies at . We can therefore discuss the evolution of the population of Ly- emitting galaxies from to by comparing the maximum abundance derived from the list of CADIS Ly- candidates with the results of other systematic surveys at .
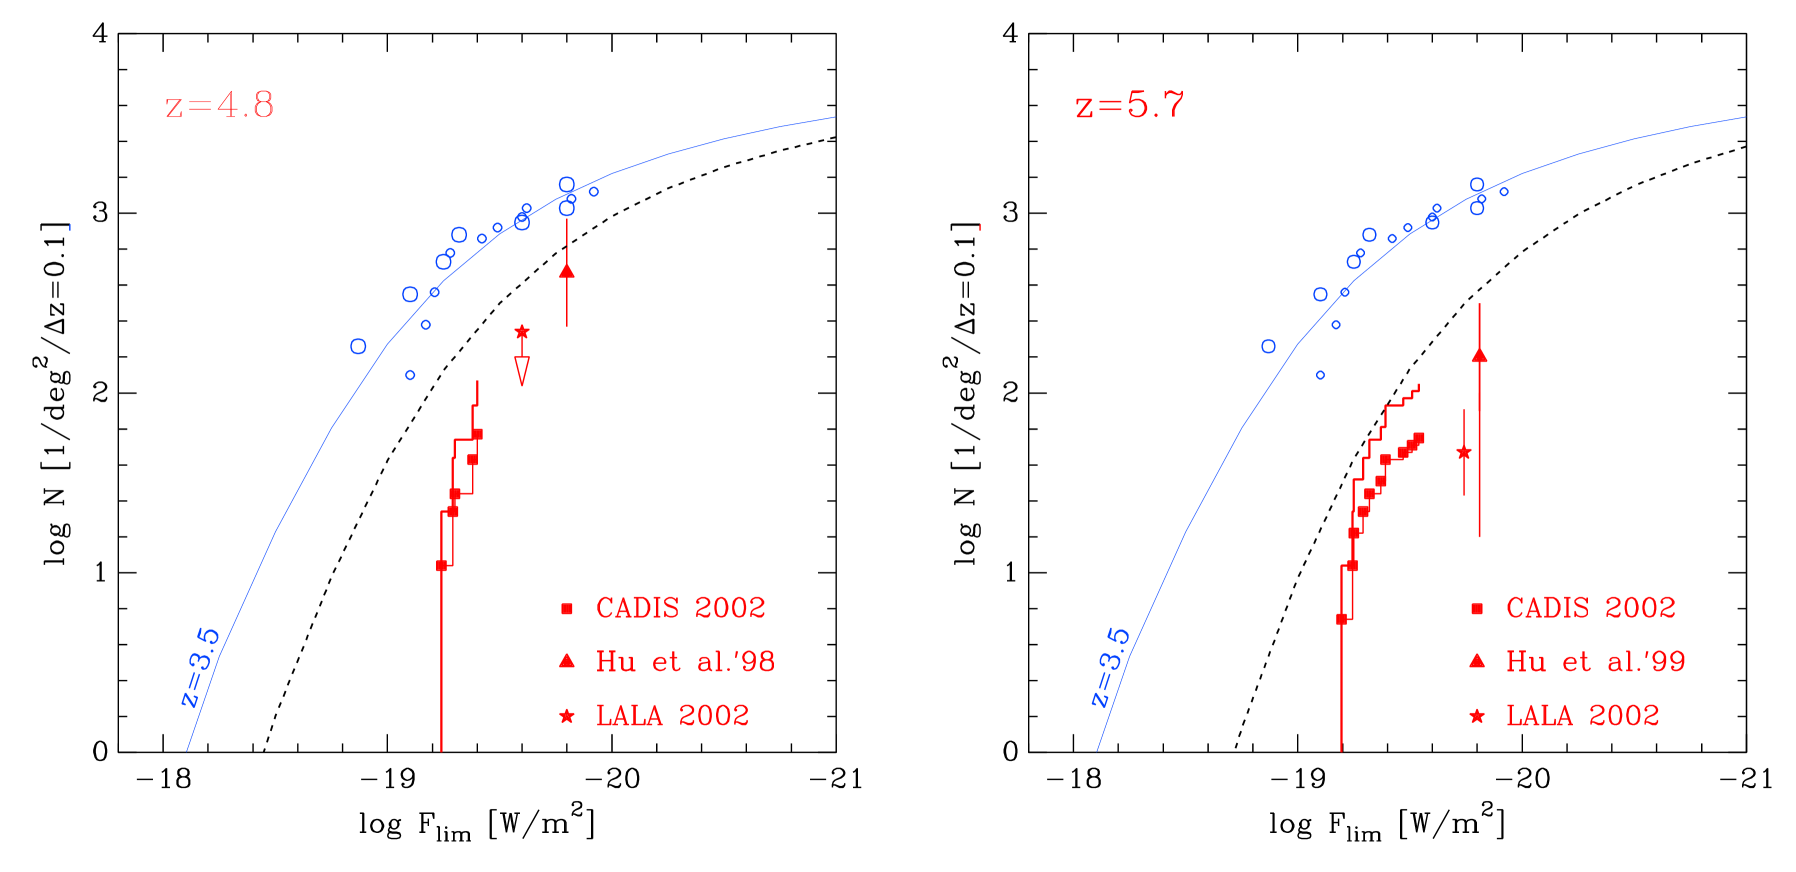
Figure 4 shows the cumulative number counts of Lyman--galaxies at (left panel) and at (right panel), presented as the total number of galaxies, per deg2 per , which are brighter than a certain observed flux, . In the cumulative histogram of CADIS Ly- galaxy candidates, the upper edge represents the total number of CADIS candidates per deg 2 and per , brighter than the respective , based on the list of Ly- candidates from Table 2: e.g., at , in four fields with a total arcmin, we find one candidate brighter than , two candidates brighter than , etc. The filled squares additionally take into account the likely residual contamination by noise plus unidentified -emitting galaxies, and therefore represent our best-guess upper limit to the abundance of Ly- galaxies.
Additional abundance measurements, showed as filled triangles, are from Hu et al. (hu98 (1998)) at , and from Hu et al. (hu99 (1999)) at . Hu et al. detected two Ly- galaxies at in a 24 arcmin2 field, and one Ly- galaxy at using narrowband observations in a 30 arcmin2 field. Stars indicate preliminary results from the Large Area Lyman Alpha Survey (LALA) at (Malhotra & Rhoads malh (2002)) and at (Rhoads et al. rhoads02 (2002)). Malhotra & Rhoads (malh (2002)) found 157 Ly- candidates at in one field of 0.36 deg2. The arrow in Fig. 4 (left panel) indicates the upper limit of the number density of Ly--emitters based on the list of these candidates. Rhoads et al. (rhoads02 (2002)) reported 18 Ly- candidates at in one field of deg2, of which three (out of four observed) candidates have been verified spectroscopically. Rhoads et al. infer a number density of Ly--emitters per deg2 per down to their detection limit (see Fig. 4, right panel). For comparison, we show in Fig. 4 the measured abundance of Lyman--emitting galaxies at through emission-line-surveys from Hu et al. (hu98 (1998), small circles), and Kudritzki et al. (kudr (2000), large circles; converted from ).
In order to parametrize the observed number counts at , we use the model by Thommes & Meisenheimer (thommes03 (2003)): It basically assumes (i) that Ly--galaxies mark the onset of star-formation in present-day spheroids, (ii) a rather short-lived Ly--bright phase due to rapid dust formation ( yrs), and (iii) a mass dependent formation history as given by the peak formalism. In order to fit the abundance at we used model parameters which set the peak of Ly--emission for the bulge of the Milky Way around . The normalization at is set by the abundance of present day spheroids together with a free parameter the duration of the Ly--bright phase. For the present work, we decided not to fine tune the model in a way that a consistent description of the abundances at all redshifts is obtained. This will be presented in a forthcoming paper. Here we rather would like to demonstrate a robust qualitative statement namely that Ly--galaxies are less common at than at . To this end we simply shift the model function for to higher redshift by taking into account both the higher luminosity distance (shift to the right), and the smaller comoving volume (shift to bottom). This “no-evolution model” is shown by the dotted line in Fig. 4.
It is obvious from Fig. 4 that the CADIS upper limits both at and fall short of such a non-evolution model, while at the faint end, F, the present results could still be compatible with no evolution.
Since our statistics at is extremely limited, we will focus any further discussion on redshifts around .
While the number counts of Hu et al. at (a single galaxy found by Hu et al. hu99 (1999)) still seem compatible with the no-evolution model, the abundance of Ly--galaxies from LALA and the limits given by the CADIS candidates fall significantly short of the no-evolution prediction. The under-abundance of Ly- emitting galaxies at compared to becomes even more obvious if one considers that the noise distribution of our survey predicts residual contamination of about 50%. Nevertheless, before drawing definite conclusions, one should consider whether selection effects could lead to an under-estimation of the number of Ly--emitting galaxies. Potential influences on the upper limits include: objects classified as probable galaxies for which the emission line is actually Ly-, the fainter surface brightnesses of high redshift objects, and the large-scale structure. The weakly confined bright end of the luminosity function at may limit the comparison at the bright end. Therefore, we have to discuss how robust the CADIS upper limits are.
The distinction between a galaxy with emission, but no flux in the CADIS B filter, and a Lyman--galaxy is ambiguous (see step (4) in Section 2). Therefore, some of the probable objects may turn out to be Ly- galaxies, and some presumed Ly- galaxies may turn out to be -emitting galaxies. However, any asymmetry in this mutual contamination has already been accounted for by assuming a conservative estimate of 50% contamination of the Ly- candidates sample.
Surface brightness depends on the apparent size of an object at redshift , which does not change much between and , and on the luminosity distance. Since the model luminosity function is converted to taking the luminosity distance into consideration, most of the effect of the dimming towards higher redshift has already been accounted for.
Large-scale structure can influence galaxy counts even at high redshifts (Steidel et al. steidel98 (1998)). Since we derive the number counts of Ly- galaxies at by combining four CADIS fields (with a total area about 14 times the size of the field searched by Hu et al. hu98 (1998)), large scale structure should average out. Nevertheless, it should be kept in mind that results from small fields, like those searched by Hu et al. (hu98 (1998), hu99 (1999)), could be affected by large scale structure.
Two points should be noted about the bright end of the luminosity function at . First, the observed Ly- line fluxes for the most luminous galaxies at found by Hu et al. (1998) and Kudritzki et al. (2000) are on the order of . Taking into account the higher luminosity distance at (compared to ) these galaxies would have apparent line fluxes of at (using a , and Hkm s-1 Mpc-1 cosmology); i.e., galaxies with intrinsically bright Ly- emission, corresponding to observed line fluxes at as searched by CADIS have not yet been found in the small fields searched at . Thus, the shape of the bright end of the luminosity function relies mainly on our model. Second, the number counts at the bright end of the luminosity function at , resulting from the brightest galaxy detected by Kudritzki et al. (2000, large circles), are higher than the results of Hu et al. (1998, small circles). Since large-scale structure can influence galaxy counts even at high redshifts (Steidel et al. 1998), the Kudritzki et al. number counts could be biased, because Kudritzki et al. searched only one field, whereas Hu et al. survey goes over two fields. Disregarding the brightest galaxy from Kudritzki et al. would result in a steeper luminosity function at the bright end at and thus lessen the discrepancy at .
In summary, we conclude that the luminosity function of Ly--bright galaxies declines between and . This implies that the peak of the Ly--bright phase i.e., the first formation of massive stars is reached after . Although, in principle, both luminosity evolution or density evolution could account for this finding, we only can establish the decrease in density around , as the bright end of the Ly- luminosity function is still not determined well enough at .
The onset of massive star formation should contribute a substantial fraction of the UV photons which reionize the universe. Moreover, both bright starbursts (SFR /yr) and the formation of supermassive black holes indicate a strong concentration of baryons within the centers of the most prominent density peaks. Therefore, our result seems to confirm additionaly the finding from the analysis of the HI absorption in the spectra of SDSS quasars at (Fan et al. fan02 (2002)), that the reionization of the universe did not happen long before .
References
- (1) Ajiki, M., Taniguchi Y., Murayama T. et al. 2002, ApJ, 576, 25
- (2) Brocklehurst M. 1971 MNRAS, 153, 471
- (3) Charlot, S. & Fall, S., 1993, ApJ, 415, 580
- (4) Cowie L. L. & Hu E. M. 1998, AJ, 115, 1319
- (5) Dawson, S., Spinrad, H., Stern, D. et al. 2002, ApJ, 570, 92
- (6) Dey, A., Spinrad, H., Stern, D., Graham, J. R. & Chaffee, F. H., 1998, ApJ, 498, 93
- (7) Ellis, R., Santos, M. R., Kneib, J. -P., & Kuijken, K. 2001, ApJ, 560, 119
- (8) Fan, X., Narayan, V. K., Lupton, R. H. et al. 2001, AJ, 122, 2833
- (9) Fan, X., Narayanan V. K., Strauss, M. A. et al. 2002, AJ, 123, 1247
- (10) Haiman Z. & Spaans M. 1999, ApJ, 518, 138
- (11) Hamuy, M., Walker, A. R., Suntzeff, N. B. et al. 1992, PASP 104, 533
- (12) Hamuy, M, Suntzeff, N. B., Heathcote, S. R. et al. 1994, PASP 106, 566
- (13) Hippelein, H., Maier, C., Meisenheimer, K. et al., Star forming rates between and from the CADIS emission line survey, 2003, A& A, accepted
- (14) Hu, E. M., Cowie, L. L. & McMahon, R. G., 1998, ApJ, 502, 99
- (15) Hu, E. M., McMahon, R. G., & Cowie, L. L. 1999, ApJ, 522, 9
- (16) Hu, E. M., Cowie, L. L., McMahon, R. G. et al. 2002, ApJ, 568, 75
- (17) Kennicutt, R. C., Jr. 1983, ApJ, 272, 54
- (18) Kudritzki, R.-P., Mendez, R. H., Feldmeier, J. J. et al. 2000, ApJ, 536, 19
- (19) Leitherer, C., Robert, C., & Heckman, T. M., 1995a, ApJS, 99, 173
- (20) Leitherer, C., Ferguson, H. C., Heckman, T. M. & Lowenthal, J. D. 1995b, ApJ, 454, 19
- (21) Madau, P. 1995, ApJ, 441, 18
- (22) Maier, C. et al., Metal abundances of faint emission line galaxies from CADIS at medium redshift, in preparation
- (23) Malhotra S. & Rhoads J. E. 2002, ApJ, 565, 71
- (24) Meisenheimer, K., Beckwith, S., Fockenbrock, H. et al. 1998, in The Young Universe: Galaxy Formation and Evolution at Intermediate and High Redshift. Edited by S. D’Odorico, A. Fontana, and E. Giallongo. ASP Conference Series, Vol. 146, p.134
- (25) Meisenheimer, K. et al. The Calar Alto Deep Imaging Survey: Concept, Data Analysis and Calibration, in preparation
- (26) Pentericci, L., Fan, X., Rix, H.-W. et al. 2002, AJ, 123, 2151
- (27) Rhoads, J. E., Malhotra, S., Dey, A. et al. 2000, ApJ, 545, 85
- (28) Rhoads, J. E., Dey, A., Malhotra, S. et al. 2002, astro-ph/0209544
- (29) Steidel, C. C., & Hamilton, D. 1992, AJ, 104, 941
- (30) Steidel, C. C., & Hamilton, D. 1993, AJ, 105, 2017
- (31) Steidel, C. C., Giavalisco, M., Pettini, M., Dickinson, M. & Adelberger, K. L. 1996 ApJ 462, 17
- (32) Steidel, C. C., Adelberger, K. L., Dickinson, M. et al. 1998, ApJ, 492, 428
- (33) Steidel, C. C., Adelberger, K. L., Giavalisco, M., Dickinson, M. & Pettini, M. ApJ, 1999, 519, 1
- (34) Thommes, E & Meisenheimer, K. 1995, Number density predictions for primeval galaxies. In Hippelein et al. (eds.): “Galaxies in the Young Universe”, Springer Lect. Notes 463, 242
- (35) Thommes, E. & Meisenheimer, K. 2003, in preparation
- (36) van Breugel, W. J. M., de Breuck, C., Stanford, S. A. et al. 1999, ApJ, 518, 61
- (37) Weymann, R. J., Stern, D., Bunker, A. et al. 1998, ApJ, 505, 95