Tomography of the atmosphere of long-period variable stars
Abstract
This paper reviews the results obtained so far with the newly developed tomographic technique, which probes the velocity field across the atmosphere of long-period variable (LPV) stars. The method cross-correlates the optical spectrum with numerical masks constructed from synthetic spectra and probing layers of increasing depths. This technique reveals that the line doubling often observed in LPV stars around maximum light is the signature of the shock wave propagating in the atmosphere of these pulsating stars.
1 Introduction
It is known since long that the brightness variations of long-period variable stars (LPVs) go along with spectral changes such as the doubling of the absorption lines around maximum light adams41 ; alvarez00 ; maehara68 . This line-doubling phenomenon appears to be shared by all LPVs alvarez01b , and occurs when the shock wave associated with the envelope pulsation propagates through the line-forming region alvarez00 ; schwarzschild52 . Since it is almost impossible to study individual line profiles in the very crowded optical spectra of LPVs, it is necessary to resort to a technique that correlates the observed spectrum with a spectral template alvarez01a ; baranne79 ; queloz95 . The shape of the resulting cross-correlation function (CCF) thus represents the average shape of those lines in the observed spectrum that match the template. By carefully designing spectral templates collecting all spectral lines forming at given depths in the atmosphere, it is even possible to probe the velocity field in pulsating variables. This is the general principle guiding the tomographic111The word tomography is used here in its etymological sense (‘display cuts’), which differs somewhat from the broader sense in use within the astronomical community (reconstruction of a structure using projections taken under different angles). method described in this review. When applied to a temporal sequence of spectra, the method is even able to reveal in a spectacular way the outward propagation of the shock wave, as shown in Sect. 4 and Figs. 5–6!
2 Tomography of the atmosphere
The study of the velocity field in the atmosphere of LPVs poses a special challenge, as the spectrum of these stars is extremely crowded, particularly in the optical domain. The cross-correlation technique provides a powerful tool to overcome this difficulty. The information relating to the line doubling (velocity shift and line shape) is in fact distributed among a large number of spectral lines, and can be summed up into an average profile, or more precisely into a cross-correlation function (CCF). If the correlation of the stellar spectrum with a mask involves many lines, it is possible to extract the relevant information from very crowded and/or low signal-to-noise spectra. The CCF writes
| (1) |
where is the observed spectrum, is the template (a binary template has been adopted, being 0 around spectral lines of interest, and 1 elsewhere), and and are the boundaries of the spectral range covered by the observed spectrum. The radial velocity is then obtained from the wavelength shift (min CCF) where the CCF is minimum:
| (2) |
where is the speed of light in vacuum. We refer the reader to reference baranne79 for a detailed description of the CCF mathematical properties.
The tomographic method rests on our ability to construct reliable synthetic spectra of late-type giant stars plez92a ; plez92b ; plez99 , and from those, to identify the depth of formation of any given spectral line. Rigorously, the contribution function (CF) to the flux depression albrow96 should be used to evaluate the geometrical depth at which a line forms. However, it would be a formidable task to compute the CF for each line appearing in the optical spectrum of LPV stars. For the sake of simplicity, the ‘depth function’ is used instead, which provides the geometrical depth corresponding to monochromatic optical depth at the considered wavelength . This function expresses the depth from which the emergent flux arises, in the Eddington-Barbier approximation, and should not differ much from the average depth of formation for sufficiently strong lines magain86 .
Different masks are then constructed from the collection of lines such that , where is some constant optimized to keep enough lines in any given mask without losing too much resolution in terms of geometrical depth. A natural limit to the resolution that can be achieved on the geometrical depth is provided by the width of the CF alvarez01a , and according to the Nyquist-Shannon theorem of elementary signal theory, there is no advantage in taking smaller than half the CF width of typical lines probed by the mask. Each mask should then probe lines forming at (geometrical) depths in the range in the atmosphere. These masks are used as templates to correlate with the observed spectra of the LPV stars. This procedure should provide the velocity field as a function of depth in the atmosphere (Fig. 1), whereas for static atmospheres, all CCFs should yield the same radial velocity (Fig. 3).
A more detailed description of the method can be found in alvarez01a , while specific tomographic masks are available at http://www-astro.ulb.ac.be/Html/home.html#tomography. The set of tomographic masks used in this paper was constructed from a synthetic spectrum at = 3500 K and (see reference alvarez01a for details). The properties of the masks (in terms of numbers of lines and depths probed) are listed in Table 1. The depth is in fact expressed in terms of a reference optical depth , where is the optical depth at the reference wavelength of 1.2 m. There is a one-to-one correspondence between and the geometrical depth.
| Mask # | depth probed | # of lines per mask |
|---|---|---|
| (innermost) | 777 | |
| 610 | ||
| 433 | ||
| 321 | ||
| 168 | ||
| 167 | ||
| 94 | ||
| (outermost) | 46 |


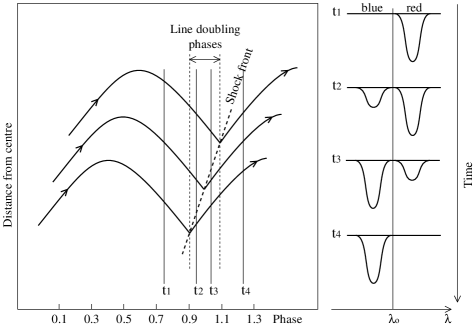
An a posteriori validation of the method is provided by the fact that (i) the CCFs obtained with the tomographic masks for the non-pulsating M giant Gem (Lb variable with a variability range of only 0.11 mag in the Hipparcos catalogue) are all single-lined and yield almost identical radial velocities, as expected (Fig. 3), and (ii) the asymmetric CCFs obtained for the warm Mira variable Z Oph reflect the shape of the individual lines probed by any given mask (Fig. 2). The asymmetric, and sometime even double-peaked, CCFs observed for Mira variables thus correctly represent the underlying spectral lines, and are not artifacts of the correlation process. Moreover, around maximum light, the shape of CCFs in the successive tomographic masks follows a definite sequence: the CCF in the deepest layer exhibits a single blue component whereas a single red component is observed in the outermost CCF, and double-peaked CCFs are observed in between (Fig. 1). This sequence, which is observed in almost all Mira around maximum light, is consistent with the Schwarzschild scenario describing the effects of the passage of a shock wave through the atmosphere of a pulsating star (Sect. 3).
3 The Schwarzschild scenario
The passage of a shock wave through a stellar atmosphere is expected to give rise to a very specific temporal evolution of the spectral line shape (Fig. 4), as first noted by Schwarzschild schwarzschild52 in relation with W Vir Cepheids. When the shock wave penetrates the line-forming region, the velocity discontinuity associated with the shock gives rise to the doubling of the spectral line: the red component of the line is formed in the matter falling in above the shock, whereas the blue component arises from the ascending matter lying behind the shock. The intensity of the blue and red components of a double line observed around maximum light in a LPV star should follow the temporal sequence illustrated in Fig. 4. This is indeed the case, as revealed by the evolution of the CCFs of the Mira variables RT Cyg and RY Cep around maximum light (Sect. 4). But the tomographic method described in Sect. 2 allows us to go one step further, by showing that the Schwarzschild scenario also reveals itself in terms of a definite spatial sequence of profiles (Fig. 1). By combining those spatial sequences obtained at successive phases in the light cycle, the tomographic method reveals that line-doubling appears later in upper layers of the Mira atmosphere, thus translating the upward motion of the shock wave (Sect. 4).
4 Application to the Mira variables RT Cyg and RY Cep
A long-term monitoring of the Mira stars RT Cyg ( d; ) and RY Cep ( d; ) has been performed with the fibre-fed echelle spectrograph ELODIE baranne96 . The spectrograph ELODIE is mounted on the 1.93-m telescope of the Observatoire de Haute Provence (France), and covers the full range from 3906 Å to 6811 Å in one exposure at a resolving power of 42 000.
For RT Cyg, a monitoring in August-September 1999 covered phases to 0.16 around maximum light, with 32 spectra obtained during this phase range (corresponding to an average resolution of ; Fig. 5). For RY Cep, the monitoring covered a full light cycle extending from August 2001 (phase -0.17) to February 2002 (phase 0.92), and 40 spectra were obtained (Fig. 6).
The sequences of CCFs presented in Figs. 5 and 6 clearly obey the Schwarzschild temporal evolution, with a single red component transforming progressively into a single blue component around maximum light. There are moreover clear phase lags between the different layers, this transformation occurring at later phases in outer layers. Thus, the Schwarzschild scenario holds for Mira variables, and this conclusion definitely points towards the velocity stratification associated with the shock wave as the cause of the double absorption lines observed in Mira variables, as opposed to complex radiative processes (e.g., radiative release of thermal energy into the post-shock layer or temperature inversion) gillet85 ; karp75 .
C3 C4 C5 C7 phase

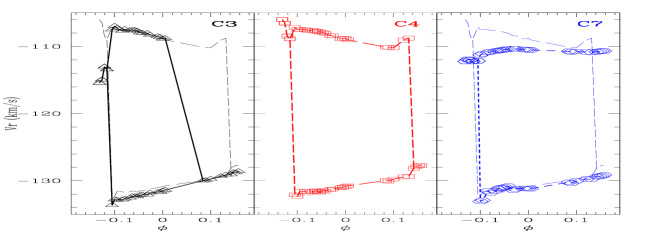
Bottom panels: Radial velocity curves obtained with the tomographic masks C3 (leftmost panel - solid line - triangles), C4 (middle panel - long-dashed line - squares), and C7 (rightmost panel - short-dashed line - circles). The C4 radial-velocity curve (long-dashed line) has been duplicated in the left- and rightmost panels to allow an easy intercomparison
C3 C4 C5 C6 phase

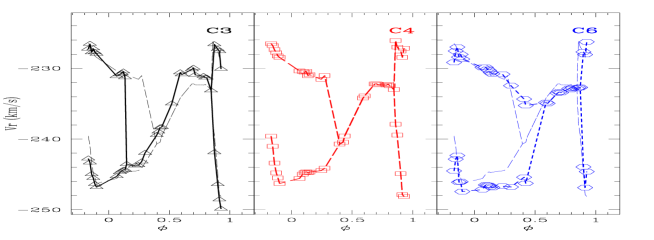
Bottom panels: Radial velocity curves obtained with the tomographic masks C3 (leftmost panel - solid line - triangles), C4 (middle panel - long-dashed line - squares), and C6 (rightmost panel - short-dashed line - circles). The C4 radial-velocity curve (long-dashed line) has been duplicated in the left- and rightmost panels to allow an easy intercomparison
Radial velocities have been extracted from the CCFs of Figs. 5 and 6 (top panels) to yield the curves displayed in the bottom panels of the same figures. We defer the detailed comparison between the radial-velocity curves of RY Cep and RT Cyg, and their interpretation, to a forthcoming paper. We just stress here noteworthy features on the radial-velocity curve of RY Cep: (i) the red peaks (corresponding to matter falling in) are observed at the same velocity in all three masks; they disappear at increasingly later phases as one considers layers closer and closer to the surface, since the outermost layers are the last ones to be penetrated by the shock wave which suppresses the infalling component (i.e., red peak); (ii) the maximum outward velocity is the same for the three masks ( km/s), and is reached around phase . After that, matter will decelerate in the innermost layers first, as they lose the impetus provided by the shock wave which is moving away.
5 Conclusion and perspectives
The tomographic technique presented in this paper
opens new perspectives for the study of the
dynamics of LPV stars, as it allows
to visualize the outward motion of the shock
wave in the atmosphere. At this stage, however, the results remain
qualitative as it is difficult to quantify the geometrical depth of
the layers probed by the different masks. It is hoped that, in the future,
this method may be combined with interferometric imaging in the
different masks to derive the corresponding radii. This would
give direct access to the velocity of the shock, for instance.
Acknowledgements. We thank the Observing Program Committee of the Observatoire de Haute-Provence for a generous allocation of telescope time. The AFOEV is warmly thanked for positively answering our request to monitor RY Cep during the time of the spectroscopic monitoring. A.J. is Research Associate from the Fonds National de la Recherche Scientifique (Belgium). Financial support has been received from the Communauté Française de Belgique in the framework of a TOURNESOL programme.
References
- (1) W.S. Adams, 1941, ApJ, 93, 11
- (2) M. D. Albrow, P. L. Cottrell, 1996, MNRAS, 278, 337
- (3) R. Alvarez, A. Jorissen, B. Plez, D. Gillet, A. Fokin, 2000 A&A, 362, 655
- (4) R. Alvarez, A. Jorissen, B. Plez, D. Gillet, A. Fokin, M. Dedecker, 2001a A&A, 379, 288
- (5) R. Alvarez, A. Jorissen, B. Plez, D. Gillet, A. Fokin, M. Dedecker, 2001b A&A, 379, 305
- (6) A. Baranne, M. Mayor, J.L. Poncet, 1979, Vistas in Astronomy, 23, 279
- (7) A. Baranne, D. Queloz, M. Mayor et al., 1996, A&AS, 119, 373
- (8) D. Gillet, E. Maurice, P. Bouchet, R. Ferlet, 1985, A&A, 148, 155
- (9) A. H. Karp, 1975, ApJ, 201, 641
- (10) H. Maehara, 1968, PASJ, 20, 77
- (11) P. Magain, 1986, A&A, 163, 135
- (12) J. A. Mattei, 1999, private communication
- (13) B. Plez, 1992, A&AS, 94, 527
- (14) B. Plez, J.M. Brett, Å. Nordlund, 1992, A&A, 256, 551
- (15) B. Plez, 1999, in IAU Symp. 191, Asymptotic Giant Branch Stars, ed. T. Le Bertre, A. Lèbre, C. Waelkens, (Astron. Soc. Pacific), 75
- (16) D. Queloz, 1995 in IAU Symp. 167, New Developments in Array Technology and Applications, ed. A.G. Davis Philips, K. A. Janes & A. R. Upgren (Dordrecht: Kluwer), 221
- (17) M. Schwarzschild, 1952, in Transactions of the IAU, Vol. VIII, ed. P.T. Oosterhoff (Cambridge University Press), 811