EGRET upper limits on the high-energy gamma-ray emission of galaxy clusters
Abstract
We report EGRET upper limits on the high-energy gamma-ray emission from clusters of galaxies. EGRET observations between 1991 and 2000 were analyzed at positions of 58 individual clusters from a flux-limited sample of nearby X-ray bright galaxy clusters. Subsequently, a coadded image from individual galaxy clusters has been analyzed using an adequately adapted diffuse gamma-ray foreground model. The resulting upper 2 limit for the average cluster is 6 cm-2 s-1 for E 100 MeV. Implications of the non–detection of prominent individual clusters and of the general inability to detect the X-ray brightest galaxy clusters as a class of gamma-ray emitters are discussed. We compare our results with model predictions on the high-energy gamma-ray emission from galaxy clusters as well as with recent claims of an association between unidentified or unresolved gamma-ray sources and Abell clusters of galaxies and find these contradictory.
1 Introduction
Clusters of galaxies are excellent representatives for the formation and the evolution of structure in the universe. They have been extensively studied at radio, optical and X-ray wavelengths. Within the last decade, radio, extreme UV and hard X-ray observations have revealed emission features that led to the prediction that galaxy clusters might be emitters of high-energy gamma-rays:
- •
-
•
the rather controversially discussed observations of EUV excess emission in galaxy clusters like A1795, A2199, and the Coma Cluster (Bowyer at al., 1999), Abell 2199 (Lieu at al., 1999), A1367 and A1656 (Coma), A1795 and A2199 (Arabadjis & Bregman, 1999), Virgo (Berghöfer at al., 2000), Virgo and A1795 (Bonamente et al., 2001), the Fornax Cluster (Bowyer at al., 2001), A2199 and A1795 (Berghöfer & Bowyer, 2002), A1795, A2199, A4059, Coma and Virgo (Dureet et al., 2002),
-
•
the observational hint of a distinct non–thermal emission component at hard X-ray wavelengths in the case of the Coma cluster (Fusco–Femiano et al., 1999; Rephaeli et al., 1999), Abell 2199 (Kaastra et al., 1999), Abell 2256 (Fusco–Femiano et al., 2000), and perhaps A754, A119 (Fusco–Femiano et al., 2002).
Various scenarios were suggested to connect and explain the links between these observations and,
consequently, to predict a high-energy emission component at gamma-ray wavelengths. Whereas the
diffuse radio emission is clearly synchrotron radiation by highly relativistic electrons, the
EUV excess emission was first attributed to a second but cooler thermal component. Now a more
plausible explanation is Inverse Compton scattering of Cosmic Microwave Background radiation
by a non–thermal electron population (Enßlin & Biermann, 1998; Blasi & Colafrancesco, 1999). The hard X-ray excess can be produced
by Inverse Compton scattering of the same electron distribution generating the non–thermal radio
emission (Giovannini et al., 1993). To avoid the problem of the rather low magnetic field strength in such a
scenario, non–thermal bremsstrahlung has been proposed as an alternative emission process (Enßlin et al., 1999).
As pointed out by Petrosian (2001), the non–thermal bremsstrahlung cannot be persistently produced on account
of the low radiation efficiency of electrons in the 100 keV range. Hadronic particle populations were
considered to produce gamma-rays via pp–interactions of high-energy cosmic rays with the
intracluster medium (ICM) (Berezinsky et al., 1997), or as the origin of a secondary population of
relativistic electrons Atoyan & Völk (2000). Cluster merger systems might offer sufficient cosmic ray
injection rates in conjunction with a mechanism for heating the ICM to the observed temperatures
(Blasi, 2001; Fujita & Sarazin, 2002).
Gamma-ray radiation from galaxy clusters is also expected as a result of large scale cosmological
structure formation scenarios (Dar & Shaviv, 1995, 1996; Colafrancesco & Blasi, 1998; Waxman & Loeb, 2000; Totani & Kitayama, 2000; Kawasaki & Totani, 2002; Miniati, 2002).
However, apart from the general prediction of its existence, quantitative estimates range between
’dominant part of the already observed extragalactic diffuse background by EGRET’ to
’magnitudes below the detection threshold of the current gamma-ray instrumentation’ -
a range of predictions substantially more uncertain than that for the contribution of unresolved AGN to the
extragalactic diffuse gamma-ray background (see i.e. Mücke & Pohl (2000), and references therein).
The benefit of dealing with a class of astronomical objects already detected at gamma-ray wavelengths as
e.g. AGN is not granted for the galaxy clusters: In contrast to the blazar population well-observed
by EGRET, no galaxy cluster has been unambiguously identified at gamma-ray wavelengths to date.
Nevertheless, for several individual clusters model predictions exist, which place their gamma-ray fluxes
close to or even below the instrumental sensitivity threshold of the EGRET telescope at E MeV
(Dar & Shaviv, 1995; Enßlin et al., 1997; Blasi & Colafrancesco, 1999). Until now, galaxy clusters in gamma-rays have only been analyzed using early
EGRET data and preliminary analysis techniques, resulting in non–detections of the Coma cluster (Sreekumar et al., 1996)
and several Abell clusters (McGlynn et al., 1994). Therefore galaxy clusters have not been considered as likely
counterparts of EGRET sources in the 3EG source catalog (Hartman et al., 1999).
Just recently, claims of an association between galaxy clusters from the Abell catalog and unidentified gamma-ray point
sources from the 3EG catalog have been made by Colafrancesco (2001) and Kawasaki & Totani (2002).
Likewise, Abell clusters were proposed to be connected with unresolved gamma-ray excesses (Scharf & Mukherjee, 2002).
All these detection claims have a statistical significance for association at the 3 level in common.
Here, in order to provide an up–to–date and comprehensive view on the high-energy gamma-ray emission from
galaxy clusters, we have expanded a preliminary analysis by Reimer et al. (1999) by considering all relevant EGRET observations
between 1991 and 2000. Using the finalized EGRET data, which incorporate the latest instrumental efficiency
normalizations, we analyzed individual, nearby X-ray bright galaxy clusters with the likelihood technique.
Subsequently, the gamma-ray data from individual galaxy clusters have been coadded
in cluster–centered coordinates (Reimer & Sreekumar, 2001). The coadded images were again analyzed using the
likelihood technique, however in conjunction with an adequately adapted diffuse gamma-ray foreground model.
We also re–examined the statistical associations between unidentified EGRET sources and Abell clusters as
a population (Colafrancesco, 2002). For that purpose we measured the cluster autocorrelation and thus derived the correct
chance probabilities for the null hypothesis of no correlation between EGRET sources and Abell clusters.
Finally, we compare our results, which benefit from the application of the likelihood analysis technique, with the
result by Scharf & Mukherjee (2002).
2 The flux-limited X-ray bright galaxy cluster sample
For observationally probing the gamma-ray emission of galaxy clusters a sample of
X-ray emitting clusters of galaxies has been chosen. This sample consists of the
X-ray flux limited cluster catalogs from EINSTEIN (Edge et al., 1990), EXOSAT (Edge & Steward, 1991),
and ROSAT surveys (XBACs: Ebeling et al. (1996), BCS north: Ebeling et al. (1998), BCS south: De Grandi et al. (1999)).
Cluster selections based on X-ray catalogs currently provide the best way to
obtain completeness without introducing biases (i.e. projection effects).
Although appearing as extended sources with typical radii of several arcminutes in X-rays,
the width of the point spread function of the EGRET instrument
(, and the energy
dependent radius for a 68% flux enclosure) does not permit a similar handling of galaxy clusters as
extended sources in gamma-rays. Thus, the attempt to analyze clusters of galaxies as point–like
excesses at energies above 100 MeV is justified. Here, a total of 58 individual X-ray bright galaxy
clusters within z were chosen to represent a reasonable candidate sample for the subsequent
analysis at high-energy gamma-ray wavelengths. Although further but similar cluster surveys are on
the way or have been completed recently (in particular HIFLUGCS and REFLEX), this sample
adequately represents the high-flux end of the log N–log S distribution of
X-ray bright galaxy clusters. Almost all clusters that are extensively discussed
in the literature for evidence of non–thermal X-ray emission, EUV-excess features
and/or characteristic diffuse radio halos are included in this sample.
The number of galaxy clusters has been restricted primarily to achieve a manageable
amount of analysis work in the gamma-rays, but also because a simple measure
like cluster mass M over distance squared D2, as explained in the discussion, should
already be major constraint for the detectability of galaxy clusters in gamma-rays.
Thus only nearby clusters (z) were considered. This choice reflects the
expectation that the nearest, most massive galaxy clusters are most likely the ones
to be detected as individual sources of gamma-ray emission, whatever their flux.
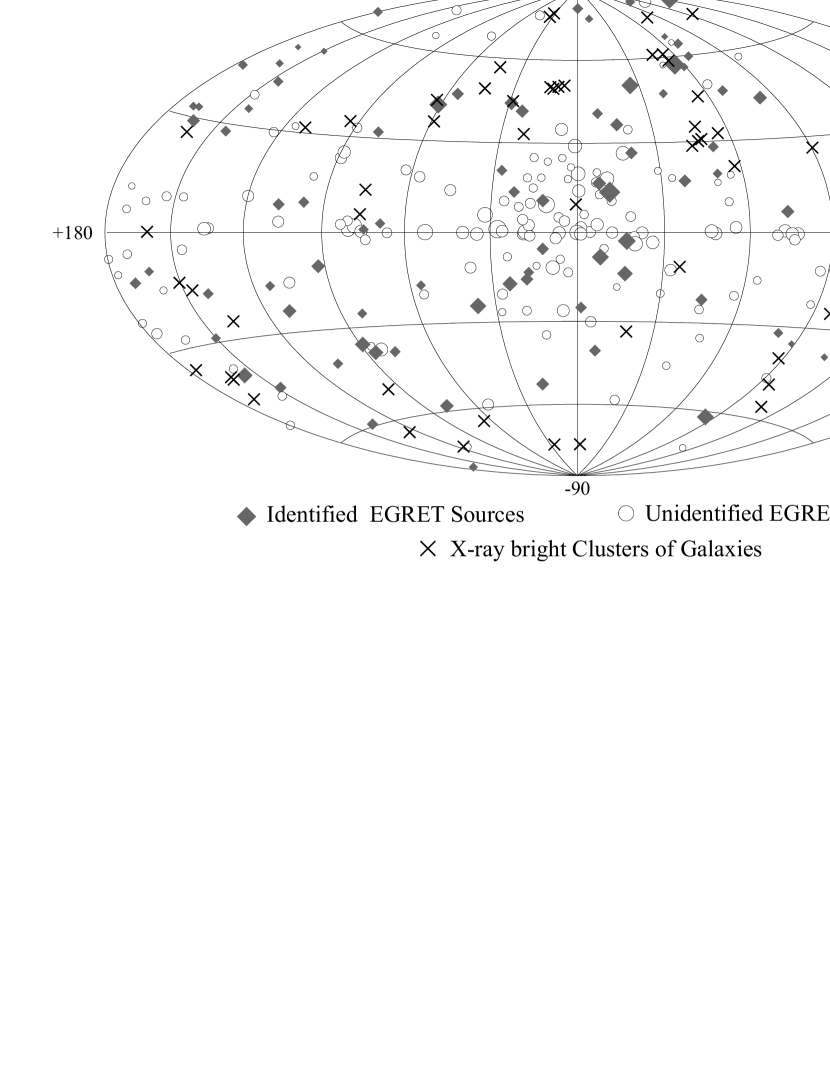
Figure 1 shows the spatial arrangement of the galaxy cluster sample ()
and cataloged high-energy gamma-ray sources (Hartman et al., 1999), in galactic coordinates.
EDITOR place figure 1 here
3 Analysis of galaxy clusters at high-energy gamma-rays
3.1 The study of individual galaxy clusters
Until recently, no positional coincidences between an individual galaxy cluster and gamma-ray point sources
in existing EGRET source catalogues have been reported. For the Coma cluster the result of an EGRET analysis
has been published, based on observations from CGRO cycle 1 and 2 (Sreekumar et al., 1996). In the analysis described here,
EGRET data of individual viewing periods from CGRO observation cycles 1 to 9 were used for the analysis of
58 individual clusters. The latest and presumably final improvements in the efficiency corrections
for the instrumental response of the EGRET spark chamber telescope have been fully implemented.
Each galaxy cluster has been individually analyzed by means of standard EGRET data reduction techniques
(likelihood source finding algorithm and subsequent flux determination at the position of the center of
the X-ray emission). This analysis goes beyond the preliminary study presented by Reimer et al. (1999), in which four
years of EGRET observations were analyzed in strict congruence with the four years of EGRET observations
used for the 3EG catalog of gamma-ray point sources. Coadded images of individual viewing periods,
where a cluster has been observed at less the 30° off the pointing axis of the EGRET instrument (standard
field-of-view observations) or less then 19° (narrow field-of-view observations), have been searched for
gamma-ray excesses after modeling cataloged (and therefore well-known) identified gamma-ray point
sources by using the maximum-likelihood technique as described in Mattox et al. (1996). Gamma-ray source fluxes have been
determined at the coordinates of the cluster center position known from X-ray observations. Applying the same
detection criteria as used and described in the EGRET source catalogs, none of the 58 galaxy clusters are
detected in the EGRET data. Special care has been exercised when already cataloged gamma-ray point sources
are near the position of an Abell cluster, see footnote of Table 1. Three of these sources are
unambiguously identified blazar-class Active Galactic Nuclei: 1633+382 = 3EG J1635+3818 near A2199,
3C279 = 3EG J1255-0549 near A1651, and 1604+159 = 3EG J1605+1553 near A2147. In these cases the particular AGN
has been modelled at it’s known radio position and simultaneously taken into account in the deteremination of the
gamma-ray flux at the position of the Abell cluster in question. Only one of the remaining three
catalog sources shows considerable overlap at the position of an analyzed cluster (A85 with the unidentified
source 3EG J0038-0949). Keeping in mind the width of the point spread function of the EGRET telescope, the
total number of unidentified gamma-ray sources, and the size of our galaxy cluster sample, this occurrence
is perfectly in agreement with chance coincidence: The probability of at least one coincidence between one
of the 170 unidentified EGRET sources and one of the 58 considered galaxy clusters at a distance of 0.81°
as in case of 3EG J0038-0949 and A85, is 48.1 %. Here, a gamma-ray flux has been obtained at the cluster
position without explicitly modeling the known, but unidentified gamma-ray source.
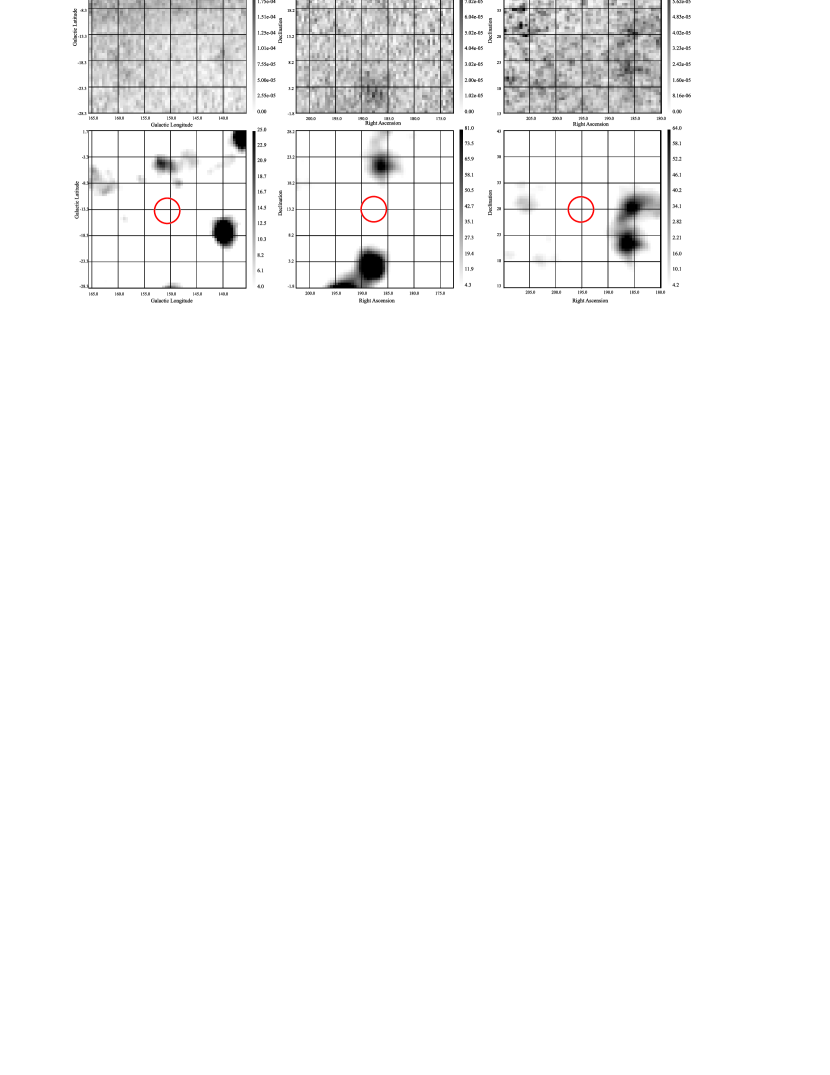
Exemplary for the detailed results given in Tab.1, the intensity and test statistics map of three prominent
galaxy clusters (Perseus, Virgo, and Coma) are shown in Fig.2.
EDITOR place figure 2 here
The most significant gamma-ray excess for any individual cluster has been found for A3532, corresponding to
a detection significance of 1.6 . This is well below the detection threshold for being seriously considered
as a source by standards of the EGRET data analysis, which is at high-galactic latitudes.
Furthermore the achieved detection significance is less than expected from statistical fluctuations at 58 trials
alone. Therefore, for each galaxy cluster a 2 upper limit at the position of the cluster center has been
determined and is given in Tab.1
EDITOR place table 1 here
3.2 The study of the cluster population
Having established that individual clusters are not found in the EGRET data, a further analysis has been
performed to study whether or not these galaxy clusters radiate in gamma-rays as a population. For this purpose,
the counts, exposure, and intensity maps of the individual galaxy clusters have been used. Each individual map has been
transformed into a cluster–centered coordinate system under conservation of the original pixelation. Subsequently,
the individual images have been coadded. Three sets of images have been produced in order to assure that the center
region of the stacked image is not dominated by already identified point sources or the galactic plane:
(1) a superposition of all 58 galaxy clusters in the sample,
(2) a superposition of 54 galaxy clusters excluding those with unambiguously identified and dominant EGRET sources
in the central map bins (A2199: 1633+382, A1650, A1651, and A1689: 3C279), and
(3) a superposition of 50 galaxy clusters excluding those with unambiguously identified and dominant EGRET sources (see above)
or the Galactic Plane in the map center (the Oph and Cyg A cluster, 3C129, and 3A 0745-191).
Each of the three sets have been analyzed, however, here we only report from the least contaminated set (3).
Due to the wealth of accumulated instrumental exposure the results do not differ dramatically between these selections.
The interpretation, however, simplifies considerably since we are not urged to discuss identified and dominant point sources
or foreground emission features at or close to the image center anymore. The total exposure in the center region,
averaged over the four central 0.5° 0.5° map bins, is cm2 s (E MeV)
for the 50 cluster selection, the lowest values at the edge of the 40° by 40° images are
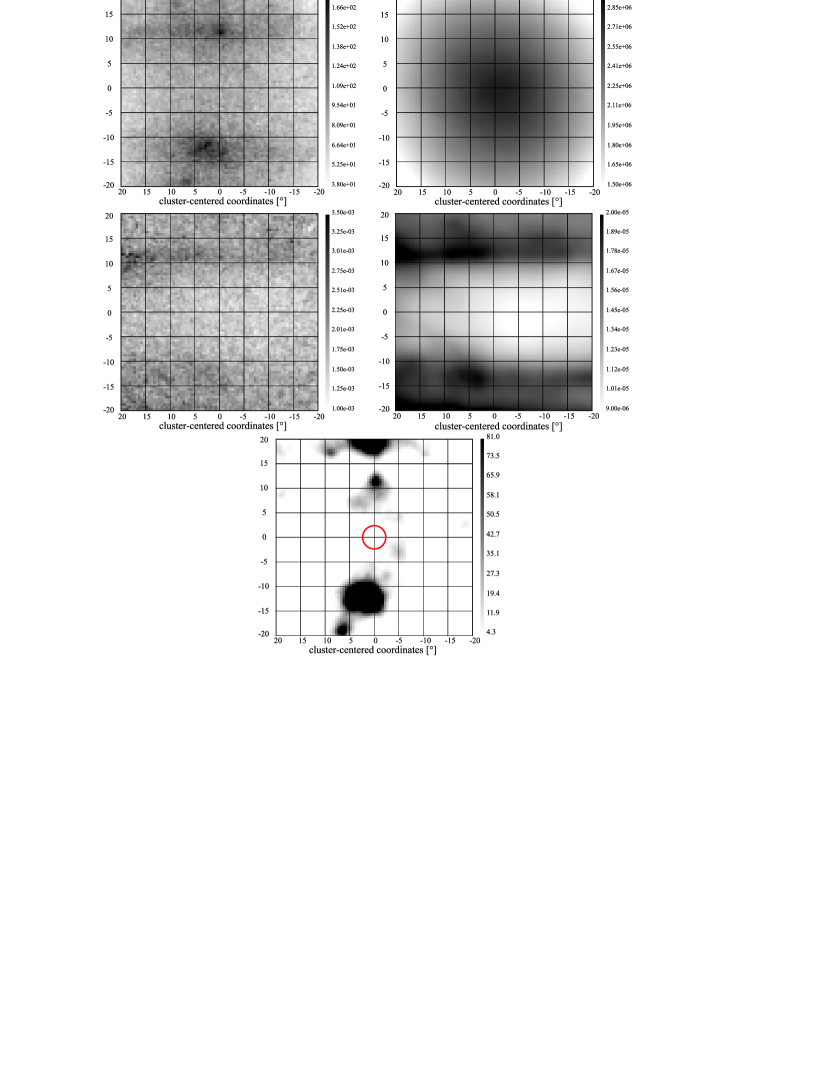
about cm2 s. Figure 3 (upper part) shows the coadded counts, exposure and
intensity map for the 50 cluster sample.
EDITOR place figure 3 here
We have analyzed these images using the maximum-likelihood technique as already described. Here, however, we have to provide a customized diffuse galactic gamma-ray foreground model, adapted for the application of our superpositioned cluster sample in the cluster–centered coordinate system. This was achieved by adopting the standard diffuse galactic emission model (GALDIF) (Hunter et al., 1997) used for EGRET likelihood analysis, given on a 0.5° by 0.5° grid, into a specific diffuse foreground model for the galaxy clusters in cluster–centered coordinates: Corresponding in image size and coordinates with the counts, exposure and intensity map of the individual clusters, the appropriate diffuse maps have been taken directly from the GALDIF model. These maps were subsequently transformed into the cluster–centered coordinate system.
In each individual cluster observation we expect the diffuse foreground emission to contribute a certain number of counts, , that can be calculated as the product of the respective exposure map, , and the intensity of the diffuse emission, . The appropriate diffuse foreground intensity for the coadded data, , is then derived by:
By applying the maximum likelihood procedure in conjunction with the appropriately adapted diffuse model, the 40° by 40° images were searched for excesses. Of interest here is only the map center, corresponding to the emission maximum of the considered galaxy clusters in X-rays. No significant gamma-ray emission excess has been found within a radius of 5° of the origin in the cluster-centered image. With a cumulative exposure of 3.4 cm2 s for E 100 MeV the corresponding upper limit is 5.9 cm-2 s-1 (averaged over the four central 0.5° 0.5° map bins) for the so–constructed average galaxy cluster. Fig.3 (lower part) shows the customized diffuse model and the resulting likelihood test statistics maps. Easily seen in the test statistics image is 3C279, located at 13° from the map center, and thus far too distant to cause any conflict with the determined upper limit.
4 Discussion
4.1 Cases of individual galaxy clusters
The negative results from both an analysis of the gamma-ray data from the EGRET instrument at positions of 58 individual galaxy clusters as well as from a superposition of 50 galaxy clusters needs to be critically discussed with respect to underlying systematics. Categorically, the question of an appropriately chosen selection of galaxy clusters might arise. The assumption has been made that the brightest and nearest clusters detected at X-ray wavelengths should be the most likely candidates to emit observable gamma-rays, supported by various models explaining the multifrequency emission properties and the general understanding of confinement and interaction of cosmic rays in the intercluster medium (ICM) of a galaxy clusters (Berezinsky et al., 1997; Völk et al., 1996). Because almost all clusters exhibiting unusual multifrequency emission characteristics (EUV-excess emission, non–thermal X-ray emission and/or a diffuse radio halo) are naturally included here, the above assumption is certainly not artificial. In Tab.2 we compare our results with two different scenarios of gamma-ray emission from cosmic ray interactions in the ICM, quantitatively predicting gamma-ray emission for some individual galaxy clusters.
EDITOR place table 2 here
Our upper limits are consistently below the predictions as given by Enßlin et al. (1997), and especially Dar & Shaviv (1995).
Thus, the suggested scenarios are ruled out in the given parameter space. Concerns against the results of
Dar & Shaviv (1995) have been already pointed out earlier by Stecker & Salamon (1996) on account of the spectra of the
diffuse galactic and extragalactic gamma-ray background. With the apparent conflict between these model predictions
and the observational upper limits for the individual galaxy clusters,
we clearly disfavor these models against models which predict gamma-ray emission below the sensitivity of the
instruments of the Compton gamma-ray observatory era like inverse Compton scenarios from cosmic ray electrons
accelerated at accretion shocks by (Colafrancesco & Blasi, 1998; Miniati, 2002).
At present, with quantitative predictions about the gamma-ray emission made only in cases of the most prominent
galaxy clusters, and with measured upper limits and predicted fluxes not orders
of magnitudes apart, only a moderate conservative interpretation is tenable:
The degree of freedom in the parameters in the models in conflict with our measurements, especially
if predicting a diffuse extragalactic background component without a single positive detection of
the object class in question made does not allow to discriminate between the suggested scenarios solely
on the basis of the presented gamma-ray data.
Not until the next generation of gamma-ray telescope will be available with good prospects
to detect individual galaxy clusters as well as the chance to observationally constraint the constituents of the
extragalactic diffuse background, the sensitive measurements to discriminate the
various scenarios for gamma-ray emission from galaxy clusters must originate at other wavelengths.
Here, especially three wavebands are of particular interest: the new generation of low-threshold
ground–based Cherenkov–telescopes (IACTs) presently being built or just starting their observations will
provide very sensitive measurements at energies above 100 GeV, thus providing the necessary
information to constrain the inverse Compton component at the highest energies; more and better
hard X-ray measurements may clearly discriminate between thermal and non–thermal emission components
and therefore help to identify the nature of the originating particle population, in particular deciding
on the preference of inverse Compton or non–thermal Bremsstrahlung scenarios; finally, more sensitive
radio halo measurements may be performed, especially at the high–frequency end of the synchrotron
emission component, where currently only the radio halo of the Coma cluster has been sufficiently
investigated (Schlickeiser et al., 1987; Thierbach et al., 2003). High-frequency radio measurements from diffuse cluster halos will
directly constrain the shape and intensity of the resulting inverse Compton component at high energies.
4.2 The case of galaxy clusters as a population
We now discuss the result for the average cluster from our analysis of 50 galaxy clusters population. At the achieved sensitivity there is still no indication of gamma-ray emission from galaxy clusters. The 2 upper limit for the flux of the average cluster is 5.9 cm-2 s-1. This may help to resolve the stark inconsistency between studies performing direct EGRET data analysis on galaxy clusters (i.e. McGlynn et al. (1994), Sreekumar et al. (1996), and this work) and the recently published detection claims originating from information on gamma-ray point sources from the 3EG catalog in conjunction with statistical assessments by Colafrancesco (2001), Colafrancesco (2002) and Kawasaki & Totani (2002). Here, we would like to give a reassessment of these detection claims on a firm spatial–statistical basis. The cluster sample studied by Colafrancesco consists of the entire Abell cluster catalog (Abell et al., 1989) at galactic latitudes ° . The corresponding Poissonian probability distribution for spatial association between the cluster sample and gamma-ray point sources form the EGRET catalog is easy to determine and given in Fig.4a. The two-point autocorrelation function, , for the population of Abell clusters has been intensively studied previously (Hauser & Peebles, 1973; Postman et al., 1986; Olivier et al., 1990; Akylas et al., 2000), but its impact on the correlation analysis can be rigorously calculated only for a very large sample of objects. Here we are concerned with only 170 unidentified EGRET sources, 59 of which are located at . Therefore, we have directly determined the chance probability for an association between an arbitrary source and one of the Abell clusters as a function of the radius–of–interest, i.e. the maximum separation of sources considered as associated. Colafrancesco (2002) reports an association of 50 EGRET sources (resp. 18 unidentified EGRET sources) and 70 Abell cluster (resp. 24 Abell clusters) based on a initial sample of 3979 Abell clusters and 128 EGRET sources (resp. 59 unidentified EGRET sources) at . Pure Poissonian statistics predicts a total of 34.4 (17.2) single, 8.6 (2.0) double and 1.3 (0.2) triple associations between EGRET sources and Abell associations at 1° roi (resp. 0.81° as the average ). Using the modified chance probabilities (Fig. 4b) to account for the autocorrelation of the Abell clusters, one expects a total of 28.0 (10.6) single, 8.9 (2.5) double and 2.6 (0.5) triple association by chance. Autocorrelation among the unidentified EGRET sources at 1° scale is per se excluded due to the moderate angular resolution of the EGRET telescope and its relatively inability to discriminate neighboring sources adequately (”source confusion”). Hence the expected chance associations amount to 40.7 EGRET sources and 56.6 Abell clusters for 128 EGRET sources at 1° roi and 13.7 EGRET sources and 17.5 Abell clusters for 59 unidentified EGRET sources at , respectively. In terms of the cumulative Poisson probability, the significance of the correlation claim by Colafrancesco needs to be reassessed to only 1.36 in case of the 128 EGRET sources (which is anyway meaningless due to the contamination with already identified EGRET sources, the blazars), or 1.03 in case of the 59 unidentified EGRET sources, rigorously indicating the statistical insignificance of the correlation claim.
EDITOR place figure 4 here
Furthermore, the explicitly suggested Abell cluster/unidentified EGRET source associations by Colafrancesco (2002) do not contain
the most likely and prominent galaxy clusters as predicted to be the clusters with the best chance to be detected in
high-energy gamma rays (Fig.5). Actually, only one of the 18 listed unidentified EGRET sources indeed has a truly
X-ray bright Abell cluster counterpart; the remaining 23 clusters are not even included in the most recent
and carefully compiled sample of a flux-limited X-ray bright galaxy clusters population (HIFLUGCS: Reiprich & Böhringer (2002)).
Thus, the identification sequence as suggested by Colafrancesco (radio halo X-ray brightness
counterpart in unidentified gamma-ray source) simply does not work this way, neither globally nor
just in a few of the referenced cases. Similarly, the predictive power of the Lγ–Lradio– and
Lγ–LX–correlation as given in Colafrancesco (2002) must be seriously questioned.
EDITOR place figure 5 here
A further suggestion of possibly merging clusters as counterparts of unidentified gamma-ray sources by
Kawasaki & Totani (2002) is based on only seven individual gamma-ray sources, all of which belong to the sample of steady
unidentified EGRET sources classified as such by Gehrels et al. (2000). However, more specific variability studies of EGRET
sources as performed by Tompkins (1999) and Torres et al. (2001) do not support non-variability for each of these sources.
Two sources clearly exhibit gamma-ray flux variability, and a further two sources belong to the group of gamma-ray
sources where we could not decide on the basic of the current gamma-ray data whether or not a source is truly non–variable.
Thus, a more conservative sample would consist of only three candidates,
reducing the statistical significance of the remaining associations to the level of expected chance coincidences.
Certainly, those newly-suggested counterparts are worthy of an intensive investigation in order to conclude about
their true nature and, subsequently, about their chance to be related to an unidentified gamma-ray source.
At present, this study does not leave sufficient confidence for an association of unidentified gamma-ray sources
and cluster merger systems. Recently, the problem of such association has been theoretically addressed by Berrington & Dermer (2002),
arguing that it is unlikely that more than a few of the isotropically distributed unidentified EGRET sources at high-galactic
latitudes can be attributed to radiation from non–thermal particles produced by cluster merger shocks. Similar conclusions
were reached by Gabici & Blasi (2003), emphasizing the discrepancy between non–thermal activity in galaxy clusters and the relative
ineffectiveness of major shocks to energize the underlying particle population.
Yet another detection claim of galaxy clusters in the gamma-ray data was published recently. A population study
by Scharf & Mukherjee (2002) claims a statistical detection at level from unresolved gamma-ray sources
spatially coincident with Abell clusters, in particular those of high optical richness. It quotes a mean cluster
flux of 1.14 cm-2 s-1 at E 100 MeV in a 1° radius aperture, corresponding
to a 68 % flux enclosure of the EGRET point-spread function. However, the energy–averaged EGRET flux enclosure at
E 100 MeV in a 1° aperture, assuming a source spectrum with a power-law index of -2.0, is in fact much lower,
namely 24.1 %. The 68 % flux enclosure is reached at a radius of 3.1° . Therefore the flux quoted for the
innermost (1∘) radial bin in the study, ph s-1 cm-2 sr-1, in fact corresponds
to a total source flux of 4.7 cm-2 s-1, which is marginally inconsistent with our findings.
Considering a 2° aperture by inclusion of the second innermost bin of 1.2 ph s-1 cm-2 sr-1
from Scharf & Mukherjee (2002), the corresponding mean cluster flux will increase to 9.6 cm-2 s-1,
which is clearly inconsistent with our upper limit for the average cluster from the sample of nearby, X-ray bright galaxy
clusters. Since it is not within the scope of this paper to perform an in–depth study of possible systematic effects,
we only state that the results presented by Scharf & Mukherjee (2002), although at comparable sensitivity level, are apparently
inconsistent with ours.
In conclusion, we still have to await the first observational evidence for the high-energy gamma-ray emission of galaxy clusters. The last generation of gamma-ray telescopes aboard CGRO was not able to resolve an individual galaxy cluster nor the nearby, X-ray brightest clusters of galaxies as a population. Until the next generation of gamma-ray instruments will challenge this important scientific topic, progress is expected at other wavelengths: from GHz-frequency radio observations of radio halos, from studies of soft and hard X-ray excess features with sufficient statistical significance, and from measurements of the new generation of imaging atmospheric Cherenkov telescopes.
References
- Abell et al. (1989) Abell, G.O., Corwin, H.G. and Olowin, R.P. 1989, ApJS, 70, 1
- Akylas et al. (2000) Akylas, A., Georgantopoulos, I. and Plionis, M. 2000, MNRAS, 318, 1036
- Atoyan & Völk (2000) Atoyan, A.M. and V lk, H.J. 2000, ApJ, 535, 45
- Arabadjis & Bregman (1999) Arabadjis, J.S. and Bregman, J.N. 1999, ApJ, 514, 607
- Berezinsky et al. (1997) Berezinsky, V.S., Blasi, P. and Ptuskin, V.S. 1997, ApJ, 487, 529
- Berghöfer at al. (2000) Berghöfer, T.W., Bowyer, S. and Korpela, E.J. 2000, ApJ, 535, 615
- Berghöfer & Bowyer (2002) Berghöfer, T.W. and Bowyer, S. 2002, ApJ, 565, L17
- Berrington & Dermer (2002) Berrington, R.C. and Dermer, C.D. 2002, astro-ph/0209436
- Blasi & Colafrancesco (1999) Blasi, P. and Colafrancesco, S. 1999, Astropart. Phys., 12, 169
- Blasi (2001) Blasi, P. 2001, Astropart. Phys. 15, 223
- Bonamente et al. (2001) Bonamente, M., Lieu, R. and Mittaz, J.P.D. 2001, ApJ, 547, L7
- Bowyer at al. (1999) Bowyer, S., Berghöfer, T.W. and Korpela, E.J. 1999, ApJ, 526, 592
- Bowyer at al. (2001) Bowyer, S., Korpela, E.J. and Berghöfer, T.W., 2001, ApJ, 548, L135
- Dar & Shaviv (1995) Dar, A. and Shaviv, N.J. 1995, Phys. Rev. Lett., 75, 3052
- Dar & Shaviv (1996) Dar, A. and Shaviv, N.J. 1996, Astropart. Phys., 4, 343
- Colafrancesco & Blasi (1998) Colafrancesco, S. and Blasi, P. 1998, Astropart. Phys., 9, 227
- Colafrancesco (2001) Colafrancesco, S., ”Gamma-Rays from Galaxy Clusters: Preliminary Evidences and Future Expectations” in Gamma-Ray Astrophysics 2001, eds: S.Ritz, N.Gehrels, C.R.Shrader, AIP Conference Proceedings 587, New York: American Institute of Physics, 2001, pp.427-431
- Colafrancesco (2002) Colafrancesco, S. 2002, A&A396, 31
- De Grandi et al. (1999) De Grandi, S. et al. 1999, ApJ, 514, 148
- Dureet et al. (2002) Durret, F. et al. 2002 A&A, 390, 397
- Ebeling et al. (1996) Ebeling, H. et al. 1996, MNRAS, 281, 799
- Ebeling et al. (1998) Ebeling, H. et al. 1998, MNRAS, 301, 881
- Edge et al. (1990) Edge, A.C. et al. 1990, MNRAS, 245, 559
- Edge & Steward (1991) Edge, A.C. and Steward, G.C. 1991, MNRAS, 252, 414
- Enßlin et al. (1997) Enßlin, T.A. et al. 1997, ApJ, 477, 560
- Enßlin & Biermann (1998) Enßlin, T.A. and Biermann, P.L. 1998, A&A, 330, 90
- Enßlin et al. (1999) Enßlin, T.A., Lieu, R. and Biermann, P.L. 1999 A&A344, 409
- Fusco–Femiano et al. (1999) Fusco–Femiano, R., dal Fiume, D., Feretti, L. et al. 1999, ApJ, 513, L21
- Fusco–Femiano et al. (2000) Fusco–Femiano, R., dal Fiume, D., De Grandi, S. et al. 2000, ApJ, 534, L7
- Fusco–Femiano et al. (2002) Fusco–Femiano, R. et al., ”High Energy Results from BeppoSAX” in ”Matter and Energy in Clusters of Galaxies”, eds: S.Bowyer & C-Y.Hwang, ASP Conference Proceedings Series, in press (astro-ph/0207241)
- Fujita & Sarazin (2002) Fujita, Y. and Sarazin, C.L. 2002, ApJ563, 660
- Gabici & Blasi (2003) Gabici, S. and Blasi, P. 2003, accepted for publication in ApJ(astro-ph/0207523)
- Gehrels et al. (2000) Gehrels, N. et al. 2000, Nature, 404, 363
- Giovannini et al. (1993) Giovannini, G. et al. 1993, ApJ, 406, 399
- Giovannini et al. (1999) Giovannini, G., Tordi, M. and Feretti, L. 1999, New Astronomy, 4, 141
- Giovannini & Feretti (2000) Giovannini, G. and Feretti, L. 2000, New Astronomy, 5, 335
- Hartman et al. (1999) Hartman, R.C. et al. 1999, ApJS, 123, 79
- Hauser & Peebles (1973) Hauser, M.G. and Peebles, P.J.E. 1973, ApJ, 185, 757
- Hunter et al. (1997) Hunter, S.D. et al. 1997, ApJ, 481, 205
- Kaastra et al. (1999) Kaastra, J.S., Lieu, R. Mittaz, J.P.D. et al. 1999, ApJ, 519, L119
- Kawasaki & Totani (2002) Kawasaki, W. and Totani, T. 2002, ApJ, 576, 679
- Kempner & Sarazin (2001) Kempner, J.C. and Sarazin, C.L. 2001, ApJ, 548, 639
- Lieu at al. (1999) Lieu, R., Bonamente, M., Mittz, J.P.D. et al. 1999, ApJ, 527, L77
- Loeb & Waxman (2000) Loeb, A. and Waxman, E. 2000, Nature, 405, 156
- Mattox et al. (1996) Mattox, J.R. et al. 1996, ApJ, 461, 396
- McGlynn et al. (1994) McGlynn, T.A., Vestrand, W.T. and Jennings, D., ”A High Energy Gamma Ray Survey of Clusters of Galaxies” in The 2nd Compton Symposium, eds: C.E.Fichtel, N.Gehrels, J.P.Norris, AIP Conference Proceedings 304, New York: American Institute of Physics, 1994, pp.669-673
- Miniati (2002) Miniati, F. 2002, MNRAS, 337, 199
- Mücke & Pohl (2000) Mücke, A.G and Pohl, M. 2000, MNRAS, 312, 177
- Olivier et al. (1990) Olivier, S. et al. 1990, ApJ, 356, 1
- Petrosian (2001) Petrosian, V. 2001, ApJ, 557, 560
- Postman et al. (1986) Postman, M., Geller, M.J. and Huchra, J.P. 1986, AJ, 91, 1267
- Reimer et al. (1999) Reimer, O., ”EGRET Observations of Clusters of Galaxies” in Proc. 26th International Cosmic Ray Conference, eds: D.Kieda, M.Salamon, B.Dingus, Salt Lake City, 1999, Vol. 4, pp.89-93
- Reimer & Sreekumar (2001) Reimer, O. and Sreekumar, P., ”Clusters of Galaxies - The EGRET observations between 1991 and 2000” in Gamma-Ray Astrophysics 2001, eds: S.Ritz, N.Gehrels, C.R.Shrader, AIP Conference Proceedings 587, New York: American Institute of Physics, 2001, pp.422-426
- Reiprich & Böhringer (2002) Reiprich, T.H. and Böhringer, H. 2000, ApJ, 467, 716
- Rephaeli et al. (1999) Rephaeli, Y., Gruber, D. and Blanco, P. 1999, ApJ, 511, L21
- Scharf & Mukherjee (2002) Scharf, C.A. and Mukherjee, R. 2002, ApJ, 580, 154
- Schlickeiser et al. (1987) Schlickeiser, R., Sievers, A. and Thiemann, H. 1987, A&A, 182, 21
- Sreekumar et al. (1996) Sreekumar, P. et al. 1996, ApJ, 464, 628
- Stecker & Salamon (1996) Stecker, F.W. and Salamon, M.H. 1996, ApJ, 464, 600
- Stecker & Salamon (1996) Stecker, F.W. and Salamon, M.H. 1996, Phys. Rev. Lett., 76, 3878
- Thierbach et al. (2003) Thierbach, M., Klein, U. and Wielebinski, R. 2003, A&A397, 53
- Tompkins (1999) Tompkins, W.A., PhD thesis, Stanford university 1999, astro-ph/0202141
- Torres et al. (2001) Torres, D.R., Pessah, M.E. and Romero, G.E. 2001, Astronomische Nachrichten, 322, 223
- Totani & Kitayama (2000) Totani, T. and Kitayama, T. 2000, ApJ, 545, 572
- Völk et al. (1996) Völk, H.J., Aharonian, F.A. and Breitschwerdt, D. 1996, Space Science Reviews, 75, 279
- Völk & Atoyan (1999) Völk, H.J. and Atoyan, A.M. 1999, Astropart. Phys., 11, 73
- Waxman & Loeb (2000) Waxman, E. and Loeb, A. 2000, ApJ, 545, L11


| Name | l | b | z | flux (100 MeV) | viewing periods | remarks | |
|---|---|---|---|---|---|---|---|
| [∘] | [∘] | [ cm-2 s-1] | |||||
| 1 | A426 (PER Cluster) | 150.58 | -13.26 | 0.0184 | 3.72 | 0150,0310,0360,0365,0390,2110,3250,4270,7287,7289 | |
| 2 | OPH Cluster | 0.56 | 9.27 | 0.028 | 5.00 | 0050,0160,0270,2100,2140,2190,2230,2260,2290,2295, | |
| 2320,3023,3230,3240,3300,3320,3340,3365,4210,4220, | |||||||
| 4230,4235,4290,5080,5295,6250,6151 | |||||||
| 3 | VIR Cluster | 282.08 | 75.20 | 0.0038 | 2.18 | 0030,0040,0110,2040,2050,2060,3040,3050,3060,3070, | |
| 3080,3086,3110,3116,3120,3130,4050,4060,4070,4080, | |||||||
| 5110,6105,6215,8065,8067,9100,9111 | |||||||
| 4 | COMA Cluster | 58.13 | 88.01 | 0.0238 | 3.81 | 0030,0040,0110,2040,2050,2060,2180,2220,3040,3050, | |
| 3070,3080,3086,3110,3116,3120,3130,4060,4070,4180, | |||||||
| 5150,7155 | |||||||
| 5 | A2319 | 75.68 | 13.50 | 0.056 | 3.79 | 0020,0071,2010,2020,2030,2120,3020,3032,3034,3037, | |
| 3181,3280,3310,3315,3330,7100,7110 | |||||||
| 6 | A3571 | 316.31 | 28.54 | 0.04 | 6.34 | 0120,0230,0320,2070,2080,2150,2170,3160,4050,4080, | |
| 4240 | |||||||
| 7 | A3526 (CEN Cluster) | 302.40 | 21.55 | 0.0109 | 5.31 | 0120,0140,0230,0320,2070,2080,2150,2170,3030,3140, | |
| 3150,3160,4020,4025,4240 | |||||||
| 8 | TRA Cluster | 324.36 | -11.38 | 0.051 | 8.13 | 0230,0270,0350,0380,2320,3140,3150,3365,4020,4025 | |
| 9 | 3C129 (3A 0446+449) | 160.39 | 0.13 | 0.0223 | 5.29 | 0002,0005,0150,0310,0360,0365,0390,2130,2210,3211, | |
| 3215,3195,3250,4120,4260,4270 | |||||||
| 10 | AWM7 (2A 0251+413) | 146.34 | -15.63 | 0.018 | 3.47 | 0150,0360,0365,0390,2110,3250,4270,7287,7289 | |
| 11 | A754 | 239.20 | 24.71 | 0.054 | 8.18 | 0300,0330,0410,0440 | |
| 12 | A2029 | 6.49 | 50.55 | 0.0768 | 7.49 | 0240,0245,0250,3390,4060,4070 | |
| 13 | A2142 | 44.23 | 48.69 | 0.0899 | 4.97 | 0092,0240,0245,0250,2010,2020,3034,3390,5165,5190, | |
| 7210,7225 | |||||||
| 14 | A2199 | 62.93 | 43.69 | 0.0299 | 9.27 | 0092,2010,2020,3034,4030,5156,5190,6178,7210,7225 | a |
| 15 | A3667 | 340.88 | -33.39 | 0.055 | 3.82 | 0350,0380,0420,2090,3230 | |
| 16 | A478 | 182.43 | -28.29 | 0.09 | 5.14 | 0002,0003,0004,0005,0010,0021,0210.0360,0365,0390, | |
| 2130,2210,3211,3215,3170,3370,4120,4130,4191,4195, | |||||||
| 4200,4260 | |||||||
| 17 | A85 | 115.04 | -72.06 | 0.055 | 6.32 | 0091,0132,0210,3270,3360,4040,4250,4280,9150,9160 | b |
| 18 | A3266 | 272.14 | -40.16 | 0.0545 | 4.42 | 0060,0100,0170,2200,2240,3290,3350,3355,4090,4150, | |
| 5210 | |||||||
| 19 | A401 | 164.18 | -38.87 | 0.075 | 9.28 | 0150,0210,0360,0365,0390,3170,4250,6311,9175 | |
| 20 | 3A 0745-191 | 236.42 | 2.99 | 0.1028 | 7.08 | 0007,0080,0410,0440,3010,3385,5100,5105 | |
| 21 | A496 | 209.57 | -36.48 | 0.0327 | 7.11 | 0290,3370,4191,4195,4200 | |
| 22 | A1795 | 33.81 | 77.18 | 0.063 | 3.98 | 0030,0040,0240,0245,2180,2220,3070,3080,3086,3110, | |
| 3116,3120,3130,4060,4070,5150 | c | ||||||
| 23 | A2256 | 111.10 | 31.74 | 0.056 | 4.28 | 0180,0220,2160,3190,4010 | |
| 24 | CYG A Cluster | 76.19 | 5.76 | 0.057 | 4.46 | 0020,0071,2030,2120,3020,3032,3034,3037,3181,3280, | |
| 3310,3315,3330,6011 | |||||||
| 25 | 2A 0335+096 | 176.25 | -35.08 | 0.0349 | 8.11 | 0210,0360,0365,0390,2130,3170,4200,6311,9175 | |
| 26 | A1060 | 269.63 | 26.50 | 0.0114 | 14.85 | 0007,0300,0320,0330,2300,2305,3010,3030,3385 | |
| 27 | A3558 | 312.00 | 30.72 | 0.048 | 3.58 | 0120,0230,0320,2070,2080,2150,2170,3160,4050,4080, | |
| 4240 | |||||||
| 28 | A644 | 229.93 | 15.29 | 0.0704 | 9.71 | 0300,0330,0410,0440,4035,5100,5105 | d |
| 29 | A1651 | 306.73 | 58.63 | 0.086 | 3.75 | 0030,0110,2040,2050,2060,2070,3040,3050,3060,3070, | |
| 3080,3086,3110,3116,3120,3130,4050,4060,4070,4080, | |||||||
| 5110,5115,6060,6070,6080,6090,6100,6105,6111,6215, | |||||||
| 8065,8067,9100,9111 | e | ||||||
| 30 | A3562 | 313.30 | 30.35 | 0.0499 | 3.62 | 0120,0230,0320,2070,2080,2150,2170,3160,4050,4080, | |
| 4240 | |||||||
| 31 | A1367 | 234.80 | 73.03 | 0.0215 | 2.72 | 0030,0040,0110,2040,2050,2060,2180,2220,3040,3050, | |
| 3060,3070,3080,3086,3110,3116,3120,3130,3220,3260, | |||||||
| 4180,5150,7155 | |||||||
| 32 | A399 | 164.36 | -39.46 | 0.072 | 4.92 | 0150,0210,0360,3170,4250,6311,9175 | |
| 33 | A2147 | 28.80 | 44.49 | 0.0356 | 7.45 | 0092,0240,0245,0250,2010,3390 | f |
| 34 | A119 | 125.74 | -64.11 | 0.044 | 4.51 | 0210,0260,0280,0370,3170,3200,3270,3360,4250 | |
| 35 | A3158 | 264.68 | -48.76 | 0.0575 | 2.52 | 0060,0100,0170,0290,2200,2240,3290,3350,3355,4090, | |
| 4150,5170,5210,8010,8020,8339 | |||||||
| 36 | HYD A Cluster | 242.93 | 25.09 | 0.0538 | 7.24 | 0300,0330,0410,0440 | |
| 37 | A2065 | 42.86 | 56.56 | 0.06 | 5.51 | 0092,0240,0245,0250,2010,2020,3390 | |
| 38 | A2052 | 9.42 | 50.12 | 0.0348 | 6.24 | 0240,0245,0250,3390,4060,4070 | |
| 39 | A2063 | 12.82 | 49.69 | 0.036 | 5.52 | 0240,0245,0250,3390,4060,4070 | |
| 40 | A1644 | 304.89 | 45.44 | 0.0456 | 2.89 | 0030,0110,0120,0320,2040,2050,2060,2070,2080,2150, | |
| 2170,3040,3050,3060,3070,3120,3160,4050,4060,4070, | |||||||
| 4080,4240,5110,5115,6060,6070,6080,6090,6100,6105, | |||||||
| 6111,6215,8065,8067,9100 | |||||||
| 41 | Klem 44 (A4038) | 25.08 | -75.90 | 0.0283 | 3.60 | 0091,0132,4040,4280 | |
| 42 | A262 | 136.58 | -25.09 | 0.0161 | 6.00 | 0150,0260,0280,2110,3170,3250,4250,4270,7287,7289 | |
| 43 | A2204 | 21.09 | 33.25 | 0.153 | 7.99 | 0160,0240,0245,0250,3240,3390,4290 | |
| 44 | A2597 | 65.36 | -64.84 | 0.0824 | 8.19 | 0091,0132,0190,3200,3220,3270,4040 | |
| 45 | A1650 | 306.72 | 61.06 | 0.084 | 3.07 | 0030,0110,2040,2050,2060,2070,3040,3050,3060,3070, | |
| 3080,3086,3110,3116,4050,4060,4070,4080,5110,5115, | |||||||
| 6060,6070,6080,6090,6100,6105,6111,6215,8065,8067, | |||||||
| 9100,9111 | |||||||
| 46 | A3112 | 252.95 | -56.09 | 0.0746 | 4.86 | 0100,0290,3290,3350,3355,4090,4280,5170,8010,8020, | |
| 8339 | |||||||
| 47 | A3532 | 304.44 | 32.48 | 0.0537 | 7.42 | 0120,0320,2050,2070,2080,2150,2170,3160,4050,4080, | |
| 4240 | |||||||
| 48 | A4059 | 356.84 | -76.06 | 0.0748 | 2.86 | 0091,0132,4040,4280 | |
| 49 | A3395 | 263.18 | -25.13 | 0.0498 | 3.28 | 0007,0060,0080,0170,2300,3010,3290,3350,3355,3385, | |
| 4090,4150,5210 | |||||||
| 50 | MKW 3s | 11.38 | 49.45 | 0.0434 | 5.31 | 0240,0245,0250,3390,4060,4070 | |
| 51 | A1689 | 313.38 | 61.10 | 0.1832 | 4.00 | 0030,0110,0240,0245,2040,2050,2060,2070,3040,3050, | |
| 3060,3070,3080,5110,5115,6060,6070,6080,6090,6100, | |||||||
| 6105,6111,6215,8065,8067,9100,9111 | |||||||
| 52 | A576 | 161.42 | 26.24 | 0.038 | 3.47 | 0006,0180,0310,2160,2270,2280,3190,3195,4111,4115, | |
| 5185 | |||||||
| 53 | A2244 | 58.81 | 36.31 | 0.097 | 4.29 | 0092,2010,2020,3034,4030,5165,5190,6178,7210,7225 | |
| 54 | A2255 | 93.95 | 34.93 | 0.0808 | 5.43 | 0092,0220,2010,2020,2120,3020,3032,3034,3037,4030, | |
| 7100,7110 | |||||||
| 55 | A1736 | 312.55 | 35.10 | 0.0431 | 3.48 | 0120,0320,2040,2050,2060,2070,2080,2150,2170,3160, | |
| 4050,4080,4240,5115 | |||||||
| 56 | A400 | 170.24 | -44.94 | 0.0238 | 6.51 | 0210,3170,4250,6311,9175 | |
| 57 | A2657 | 96.65 | -50.30 | 0.0414 | 7.43 | 0190,0260,0280,0370,3200,3270,3360,4100,4250,5070, | |
| 5075 | |||||||
| 58 | A1775 | 31.99 | 78.73 | 0.0722 | 3.47 | 0030,0040,0110,0240,0245,2180,2220,3040,3070,3080, | |
| 3086,3110,3116,3120,3130,4060,4070,5150 |
Note. — a of 3EG J1635+3813
b of 3EG J0038-0949
c of 3EG J1347+2932
d of 3EG J0812-0646
e of 3EG J1255-0549
f of 3EG J1605+1553
| Cluster | this measuremnt | from Enßlin et al.(1997) | from Dar & Shaviv (1995) |
|---|---|---|---|
| A426 (Perseus) | |||
| Ophiuchus | |||
| A1656 (Coma) | |||
| M87 (Virgo) |
Note. — in units of ph