A Brown Dwarf Microlens Candidate in the OGLE-II Database
Abstract
We describe a unique mass determination for a microlensing event from the second phase of the Optical Gravitational Microlensing Experiment (OGLE-II). The event, sc26_2218, which is very bright (baseline magnitude ), appears to exhibit both parallax and finite source effects. The parallax effect allows us to determine the projected Einstein radius on the observer plane (), while the finite source effect allows us to determine the ratio of the angular source size and the angular Einstein radius. As the angular size of the star can be estimated using its color and magnitude, we can hence determine the angular Einstein radius . By combining and we can determine the lens mass , independent of the source distance. The lens is therefore a brown dwarf candidate. However, the “parallax” signature is weak and so we cannot completely discount the possibility that these signatures originate from binary rotation of the source (which would prevent any estimate of the lens mass), rather than parallax. However, this can be tested by future spectroscopic observations. This event highlights the scientific returns for intense monitoring of bright microlensing events, since the parallax and finite source effects can be more easily identified due to their high signal-to-noise ratios.
1 Introduction
Gravitational microlensing events toward the Galactic bulge provide a unique sample to study the mass functions in the Milky Way (for review on microlensing, see Paczyński 1996). However, this important application is severely hampered by the lens degeneracy. This degeneracy arises because, in general, only a single physical constraint can be derived from an observed light curve, namely the Einstein radius crossing time, which depends on the lens mass, various distance measures and the relative velocity. This degeneracy can be most easily lifted using space satellites (e.g. Gould 1994b), such as the proposed GEST (Bennett et al. 2002a). Without observations from space, unique mass determinations are only possible for exotic microlensing events. So far, this has been possible for no more than two microlensing events. An et al. (2002) determined the lens mass for the binary caustic crossing event, EROS BLG-2000-5, by combining parallax effects (Gould 1992) and finite source effects (Gould 1994a; Witt & Mao 1994; Nemiroff & Wickramasinghe 1994). Alcock et al. (2001) have also made a tentative estimate of the microlens mass for a different event, MACHO-LMC-5, by utilizing measurements of both the parallax effect and the microlens proper motion. However, this mass determination requires confirmation since it relies on a difficult measurement of the very small microlensing parallax effect.
In this paper we present another unique mass determination for event sc26_2218 from OGLE-II Difference Image Analysis data. Using high-precision data we are able to detect both parallax and finite source effects, which allows us to determine the mass of the lensing object.
2 Observational Data
The observational data that we use are based on observations performed in the second phase of the OGLE experiment (OGLE-II). The observations were carried out with the 1.3-m Warsaw telescope at the Las Campanas Observatory, Chile, which is operated by the Carnegie Institution of Washington. The instrumentation of the telescope and CCD camera are described in detail by Udalski, Kubiak & Szymański (1997).
The event sc26_2218, which was observed toward the Galactic bulge, was first identified in Woźniak et al. (2001) using the difference image analysis software of Woźniak (2000). The light curve data for this event are available publicly333http://astro.princeton.edu/~wozniak/dia/lens/. The coordinates of the star are , (in J2000), which correspond to ecliptic coordinates, , (in J2000), and Galactic coordinates , .
We extracted the I-band baseline magnitude of the star from Woźniak et al. (2001) and cross-checked with the OGLE-II DoPhot Photometry. The star turns out to be very bright with a baseline magnitude of mag. There are 8 -band observations for the star. We used the three most reliable of these to derive the -band magnitude, which gives the color of the star mag.444 Udalski et al. (2002) recently published the the photometry and BVI colors for 30 million stars toward the Galactic center. However their values for this star cannot be used, as both its baseline magnitude and colors are based on average values that include the microlensed data points.
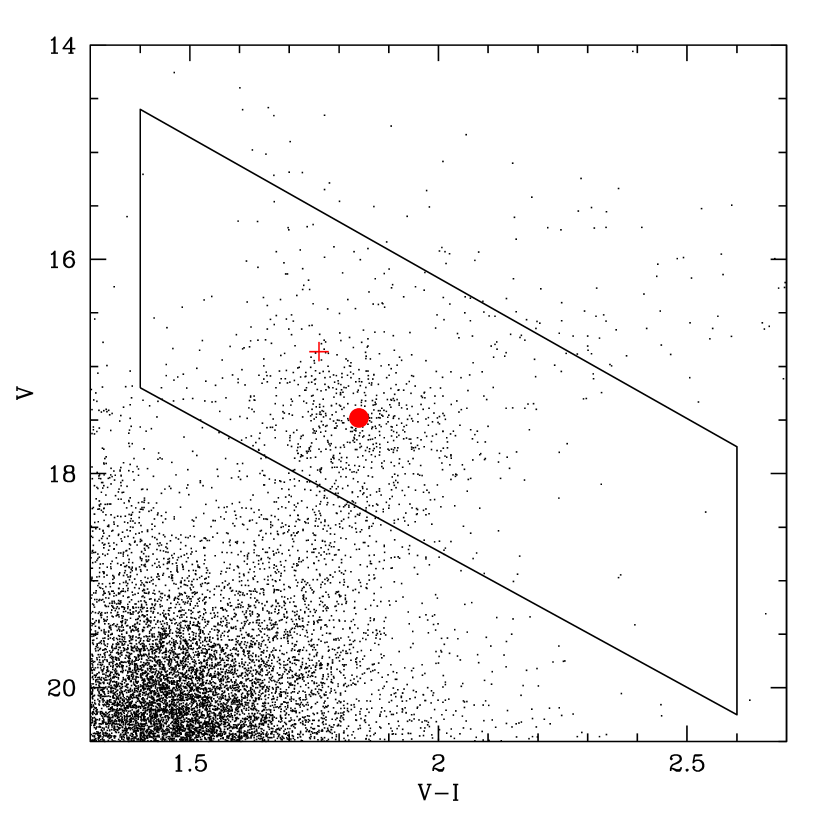
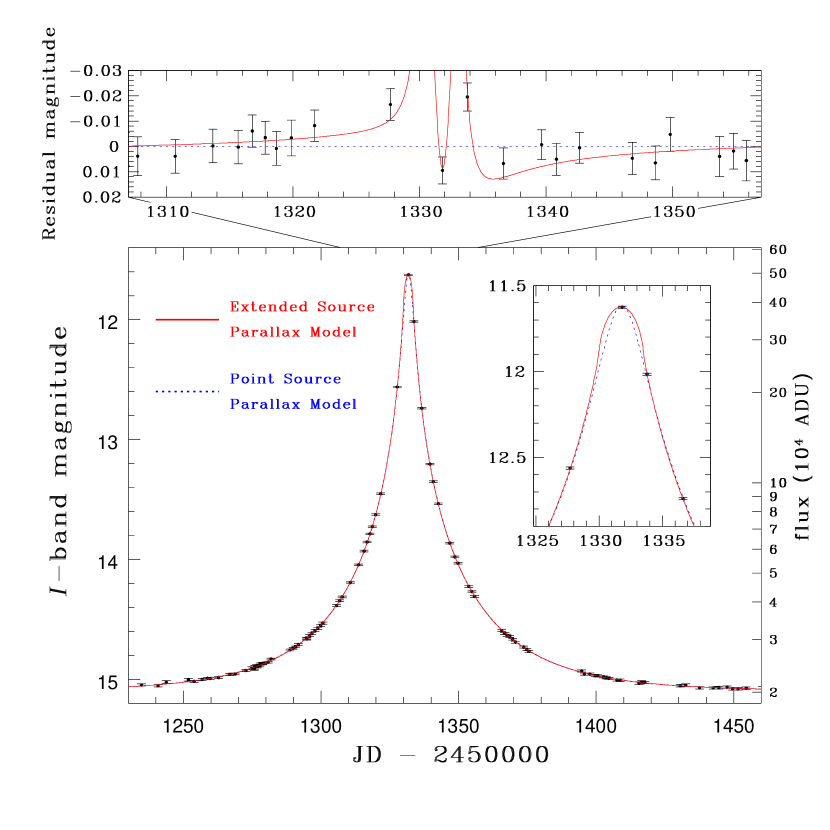
Fig. 1 shows the color-magnitude diagram for the field around sc26_2218. The star appears to lie within the red clump giant region and therefore the source is probably located in the Galactic bulge. The light curve obtained from the difference image analysis is shown in Fig. 2. The quality of the light curve is striking, with a typical error of 0.8% throughout a large magnitude range ( to 11.6 mag).
3 Model
3.1 Point Source models
We first fit the observed light curve with the usual standard and parallax microlensing models. Both models use the approximation that the source can be regarded as point-like. The fitting procedures are identical to those used in our previous papers (Smith et al. 2002b; Mao et al. 2002). We refer the readers to those papers for details; here we only briefly review the parameters that we use in the models.
To fit the I-band data with the standard model incorporating blending (see, e.g. Paczyński 1986), we need five parameters, namely the impact parameter , the time of closest approach , the baseline magnitude , the Einstein-radius crossing timescale, , and the blending parameter, , which parametrizes the fraction of light that is contributed by the lensed source. The parameter () is required to account for blending, owing to the crowded nature of the fields toward the Galactic center.
The best-fit parameters are found by minimizing the usual using the MINUIT program in the CERN library555http://wwwinfo.cern.ch/asd/cernlib/ and are tabulated in Table 1. The resulting for the standard model is 277.9 for 236 data points.
Next we proceed to incorporate the parallax effect (Gould 1992). This effect, which arises due to the Earth’s orbital motion, produces perturbations from the standard model light curve, and is described in detail in Soszyński et al. (2001); see also Alcock et al. (1995), Dominik (1998). It requires two additional parameters; the Einstein radius projected onto the observer plane, , and an angle in the ecliptic plane, , describing the orientation of the lens trajectory (given by the angle between the heliocentric ecliptic -axis and the normal to the trajectory)
The best-fit parallax model is given in Table 1, and the corresponding light curve is presented in Fig. 2. This model clearly improves upon the standard model, with a best-fit parallax of 236.7. It is interesting to note that one would not normally expect to observe parallactic deviations for an event with such a short time-scale ( days for this point-source parallax model), since the Earth has not moved a significant distance in its orbit around the Sun. However, due to the high signal-to-noise ratio for sc26_2218, we are able to detect these weak parallactic signatures. Also, as a result of the weak signatures, a slightly worse alternative parallax model is possible (see §4).
3.2 Finite Source Models
Notice that the parallax model does not match the observed fluxes around the peak when the source is highly magnified (the peak magnification for sc26_2218 is approximately 25). This kind of deviation at high magnifications is precisely what is expected from finite source effects (Gould 1994a; Witt & Mao 1994; Nemiroff & Wickramasinghe 1994). We therefore proceed to incorporate this effect into our model. This requires one additional parameter, , which denotes the source radius in units of the lens’ angular Einstein radius.
We initially attempt to fit the light curve with a finite source model without incorporating the parallax effect. This is clearly unable to provide a suitable fit, with . The next logical step is to incorporate the parallax effect and the finite source effect simultaneously in the modeling. This provides a greatly improved fit, with , i.e. an improvement of on the next best model (the point-source parallax model). The significance of this improvement is . We also attempted to fit the light curve with a non-uniform source brightness, using the limb-darkening profile of An. et al. (2002), but this gave no noticeable improvement and the best-fit parameters remained unchanged.
The best-fit parameters for this finite source parallax model are given in Table 1 and the corresponding light curve is presented in Fig. 2. The most important parameters from this model are,
| (1) |
Unfortunately the value for is not well constrained, but is tightly constrained. From these quantities we can calculate , the transverse velocity of the lens relative to the source, projected onto the observer plane. This is relatively high compared to previous reported parallax events (cf. Smith, Mao & Woźniak 2002a; Bennett et al. 2002b), although this could be due to the fact that the timescale is unusually short for a microlensing parallax event and also because we expect the projection factor to be large (since the lens is predicted to reside much closer to the source than the observer; see §3.3).
3.3 Mass determination
Given the above model incorporating both parallax and finite source effects, it is possible to determine the lens mass provided that an estimate of the angular size of the source can be made. Albrow et al. (2000) showed that the angular size of the source can be determined from its de-reddened color and magnitude. The color-magnitude diagram for this event (Fig. 1), shows that the observed magnitude of the center of the red clump region for this field is given by , . From Popowski (2000), the intrinsic de-reddened color of the center of the red clump region in the Galactic center is . Therefore the reddening for the field is given by,
| (2) |
As the extinction in the Galactic center may be anomalous (Udalski 2002), we checked the extinction slope using the method of Woźniak & Stanek (1996). We find that the extinction slope, , is about 1.39, which is close to, but slightly smaller than, the standard value (1.49, Stanek 1996). Therefore the extinction is,
| (3) |
Since our best-fit model favors no blending, the -band baseline apparent magnitude of the lensed source is . As was stated in §2, from the color-magnitude diagram for this field (Fig. 1) one concludes that the source is likely to be located in the red clump region and hence undergo the same reddening and extinction as calculated in eq. (2) & (3). This would imply that the source has an intrinsic brightness of and an intrinsic color of .
This intrinsic color can then be converted from into (using, for example, Table III of Bessell & Brett 1988). Once this has been done, a value for the angular size of the source () can be calculated from an empirical surface brightness-color relation (eq. 4 from Albrow et al. 2000), and we find that as, which corresponds to a physical stellar radius of about if the source is away.
This value for can be combined with the above constraint on (eq. 1) to determine the lens’ angular Einstein radius,
| (4) |
Combining and , we can infer the lens mass directly,
| (5) |
The errors on the lens mass are dominated by the errors in (see eq. 1), since the rest of the parameters are comparatively well constrained compared to . It is important to stress that the lens mass is independent of the source distance.666It should be noted that the estimate of is not entirely independent of the source distance, because if the source lies significantly closer to us than the Galactic center our assertion that it undergoes the same amount of extinction/reddening as the red clump stars may be invalidated. However, the distance to the lens depends on the source distance; if the source is a red clump star and it is located in the bulge at a distance of , then this implies that the distance to the lens is approximately . At such a distance, the brown dwarf lens should contribute essentially no light, which is entirely consistent with the best-fit blending parameter .
4 Discussion
In this paper we have presented a detailed analysis of the microlensing event sc26_2218, identified first by Woźniak et al. (2001) using the OGLE-II database. We showed that this event is best fitted by incorporating both parallax and finite source effects. Combined with an estimate of the source angular size using its color and magnitude, these two effects allow us to determine the lens mass uniquely. Intriguingly, the lens mass () lies within the brown dwarf regime. In comparison, An et al. (2002) determined a total lens mass of and mass ratio for the binary lens EROS BLG-2000-5, and Alcock et al. (2001) made a tentative estimate of for MACHO-LMC-5.
The event was not identified in our first search (Smith et al. 2002a) because at the time no baseline flux information was available to us. As a result, the best-fit standard model for this event was comparable to the best-fit parallax model. However, if we take into account the positive definite constraint on the source flux the standard model becomes worse than the parallax model. This prompted us to pursue sc26_2218 further in this study. We have since redone the fitting for all events in the OGLE-II catalog. The results for most events are unchanged, except for sc26_2218 and an additional parallax event (sc5_2859) that was reported in Smith (2003). This brings the total number of convincing parallax events in the OGLE-II catalog to 5/520, i.e. around 1%.
It has been shown (Smith, Mao & Paczyński 2002c) that under certain circumstances seemingly parallactic light curves can be well fit by a model incorporating a constant acceleration term. This is important for events that exhibit only weak perturbations from the standard model, such as sc26_2218. Indeed, we found that a constant-acceleration finite source model is able to provide a good fit to this event, with . This fit is only slightly worse than the best-fit finite source parallax model (). For perturbations which are well described by a constant acceleration, it is difficult to determine whether they originate from the parallax effect or from binary rotation in the source (Smith et al. 2002c). Hence we cannot categorically state that these are indeed parallactic signatures. However, this binary source hypothesis can be tested through future spectroscopic observations, which should reveal periodic modulations in radial velocity from the binary rotations. The radial velocity is expected to be about with a period of year. As the star is bright ( and ), these observations should be straightforward to perform even with medium-size telescopes.
Smith et al. (2002c) also showed that events which are suitably fit by a constant-acceleration model exhibit two degenerate sets of parallax solutions. For sc26_2218 two sets of finite-source-size parallax solutions were found with . However, the important parameters that determine the lens mass (i.e. and ) are virtually identical between the two solutions, and the above conclusions regarding the lens mass are consequently unaffected by this degeneracy.
Assuming that this best-fit parallax model is accurate, it may be possible to indirectly determine the proper motion of the lens. To do this we require the transverse proper motion of the lens relative to the source, which is directly determined from the parallax fit (but not in the constant acceleration model). Given this relative proper motion, if the absolute proper motion of the source can be found using many background quasars in the field (see, for example, Sumi, Eyer & Woźniak 2002) this will provide a determination for the absolute proper motion of the lens. This information can be used to provide further constraints on the lens for any future likelihood analysis.
sc26_2218 highlights the possibility of unique mass determinations using highly-magnified bright microlensing events. For such events, the signal-to-noise ratio may be high enough that even minute parallax signatures can be detected. If the sampling at the peak of the light curve is dense enough, then finite source effect may also be detected with high significance. If the sampling for sc26_2218 was higher, then the finite source effect would have been detected at even greater significance. With an order of magnitude increase in the microlensing rate for OGLE-III, surely many events similar to sc26_2218 can be discovered.
References
- (1)
- (2) Albrow, M. D., et al. 2000, ApJ, 534, 894
- (3) Alcock, C., et al. 1995, ApJ, 454, L125
- (4) Alcock, C., et al. 2001, Nature, 414, 617
- (5) An, J. H., et al. 2002, ApJ, 572, 521
- (6) Bessell, M. S., & Brett, J. M. 1988, PASP, 100, 1134
- (7) Bennett, D. P., et al. 2002a, astro-ph/0209435
- (8) Bennett D.P., et al. 2002b, ApJ, 579, 639
- (9) Dominik, M. 1998, A&A, 329, 361
- (10) Gould, A. 1992, ApJ, 392, 442
- (11) Gould, A. 1994a, ApJ, 421, L71
- (12) Gould, A. 1994b, ApJ, 421, L75
- (13) Mao, S. et al. (OGLE collaboration) 2002, MNRAS, 329, 349
- (14) Nemiroff, R. J., & Wickramasinghe, W. A. D. T., 1994, ApJ, 424, L21
- (15) Paczyński, B. 1986, ApJ, 304, 1
- (16) Paczyński, B. 1996, ARA&A, 34, 419
- (17) Popowski, P. 2000, ApJ, 528, L9
- (18) Smith, M. C., Mao, S., & Woźniak, P. 2002a, MNRAS, 332, 962
- (19) Smith, M. C., et al. (OGLE collaboration) 2002b, MNRAS, 336, 670
- (20) Smith, M. C., Mao, S., & Paczyński, B. 2002c, MNRAS, in press (astro-ph/0210370)
- (21) Smith, M. C. 2003, MNRAS, submitted
- (22) Soszyński, I., et al. 2001 (OGLE collaboration), ApJ, 552, 731
- (23) Stanek, K. Z. 1996, ApJ, 460, L37
- (24) Sumi, T., Eyer, L., & Woźniak, P. R., astro-ph/0210381
- (25) Udalski, A., Kubiak, M., & Szymański, M., 1997, Acta Astron., 47, 319
- (26) Udalski, A., et al. 2002, astro-ph/0210278
- (27) Udalski, A. 2002, astro-ph/0210367
- (28) Witt, H. J., & Mao, S. 1994, ApJ, 430, 505
- (29) Woźniak, P. 2000, Acta Astron., 50, 421
- (30) Woźniak, P. & Stanek, K.S. 1996, ApJ, 464, 233
- (31) Woźniak, P., et al. (OGLE collaboration) 2001, Acta Astron., 51, 175
- (32)
| (day) | (radians) | (AU) | |||||||
|---|---|---|---|---|---|---|---|---|---|
| S | — | — | — | 277.9/231 | |||||
| P | — | 236.7/229 | |||||||
| P+F | 214.4/228 |