Upper Limits on the X-ray Emission of “Uranium” Stars
Abstract
A paper by Qian & Wasserburg suggests the optical absorption lines of uranium observed in the spectra of ultra-metal-poor stars (defined as [Fe/H] -3) arise from contamination from a supernova in a binary star system. Assuming the binary survived the explosion, a collapsed compact object may be present and implying potential accretion processes with accompanying X-ray emission. Upper limits on X-ray emission from an accreting compact object are described here.
1 Introduction
Datings of radioactive materials provide the firmest ages known. In the case of long-lived heavy elements such as thorium and uranium, derived age values encompass the estimated age of the Galaxy.
Ultra-metal poor stars, defined as stars with very low abundances of heavy elements ([Fe/H] -3) and largely confined to the Galactic halo, evidently represent the earliest generation of stars formed as the Galactic disk was still collapsing (e.g., Qian & Wasserburg 2001a; Cayrel et al. 2001). As such, they are largely devoid of contamination by subsequent generations of supernovae and star formation that occurred within the disk.
Recently, observations of three stars, uncovered from optical surveys of ultra-metal-poor stars (Ryan, Norris, & Beers 1996 and references therein), revealed absorption lines of r-process elements. BPS CS31082-001, hereafter CS31082, exhibits an optical absorption line from uranium at 3889.57Å which yields an abundance of log(U/H) = -13.70.140.12 (random + systematic) and an estimated age for the star of 12.53 Gyr (Cayrel et al., 2001). BPS CS22892-052, hereafter CS22892, also exhibits optical absorption lines from heavy elements, particularly thorium (absorption line at 4019Å, Sneden et al. 2000). Both stars show absorption lines from r-process elements enhanced relative to Fe. Cowan et al. (2002) report the detection of a weak optical line in BD+17∘ 3248, hereafter BD17, at 3589.6Å from U II. Other stars undoubtedly show similar line features of r-process elements.
Uranium and other neutron-rich nuclei have long been believed to be produced in the explosive nucleosynthesis accompanying a supernova (e.g., Hillebrandt, Nomoto, & Wolff 1984). Briefly, the r-process is a chain of neutron captures required to explain neutron-rich nuclides for species above atomic mass 70. Successful production requires very high neutron densities (Nn 1019 cm-3) and high temperature (T 109 K) for the capture process to proceed more rapidly than decay. The site of the r-process is not well-defined, but the required conditions essentially demand an association with a supernova.
Subsequent research raised significant questions about the prompt mechanism and spurred searches for other sites. One mechanism currently enjoying wide support sites the r-process in the -heated ejecta of the newborn neutron star (Woosley & Hoffman 1992; Meyer et al. 1992; Woosley et al. 1994; Otsuki et al. 2000; Terasawa et al. 2001). Other sites include merging neutron stars (Freiburghaus, Rosswog, & Thielemann, 1999) and collapsing ONeMg cores (Wheeler, Cowan, Hillebrandt, 1998). Sumiyoshi et al. (2001) resurrected the prompt mechanism using new, slower e--capture rates. A recent paper by Meyer (2002) shows that an excess of neutrons may not be necessary for the r process to proceed.
Qian & Wasserburg (2001b) argued that the presence of r-processed material in ultra-metal-poor stars suggested the possible presence of a compact binary companion that formed after the detonation of the supernova. Their argument is based upon a theory for element production developed during the past few years (summarized in Qian & Wasserburg 2000). Based upon their study of the cosmic abundances, they postulate the existence of high- and low-frequency Type II (core collapse) supernovae. The class of progenitors of the high-frequency supernovae detonate quickly, on the time scale of stellar evolution, or with a rate of approximately 10-7 yr-1. The low-frequency supernovae detonate less often, at a rate of approximately 10-8 yr-1.
The nucleosynthetic products generated by the two types of supernovae differ, with the frequent supernovae producing the majority of the heavy r-process nuclei (with mass number 135) while the less-frequent supernovae account for the majority of the lighter r-process nuclei (mass number 135). Evidence in support for the bifurcation in r-process production was presented by Sneden et al. (2000) who showed that the abundances of CS22892-052 followed the solar r-pattern for elements heavier than barium, but were difficient for elements near Ag (A = 107).
Wasserburg & Qian (2000) argue that the presence of heavy r-process elements in ultra-metal-poor stars with low Fe abundances implies that the high-frequency supernovae can produce r-process material without the existence of a large abundance of iron. The observations of uranium in CS31082-001 provide evidence in support for their argument (Qian & Wasserburg, 2001b).
If a compact companion did form and if the binary survived the explosion, the companion’s presence should be detected from the production of X-rays from accretion processes. Sensitive X-ray observations may test for this situation.
2 Observations
We surveyed the entire data base of satellite X-ray data available through the HEASARC collection. No pointed observations from Einstein, ROSAT, ASCA, Chandra, or XMM-Newton exist within 60′ of the targets. The ROSAT All-Sky Survey111We acknowledge with thanks the support for the RASS provided by Max-Planck Institut für Extraterrestriche Astrophysik. The research discussed here would have been impossible without that support. (RASS) provides the only measurements of the X-ray flux at their locations with exposures of at most a few hundred seconds. Table 1 lists the coordinates of the three fields and the RASS field numbers obtained from the archive.
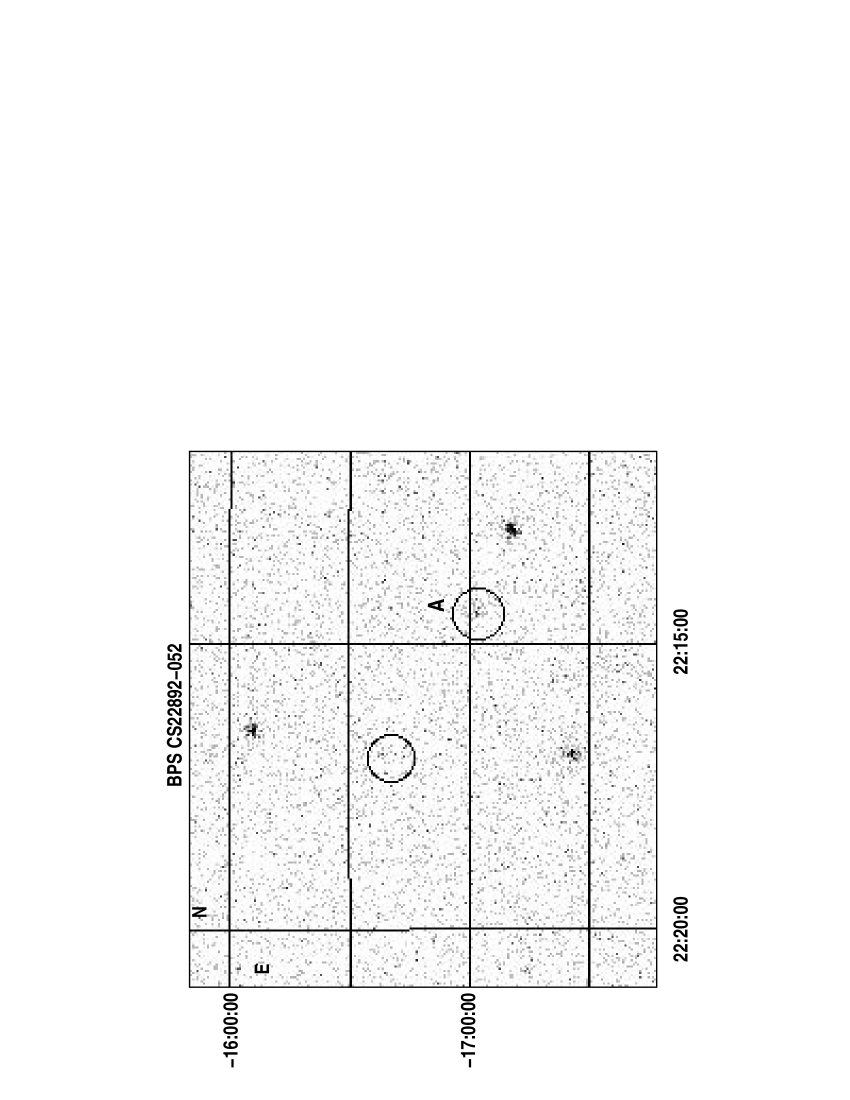
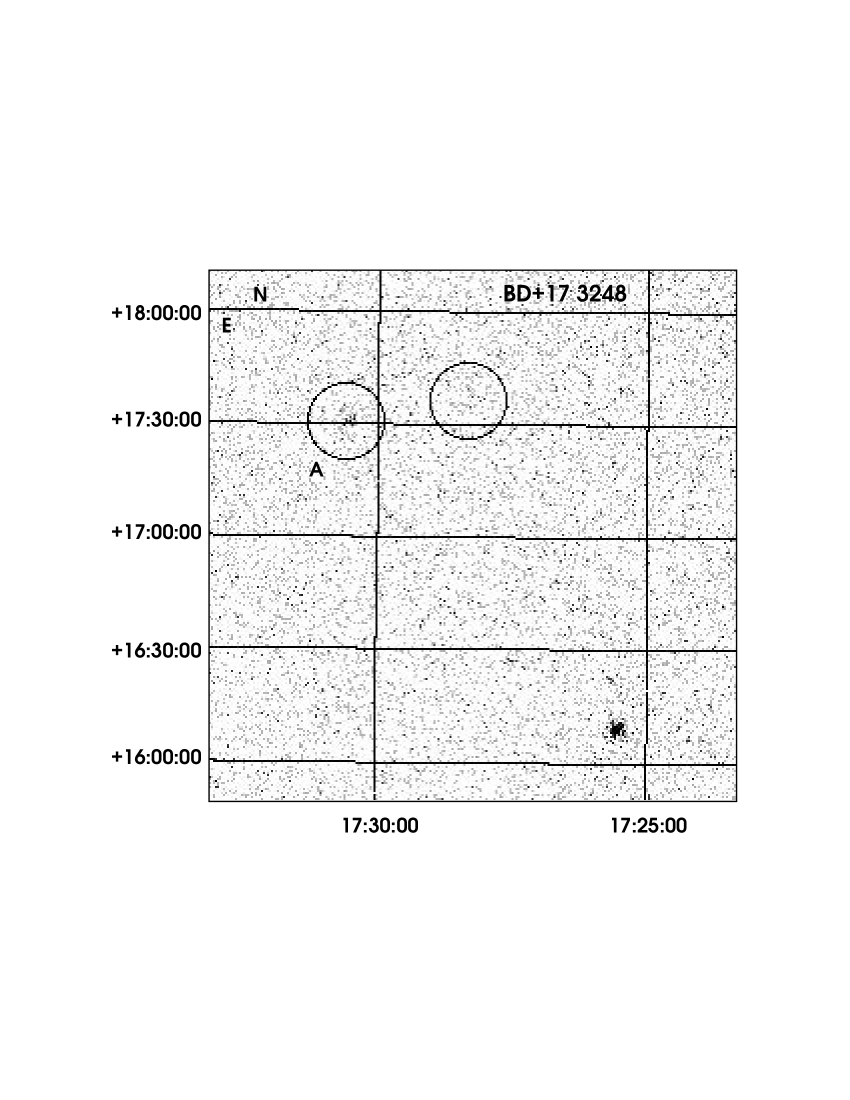
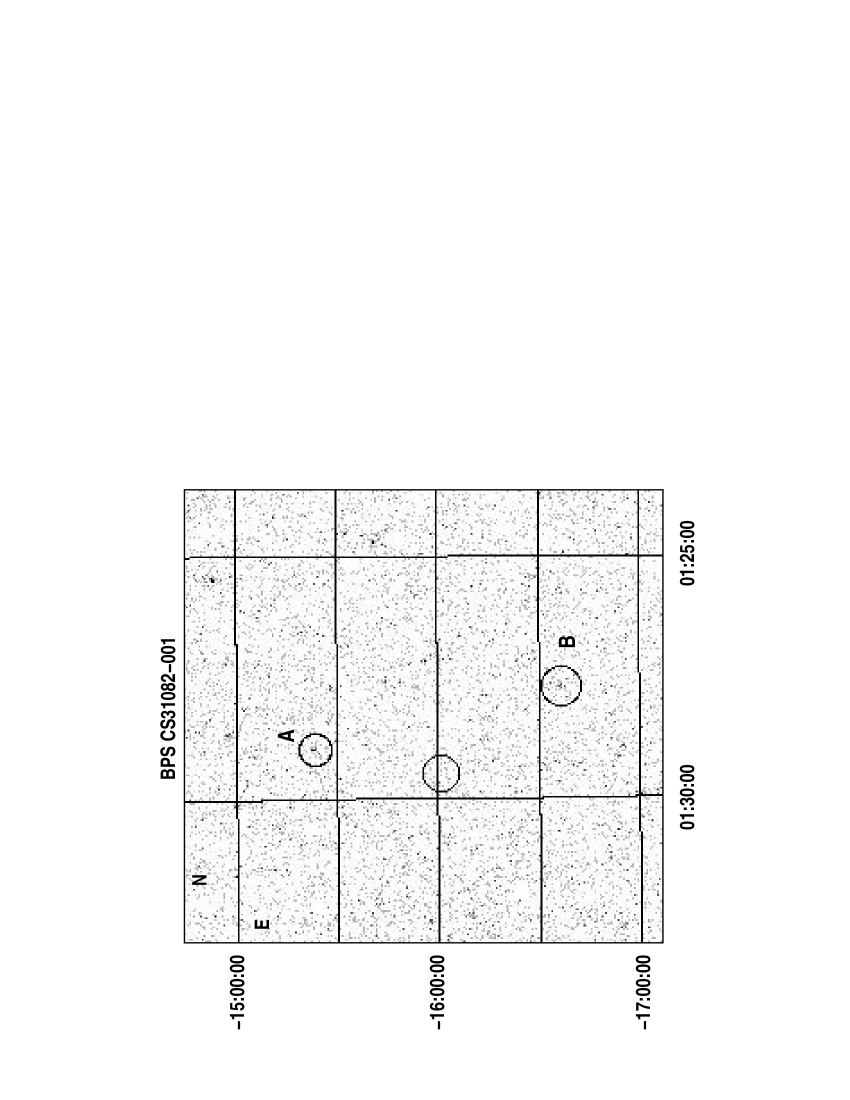
Figures 1, 2, and 3 show the RASS fields containing each target. In each field, circles surround the objects for which X-ray counts were extracted. The labelled circles correspond to the sources listed in Table 3. In Figure 2, two of the unlabelled, unextracted sources are identified as Seyfert 1 galaxies (1RXS J221632.7-160533 northernmost; 1RXS J221300.1-171019, westernmost source).
We extracted the counts at the positions of the target stars from the data using apertures 5′ in radius. The background was obtained from an annulus of outer diameter 20′. We also extracted the mean exposure time from the corresponding location in the exposure map. Table 2 lists the extracted counts. Bayesian upper limits were determined using the prescription in Loredo (1992).
The estimated distances to two target stars fall in the range of 4-6 kpc (Beers et al., 2000). For simplicity, we adopt 5 kpc. For BD+17, the distance is listed as 0.7 kpc (Beers et al., 2000). The column density in the direction of the targets is low, a few 1020 cm-2 (Table 1). Fluxes were computed from the 99% upper limits assuming a thermal spectrum of temperature 1 keV absorbed by the Galactic columns in the direction of each source. The fluxes approximately double if the adopted temperature is 5 keV.
To provide additional confidence in our upper limits, the counts of several faint point sources positionally near the uranium stars were also extracted. The positions and counts are listed in Table 3. None of the sources is an identified X-ray object based upon a search of SIMBAD222This research has made use of the SIMBAD database, operated by CDS, Strasbourg, France. SIMBAD access in the USA is provided by funding from National Aeronautics and Space Administration. or NED333This research has made use of the NASA/IPAC Extragalactic Database (NED) which is operated by the Jet Propulsion Laboratory, California Institute of Technology, under contract with the National Aeronautics and Space Administration..
3 Discussion
The ROSAT observations establish an upper limit at 1-1.5 keV of 1032-33 ergs s-1 for an assumed distance of 5 kpc. This luminosity eliminates the presence of a black hole accreting at the Eddington rate, assuming no very high local absorption, since the expected flux from a 1 M⊙ black hole would be easily detected at 5 kpc, with an estimated flux rivaling that of the Crab.
If the binary did survive the explosion and if the compact object does emit at typical Eddington values, a local high column provides an exit from the restrictive upper limit. Substantial local absorption, with column densities 1022 cm-2, significantly remove X-rays with energies below 2-2.5 keV. As the ROSAT PSPC had decreasing effective area above 2 keV, the sensitivity to hard X-rays of the survey observations is considerably poorer than the flux limit mentioned above. Figure 4 illustrates the column density-luminosity relation that yields no detection in the ROSAT bandpass.
Other compact objects may exist in the assumed binaries, regardless of whether we understand the overall evolutionary scenario. In addition, quiescent levels of some X-ray binaries in elliptical orbits (e.g., 4U0115+63) are low with a typical LX of 21032 erg s-1 (Tamura et al., 1992). Persistent X-ray binaries often have low LX, too. For example, X Per contains a neutron star, but has a total X-ray luminosity in the 2-10 keV band of 91034 erg s-1 (Schlegel et al., 1993).
With relatively high upper limits, explanations for a non-detection abound. These include the failure of the assumption that the binary survived the explosion, “off” states in wind- or Roche lobe- accreting systems, or alternative explanations to generate the r-process contaminants. A larger discussion of these issues will be presented with the expected improvement in the upper limits (see following discussion). We did search proper motion catalogs for each of the targets. Only BD+17 has a measured and published proper motion of magnitude 52 milliarcsec yr-1; the component motion in right ascension differs between Roeser & Bastian (1988) (-34 milliarcsec yr-1) and Beers et al. (2000) (-46 milliarcsec yr-1). The proper motions of the two CS stars have apparently not as yet been published.
A sensitive observation at energies above 3 keV would eliminate much of all of the local column density argument. A 10 ksec observation with the XMM-Newton EPIC detector reaches LX 2-51031 erg s-1, constraining nearly all compact binary scenarios including cataclysmic variables (magnetic CV AM Her: LX 21033 erg s-1; dwarf nova CV SS Cyg: LX 11032 erg s-1; Warner (1995)) and neutron star wind accretors (e.g., 4U1700+24, accreting from a red giant at 10-9 M⊙ yr-1, has a measured 2-10 keV luminosity of 21032 erg -1, Masetti et al. 2002).
The limit reaches the upper end of the luminosity function of RS CVn stars (Shaw, Caillault, & Schmitt, 1996; Dempsey et al., 1993) but does not eliminate active binaries such as BY Dra systems (Dempsey et al., 1997) which have LX 1028-30 erg s-1. The limit also does not reach single K supergiants which have LX few 1029 erg s-1 (e.g., Hünsch et al. 1996).
Two of the targets (CS31082 and CS22892) have been approved for Cycle 2 XMM observations, so more restrictive upper limits or detections will be available shortly.
References
- Beers et al. (2000) Beers, T. et al. 2000, AJ, 119, 2866
- Cayrel et al. (2001) Cayrel, R. et al. 2001, Nature, 409, 691
- Cowan et al. (2002) Cowan, J. J. et al. 2002, ApJ, 572, 861 (astro-ph/0202429)
- Dempsey et al. (1997) Dempsey, R. C., Linsky, J. L., Fleming, T. A., & Schmitt, J. H. M. M. 1997, ApJ, 478, 358
- Dempsey et al. (1993) Dempsey, R. C., Linsky, J. L., Fleming, T. A., & Schmitt, J. H. M. M. 1993, ApJS, 86, 599
- Freiburghaus, Rosswog, & Thielemann (1999) Freiburghaus, C., Rosswog, S., & Thielemann, F.-K. 1999, ApJ, 525, L121
- Hillebrandt, Nomoto, & Wolff (1984) Hillebrandt, W., Nomoto, K., & Wolff, R. G. 1984, A&A, 133, 175
- Hünsch et al. (1996) Hünsch, M. et al. 1996, A&A, 310, 801
- Loredo (1992) Loredo, T. J. 1992, in Statistical Challenges in Modern Astronomy, ed. E. D. Feigelson & G. J. Babu (New York: Springer-Verlag, Inc.), 275
- Masetti et al. (2002) Masetti, N. et al. 2001, A&A, 382, 104 (astro-ph/0111164)
- Meyer (2002) Meyer, B. S., 2002, PhysRevL, 89, 1101 (astro-ph/0207227)
- Meyer et al. (1992) Meyer, B. S., Mathews, G. J., Howard, W. M., Woosley, S. E, & Hoffman, R. D. 1992, ApJ, 399, 656
- Otsuki et al. (2000) Otsuki, K., Tagoshi, H., Kajino, T., & Wanajo, S. 2000, ApJ, 533, 424
- Qian & Wasserburg (2001a) Qian, Y.-Z. & Wasserburg, G. J. 2001a, ApJ, 552, L55
- Qian & Wasserburg (2001b) Qian, Y.-Z. & Wasserburg, G. J. 2001b, ApJ, 559, 925
- Qian & Wasserburg (2000) Qian, Y.-Z. & Wasserburg, G. J. 2000, Physics Reports, 333, 77
- Roeser & Bastian (1988) Roeser, S. & Bastian, U. 1988, A&ASup, 74, 449
- Ryan, Norris, & Beers (1996) Ryan, S. G., Norris, J. E., & Beers, T. C. 1996, ApJ, 471, 254
- Schlegel et al. (1993) Schlegel, Eric M. et al. 1993, ApJ, 407, 744
- Shaw, Caillault, & Schmitt (1996) Shaw, J. S., Caillaut, J.-P., & Schmitt, J. H. M. M. 1996, ApJ, 461, 951
- Sneden et al. (2000) Sneden, C. et al. 2000, ApJ, 533, L139
- Sumiyoshi et al. (2001) Sumiyoshi, K., Terasawa, M., Mathews, G. J., Kajino, T., Yamada, S. & Suzuki, H. 2001, ApJ, 562, 880
- Tamura et al. (1992) Tamura, K. et al. 1992, ApJ, 389, 676
- Terasawa et al. (2001) Terasawa, M., Sumiyoshi, K., Kajino, T., Mathews, G. J., & Tanihata, I. 2001, ApJ, 562, 470
- Warner (1995) Warner, B. 1995, Cataclysmic Variables (Cambridge: Cambridge University Press)
- Wasserburg & Qian (2000) Wasserburg, G. & Qian, Y.-Z. 2000, ApJ, 529, L21
- Wheeler, Cowan, Hillebrandt (1998) Wheeler, J.C., Cowan, J.J., & Hillebrandt, W. 1998, ApJ, 493, L101
- Woosley et al. (1994) Woosley, S. E., Wilson, J. R., Mathews, G. J., Hoffman, R. D., & Meyer, B. S. 1994, ApJ, 433, 229
- Woosley & Hoffman (1992) Woosley, S. E. & Hoffman, R. D. 1992, ApJ, 395, 202
| J2000 | ROSAT | NH | Dist | Rad. | Proper MotionbbValues for proper motion in milliarcsec yr-1. | ||||
|---|---|---|---|---|---|---|---|---|---|
| Star | RA | Dec | Fieldaaidentification number for ROSAT All-Sky Survey field | (cm-2) | [Fe/H] | (kpc) | Vel. | RA | Dec |
| BPS CS31082-001 | 01:29:31.2 | -16:00:48 | 932004 | 1.5(20) | -2.9 | ||||
| BD +17∘3248 | 17:28:14.5 | +17:30:36 | 931446 | 5.9(20) | -2.0 | 0.703 | -1461 | -46.70.8 | -24.20.7 |
| BPS CS22892-052 | 22:17:01.5 | -16:39:26 | 932059 | 2.6(20) | -3.1 | 5.7 | 1010 | ||
| 99% | ExpTime | 99% | ||||
|---|---|---|---|---|---|---|
| Star | CountsErr | Counts | (sec) | Rate | FluxaaCounts converted to an unabsorbed flux assuming the Galactic column toward the sources with a 1 keV bremsstrahlung spectrum. For a temperature of 5 keV, the fluxes are all 2 times higher. | LXbbLX calculated assuming the distance in Table 1 or 5 kpc for CS31082. |
| CS31082-001 | 2.22.4 | 6.9 | 435 | 0.016 | 1.8(-13) | 5.4(32) |
| BD+17∘ 3248 | 7.83.9 | 10.8 | 350 | 0.020 | 4.9(-13) | 9.3(31) |
| CS22892-052 | 5.83.0 | 11.2 | 277 | 0.042 | 6.0(-13) | 2.3(33) |
| J2000 | Net | ExpT | ||||
|---|---|---|---|---|---|---|
| Field | RA | Dec | CountsErr | (sec) | Rate | FluxaaCounts converted to an unabsorbed flux assuming the Galactic column toward the sources with a 1 keV bremsstrahlung spectrum. |
| CS31082-A | 01:28:59.5 | -15:23:19 | 19.24.9 | 449 | 0.0430.011 | 4.81.2(-13) |
| CS31082-B | 01:27:42.9 | -16:36:30 | 15.24.6 | 394 | 0.0380.012 | 4.31.3(-13) |
| BD+17-A | 17:30:34.9 | +17:30:54 | 30.86.2 | 570 | 0.0540.011 | 1.10.21(-12) |
| CS22892-A | 22:14:30.2 | -17:02:03 | 24.85.3 | 308 | 0.0810.017 | 1.160.24(-12) |