Calibration of the Distance Scale from Cepheids
11institutetext: Observatoire de Paris,
LESIA,
5, place Jules Janssen,
F-92195 Meudon Cedex, France
22institutetext: European Southern Observatory,
Casilla 19001,
Santiago 19, Chile
33institutetext: Astrophysikalisches Institut Potsdam,
An der Sternwarte 16,
D-14482 Potsdam, Germany
44institutetext: Astronomy Group, Departamento de Física,
Facultad de Ciencias Físicas y Matemáticas,
Universidad de Concepción, Casilla 160-C,
Concepción, Chile
Calibration of the Distance Scale from Cepheids
1 Introduction
Since the discovery by Ms. Leavitt almost a hundred years ago that Cepheid variables obey a tight relationship between their pulsation periods and absolute magnitudes, astronomers have made great efforts to calibrate this relationship, and use it to estimate the distances to nearby galaxies in which Cepheids were found. For a very nice review of the early history of the Cepheid period-luminosity (PL) relation, see Fernie (f69 ). With the course of time, the calibration of the PL relation was refined, using new methods and improving data for both Cepheids in our own Galaxy and Cepheids which were found in increasing numbers in Local Group galaxies. In particular, the Magellanic Clouds have played a fundamental role in our effort to calibrate the PL relation (and still do so today, as we will show in this review), mainly because they are just near enough to make Cepheid apparent magnitudes bright enough for accurate photometry with even small telescopes, and on the other hand distant enough to have them, in a good approximation, all at the same distance. The slope of the PL relations can thus be determined directly from a sample of LMC Cepheids in contrast to a sample of Galactic Cepheids where accurate individual distances, which are fundamentally difficult to determine, are needed. In the course of the decades, it became clear that the Cepheid PL relation is a very powerful method to determine extragalactic distances, and it was (and still is) generally considered as the most accurate and reliable stellar method to calibrate the extragalactic distance scale. For that reason, the HST Key Project on the Extragalactic Distance Scale chose the strategy to detect samples of Cepheids in a number of selected late-type galaxies and use them to measure the distances to these galaxies, which then served to calibrate other, more far-reaching methods of distance measurement to determine the Hubble constant in a region of constant Hubble flow. It is clear that we have gone a very long way from the early attempts to calibrate the PL relation, to the application of this technique to Cepheids in stellar systems as distant as 20 Mpc, as successfully done by the groups who have used the Hubble Space Telescope for this purpose.
In spite of all these successes, it has also become clear over the past decade that there are still a number of problems with the calibration of the PL relation which so far have prevented truly accurate distance determinations, to 5 percent or better, as needed for the cosmological, and many other astrophysical applications. One basic problem has been the notorious difficulty to measure accurate, independent distances to Galactic Cepheids needed for a calibration of the PL relation in our own Galaxy (see next section). The alternative approach, used many times, is to calibrate the PL relation in the LMC, but this requires an independent knowledge of the LMC distance whose determination has proven to be amazingly difficult (see the review of A.R. Walker in this volume). Another problem complicating the calibration of the PL relation is that Cepheids, as young stars, tend to lie in crowded and dusty regions in their host galaxies, making absorption corrections a critical issue. In more recent years, work on the PL relation has therefore increasingly shifted to the near-infrared where the problems with reddening are strongly reduced as compared to the optical spectral region. Another potential problem with the use of the Cepheid PL relation is its possible sensitivity to chemical abundances; if such a metallicity dependence exists and is significant, it has to be taken into account when comparing Cepheid populations in different galaxies which have different metallicities. Therefore, while there has been a lot of progress on the calibration of Cepheids as distance indicators over the years, there is still room (and need) for a substantial improvement. It is the purpose of this review to contribute such progress, and our approach is to combine Galactic and LMC Cepheids in the best possible way to derive both an improved absolute calibration of the PL relation in a number of optical and near-infrared photometric bands and, in a parallel step, derive an improved distance to the Large Magellanic Cloud from its Cepheid variables. One of the reasons why a PL calibration from Galactic Cepheid variables is of advantage as compared to a calibration based on LMC Cepheids alone is the fact that in most large spiral galaxies, and in particular in those targeted by the HST Key Project, the mean metallicities are quite close to solar, implying that metallicity-related systematic effects are minimized when comparing these extragalactic PL relations to the Galactic one, rather than to the one defined by the more metal-poor population of LMC Cepheids.
In a final step, we will test what our new Cepheid PL calibration implies for other stellar candles frequently used for distance work, such as RR Lyrae stars, red giant clump stars, and the tip of the red giant branch.
2 The Galactic vs. the LMC routes
2.1 The infrared surface brightness method
Fifteen years ago, the classical method of calibrating the PL relation for Cepheids was to use the ZAMS-fitting technique to determine the distances of a handful of open clusters which happen to contain Cepheid members (Feast & Walker fw87 ). However, Hipparcos revealed that the distance of the calibrating cluster, the Pleiades, had to be revised substantially downwards, at a level where the distance difference between Hyades and Pleiades can no longer be explained only by metallicity differences. Therefore, some doubts were shed on the ZAMS-fitting technique, and it became necessary to find alternative techniques of similar accuracy. It is a measure of our progress to see that two such methods have emerged in the meantime.
The main alternative method, based on the classical ideas of Baade and Wesselink, and first implemented by Barnes & Evans (be76 ) consists in combining linear diameter measurements, as obtained from radial velocity curve integration, to angular diameter determinations coming from measurements of magnitudes and surface brightness to derive the mean diameter and distance of a Cepheid. The surface brightness estimates come from a relation between this parameter and a suitably chosen colour.
In a comparison of the results of both methods, Gieren & Fouqué (gf93 ) established that the Barnes-Evans zero point of the PL relation in the band was 0.15 mag brighter than the ZAMS-fitting zero point. However, the Barnes-Evans method uses the colour index to estimate the surface brightness, and it was soon discovered that a much better estimate could come from infrared colours (Welch w94 ; Laney & Stobie ls95 ).
Encouraged by the very promising near-infrared results, Fouqué & Gieren (fg97 ) calibrated the infrared surface brightness technique, using both and colours, by assuming that non-variable, stable giants and supergiants follow the same surface brightness vs. colour relation as the pulsating Cepheids. Using 23 stars with measured angular diameters, mostly from Michelson interferometry, they checked that the slope of the relation directly derived from Cepheids was consistent, within very small uncertainties, with the slope derived from stable stars. This provided confidence to also adopt the zero point from the giants and supergiants. They recalibrated the Barnes-Evans relation and showed that the accuracy of the infrared method for deriving the distances and radii of individual Cepheids was 5 to 10 times better than the results produced by an application of the optical counterpart of the technique. As in the optical surface brightness technique, a very important feature and advantage of the infrared surface brightness method is its very low, and almost negligible dependence on absorption corrections.
At that time, only one Cepheid ( Gem) angular diameter had been measured, with the lunar occultation technique (Ridgway et al. r+82 ) and the agreement with our predicted angular diameter led some support to our choice of the zero point. However, that comparison suffered from the relatively large error of the Cepheid angular diameter measurement.
More recently, Nordgren et al. (n+02 ) have confirmed our calibrating surface brightness-colour relations from an enlarged sample of 57 giants with accurate interferometric measurements of their angular diameters. Interestingly, they find a similar scatter to ours in these relations, which probably means that intrinsic dispersion has been reached. Then, they used 59 direct interferometric diameter measurements for 3 Cepheids to compute their surface brightnesses, at the corresponding pulsation phases. From these measurements, they derived surface brightness-colour relations for the first time directly from the Cepheids themselves, and confirmed that the Cepheid surface brightnesses do indeed follow the calibrating relations obtained from stable giants and supergiants in the same colour range as Cepheids, yielding a zero point fully compatible with our previous value from stable stars ( vs. , respectively). Subsequently, Lane et al. (la+02 ) were able to go a step further and measure the angular diameter variations for 2 Cepheids, therefore allowing a measure of their distances and mean diameters independently of photometric measurements, but also confirming the adopted calibrating relations.
At the time of this review, three Cepheids have distance determinations based on interferometric measurements of their angular diameters. It is instructive to compare them to the distances derived from trigonometric parallaxes. This is done in Table 1. In the case of Cep, we have used the recent HST measurement by Benedict et al. (b+02 ), which supersedes the less accurate Hipparcos measurement. For Gem, the trigonometric parallax comes from Hipparcos, while for Aql we have used a weighted mean of Hipparcos and USNO measurements, as in Nordgren et al. (n+00 ). The agreement is very good, especially in the case of the accurate trigonometric measurement of Cep. Note that the small uncertainty associated with the interferometric distance determination of Cep neglects the possible systematic uncertainties introduced by the use of the surface brightness vs. colour relations.
| Cepheid | ||
|---|---|---|
| Cep | ||
| Aql | ||
| Gem |
Using the Fouqué & Gieren (fg97 ) calibration, Gieren et al. (gfg98 ) derived a new calibration of the PL relation in bands, based on 28 Galactic Cepheids with distances determined from the infrared surface brightness method. However, determining the slope of a linear relation from only 28 points is not very accurate, so they chose to fix the slopes to the better-determined values from LMC Cepheid samples, implicitly assuming that there is no metallicity dependence of the slopes, at least in the metallicity range bracketed by these two galaxies. More recently, we have revised the calibrating sample to 32 Galactic Cepheids (Storm et al. s+02 ), using a number of additional Cepheid variables not used in our previous studies, and also using fresh data from the literature whenever they had become available. The new Cepheid distance solutions from the infrared surface brightness technique are presented in Table 7. Reddenings were adopted from Fernie’s database (f+95 , column labelled FE1). In Fig. 1, we show one such solution for the Cepheid X Cyg which is fairly representative for our whole, updated sample of Galactic Cepheid variables. Our new Galactic Cepheid distance data confirm that the Galactic slopes of the PL relation are steeper than their LMC counterparts, in all photometric bands, as can be seen in Table 2. The corresponding Galactic Cepheid PL relations are shown in Fig. 2.
| Band | Galactic slopes (N) | LMC slopes | ||
|---|---|---|---|---|
| literature (N) | revised (N) | E(B-V)=0.10 | ||
| (32) | ||||
| (32) | (651) | (644) | ||
| (32) | (661) | (644) | ||
| (32) | (668) | (644) | ||
| (32) | (490) | (447) | ||
| (32) | (493) | (447) | ||
| (32) | (472) | (447) | ||


However, there are systematic differences in the way the slopes given in Table 2 have been determined. For instance, the reddening corrections do not follow exactly the same law in Gieren et al. (gfg98 ) and in the work of the OGLE team (hereafter OGLE2), and Groenewegen (g00 ). Even the definition of the reddening-free parameter varies in the literature. In order to make things fully comparable, we have derived new LMC Cepheid PL relations in the optical () from the published OGLE2 database, and in the infrared () from the sample kindly provided by M. Groenewegen, adopting the same reddening law as for our Galactic calibrators. For this, we have computed the values of the various coefficients , , , , , for each calibrator according to the following formulae (from Laney & Stobie ls93 and Caldwell & Coulson cc87 ):
| (1) | |||||
| (2) | |||||
| (3) | |||||
| (4) | |||||
| (5) | |||||
| (6) |
defines the Wesenheit magnitude as:
| (7) |
Then, we have computed the mean value of these coefficients over our 32 Galactic calibrators, assumed to be representative for the entire Galactic Cepheid population. As the rms dispersions turned out to be small (from 0.003 in to 0.036 in ), we decided to adopt the same constant values for all the Cepheids. These are:
| (8) | |||||
| (9) | |||||
| (10) | |||||
| (11) | |||||
| (12) | |||||
| (13) |
Another possible systematic effect on PL slopes can arise from differences in the period ranges covered by the LMC and Galactic Cepheid samples. In , it ranges from 0.1 to 1.5 for the LMC (median 0.59), versus 0.6 to 1.6 for the Milky Way (median 1.16). However, cutting the LMC sample at 0.6 removes more than half of the OGLE2 sample. We therefore adopted the cut at , as done by the OGLE2 team. We also removed a few stars which were rejected in our linear fits to finally adopt a common sample of 644 stars for , and , and 447 stars with 2MASS random-phase magnitudes in , and . The slopes of the corresponding PL relations derived from these samples are given in Table 2 and the LMC PL relations are shown in Fig. 3.


Finally, we tested for the possibility that the different PL slopes seen in the LMC and Galactic Cepheid samples could actually be an artifact of our method of distance determination. The most obvious source which could produce a significant effect on the PL slope of our Galactic sample is an error in the adopted value of the p-factor used to convert the Cepheid radial velocity into pulsational velocity. With a variation of the p-factor within any reasonable limits, however, it is clearly impossible to recover the slopes, in the different bands, seen in the LMC Cepheid sample. We also tried to eliminate the most uncertain distances in our Galactic sample, which happen when there is an apparent phase shift between the angular and linear diameter variations in our solutions. Such phase shifts are seen in about one third of our Galactic Cepheids (always smaller than 5 percent) and are most likely due to a slight phase mismatch between the radial velocity curve and the photometric curves used in the analyses, which were not obtained simultaneously (see a detailed discussion of this in Gieren et al. (gfg97 )). Eliminating those potentially ”problematic” stars did not change significantly the derived Galactic slopes. Our adopted distances are based on a bisector linear least-squares fit of the angular diameters vs. linear displacements at each phase. We also tested the effect of adopting the inverse fit (all errors assumed to be carried by the angular diameters) instead of the bisector fit, as recommmended in Gieren et al. (gfg97 ), without producing noticeable differences. As a result from these different exercises carried out on the data, we conclude that our adopted distances are very robust against these kinds of subtleties.
We therefore adopted two sets of zero points: the first one assumes our Galactic slopes and the second one assumes the revised LMC slopes. Results are given in Table 3.
| Band | ||
|---|---|---|
It appears that the choice of slope only very slightly affects the adopted zero points. This justifies to force the more accurately determined LMC slopes to our 32 Galactic calibrators, and allows a determination of the LMC distance in each band. The results are given in Table 4.
| Band | LMC intercept at 10 days | |
|---|---|---|
The values in Table 4 show that the distance moduli increase when the reddening sensitivity of the band decreases. This is an annoying result, which we did not see in our 1998 paper (Gieren et al. gfg98 ). The main difference is that we then used a reduced sample of about 60 LMC Cepheids (OGLE results were not available yet), among which about one half had individual reddening measurements, which yielded a mean value of , to be compared to the OGLE2 mean value for Cepheids of 0.147.
We therefore tested the effect of replacing the individual OGLE2 reddenings (which are constant within each of the 84 OGLE2 sub-fields, but slightly varying from field to field) by a mean value of , as done by the HST Key Project on the Extragalactic Distance Scale (HST-KP) team. Obviously the zero points of the corresponding PL relations are modified by this change, and when combined to the Galactic zero points derived by forcing the new LMC slopes given in last column of Table 2 to the Galactic data, we get the LMC distance moduli shown in Table 5. It is clear that the agreement among the different bands is now much better and, in fact, quite satisfactory.
| Band | LMC intercept at 10 days | |
|---|---|---|
We note that the HST-KP for determination is not fully consistent in that sense, because they use the OGLE2 PL relations, but assume at the same time a mean LMC reddening of . If we use our new LMC PL relations with (last column of Table 2) and assume a LMC distance modulus of 18.50 as they did, the resulting zero points are changed and appear in Table 6. It is seen that this introduces a significant difference in the Cepheid absolute magnitudes in the and bands, at a Cepheid period of 10 days.
To circumvent, or minimize the reddening problem, we prefer to exclude the and band results from our final determination of the distance modulus to the LMC. In fact, the value already combines the information from and bands in the best possible way. We therefore take a weighted mean of the value on one side and the infrared weighted average of , , on the other side, which gives for OGLE2 reddenings and for a constant . This gives a greater weight to which is truly reddening free, and a lower one to the infrared values which are derived only from random-phase magnitudes. The uncertainty of the mean comes from the weighted rms dispersion of the values from all the bands.
From this procedure we find, as our best adopted value, a LMC distance modulus of . The uncertainty does not include the systematic uncertainty arising if the LMC and Galactic slopes are really different. In that case, the derived offset depends on the adopted period for the zero-point. If we measure the offset at the median value of the LMC sample () in place of , the derived modulus becomes 18.41. We are indebted to Frédéric Pont for this remark.
2.2 The Hipparcos parallaxes method
It has been common-place in the past years to present the Galactic calibration based on Hipparcos parallaxes (h97 ) of about 200 Cepheids as discrepant from other calibrations. This probably arose from the large distance of the LMC published in the original work of Feast & Catchpole (fc97 ), . However, we will see that the Hipparcos calibration is not discrepant at all, and that the problem arises in the application of the Hipparcos calibration to the determination of the LMC distance.
The outstanding idea of Feast & Catchpole (fc97 ) to combine the very uncertain, but also very numerous, parallax measurements of Cepheids by Hipparcos to derive a PL relation zero point for Cepheids has been shown to be free of biases by subsequent studies (Pont p99 , Lanoix et al. l+99 , Groenewegen & Oudmaijer go00 ). The last of these studies is probably the most accurate one, and generalizes the result to different photometric bands. We will adopt their zero points as the Hipparcos Galactic calibration, based on 236 Cepheids (median ). For details about the method, the reader is referred to the above references.
For a 10-day period Cepheid, these zero points are given in Table 6 and compared to our zero points and to the adopted zero points of the HST-KP for determination (Freedman et al. f+01 , Macri et al. m+01 , based on the original OGLE2 LMC relations and on new infrared PL relations, assuming a LMC distance modulus of 18.50). Please note that the values of the slopes and the definitions of adopted to derive these zero points vary among these works. For comparison, the original Feast & Catchpole (fc97 ) band zero point was . Table 6 also gives the HST-KP zero points derived adopting the new OGLE2 LMC relations based on a mean reddening of .
| Band | ||||
|---|---|---|---|---|
| literature | ||||
We must be cautious with the conclusions to be drawn from Table 6: there is an apparently good agreement between the Hipparcos and the original HST-KP zero points on one hand, and between the ISB Galactic and the revised HST-KP zero points on the other hand. How is this to be interpreted?
First of all, if the Hipparcos and the original HST-KP zero points agree, why do they lead to different distance moduli for the LMC? Simply because the adopted LMC PL relations have different intercepts: Feast & Catchpole (fc97 ) adopted a LMC PL relation in from Caldwell & Laney (cl91 ) based on 88 Cepheids with an intercept of , and based on a mean adopted reddening of (30 have individual reddenings), while Freedman et al. (f+01 ) used the originally published OGLE2 PL relations based on more than 600 Cepheids with an intercept of and a mean reddening of 0.147. The observed difference of 0.14 mag in intercepts is well explained by the difference in adopted mean reddenings () and is sufficient to make the distance moduli discrepant. Please note that Feast & Catchpole (fc97 ) also added a metallicity correction of 0.04 mag, even increasing the discrepancy.
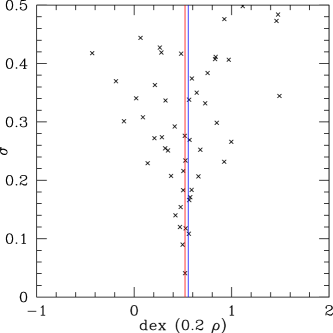
In fact, the low accuracy of the Hipparcos zero points makes the observed difference between the Hipparcos and the ISB zero points not significant, as can be seen in Fig. 4 which displays, for the Cepheids with the highest weights, the value of the zero point estimate vs. its uncertainty, together with the positions of the adopted Hipparcos and the ISB zero points. In the band, the zero point difference is smaller, and clearly not significant if we consider the alternative value published by Lanoix et al. (l+99 ), which is . Finally, there is a good agreement in - and -band zero points, but this is probably quite fortuitous for the same reasons.
Now, the excellent agreement between the revised HST-KP and the Galactic ISB Cepheid absolute magnitudes at a 10-day period is clearly more significant thanks to the high accuracy of both results. This basically demonstrates that the HST-KP adopted LMC distance modulus of 18.50 is very nearly correct.
2.3 The ZAMS-fitting calibration
Feast (f199 ) published a revised list of 31 Galactic Cepheids belonging to open clusters or associations with distance moduli derived through the ZAMS-fitting technique. He also explained why the values may not be modified by the Pleiades distance change after the Hipparcos measurement (simultaneous change of the reference ZAMS of the same order of magnitude). In fact, his cluster distance values are very close to those published in Gieren & Fouqué (gf93 ).
Twenty-four of these cluster Cepheids lie in the same period range of our Galactic calibrators of the ISB technique. We have derived PL relations from these Cepheids, which are given below, and appear to be in good agreement with those derived from the ISB distances, although they are less accurate. They support the evidence that the Galactic PL slopes are somewhat steeper than the LMC ones.
| (14) | |||||
| (15) | |||||
| (16) | |||||
| (17) |
Very recently, Turner & Burke (tb02 ) published a revised list of 46 Cepheids belonging to clusters or associations. Fifteen of these Cepheids have ISB distances in our current sample. The weighted mean of the distance moduli differences we find is not significant and amounts to:
| (18) |
after rejection of AQ Pup ( difference - we note that cluster membership of this star seems to be very uncertain). Other large differences are observed for Cep (), BB Sgr (), and U Car (). Excluding these stars, for which the case of membership in their respective clusters/associations is not strong (see original references cited in the paper of Turner & Burke), the rms dispersion is 0.10, corresponding to 3% distance precision for each set.
From this comparison, we conclude that the Cepheid distance scale based on ZAMS-fitting is consistent with the calibration from the ISB method. This may be a bit surprising given the many difficulties in the application of the ZAMS-fitting method, and the doubts shed on the method after Hipparcos.
3 What may still be wrong in the LMC distance?
3.1 Reddening effects
We have seen previously how changing the adopted reddening may change our results. By reddening we mean both the reddening values and the reddening law. There is good evidence in the literature that the LMC reddening law may differ from the Galactic one shortward of (see, e.g., Gochermann & Schmidt-Kaler gs02 ). However, this is of little concern for us. What is more important is that there is some evidence that the value may be lower in the LMC. For instance, Misselt et al. (m+99 ) find values varying between 2.16 and 3.31, and obtain a good fit using the standard Cardelli et al. (c+89 ) reddening law for a mean value of . Similar, but slightly higher values (between 2.66 and 3.60) have been found in the SMC by Gordon & Clayton (gc98 ). So, what we interpret as a smaller mean LMC reddening than the OGLE2 values may in fact be due to a lower value.
Concerning the reddening values, several studies have investigated both the foreground reddening due to our Galaxy (the LMC is at galactic latitude), and the internal reddening. They show that the reddening is patchy, with large variations from a line of sight to another.
Concerning the foreground reddening, Schwering & Israel (si91 ) find from 48’ resolution maps a range of 0.06 to 0.17 in , with an average value of 0.10. By comparison, the foreground reddening in front of the SMC is found more homogeneous, only varying from 0.06 to 0.08. In the LMC, Oestreicher et al. (o+95 ) with a better resolution of 10’ also find a large range from 0 to 0.15, with an average value of .
Concerning the internal reddening, Oestreicher & Schmidt-Kaler (os96 ) find a range of 0.06 to 0.29, with a mean , while Harris et al. (h+97 ) find a total average extinction of 0.20, from which they conclude that the mean internal reddening amounts to mag.
In comparison, Udalski et al. (u+99 ) use the mean magnitude of the Red Giant Clump (RGC) to derive the total reddening variations along the 21 LMC OGLE2 fields (mainly along the bar). They divide each field into 4 sub-fields and give a mean reddening along each of the 84 lines of sight, corresponding to a resolution of 14.2’. The zero point of their reddening scale is given by three photometric measurements from the literature. They find a range of total extinction between 0.105 and 0.201, with a mean value over the fields of 0.137, and a mean Cepheid value of .
However, Girardi & Salaris (gs01 ) have shown that the RGC mean absolute magnitude depends on population effects (age and metallicity). This implies that the OGLE2 method is only valid as long as it can be assumed that the population characteristics do not change along the LMC bar.
In any case, Beaulieu et al. (b+01 ) have shown that the resolution of the OGLE2 maps is not sufficient to consider their reddenings as individual values for each Cepheid, since the PL residuals in and correlate along the reddening line in the case of LMC, as can be seen from Fig. 5, reproduced from their paper.

It is therefore tempting to use OGLE2 measurements to derive individual reddenings, following the Dean et al. (d+78 ) precepts, adapted to the LMC metallicity as in Caldwell & Coulson (cc85 ). Such measurements exist for 329 Cepheids, which is about one half of the calibrating sample. Unfortunately, the result is disappointing, because when we apply the derived individual reddenings to correct the mean and magnitudes, the dispersions of the PL relations increase.
Finally, some authors use period-colour (PC) relations to estimate the reddenings. This is the case for instance in the various works based on Hipparcos parallaxes. However, it is well known that the PC relations have considerable intrinsic dispersion, but as shown by Feast & Catchpole (fc97 ), these over- or under-estimated reddenings compensate in part for the intrinsic width of the PL relations. But, as the Cepheid colours vary with metallicity at a given period (see below), it is important to use a PC relation adapted to the sample under study. Only 7 Hipparcos Cepheids do not have reddenings measurements in Fernie’s database (f+95 ). We have therefore checked that using these individual reddenings in place of those derived from a PC relation indeed gives a similar result for the Galactic zero point in .
As a summary from this discussion, it is clear that the reddening problem is still far from being overcome, but we believe that our current adopted procedures do minimize the influence of reddening on the LMC distance modulus derived in the previous section. Once more, the merits of using infrared bands or reddening insensitive parameters such as are underlined.
3.2 Metallicity effects
Theoretical point of view
There is a long debate in the literature on the effect metallicity may have on the PL relations in different photometric bands, both on the theoretical and observational sides. From an observer’s point of view, it seems that one can always find a theory which agrees with the metallicity dependence one finds by observational tests. However, not all the theories rest on the same basis. It is well known that purely radiative stellar pulsation models predict too large pulsation amplitudes for Cepheids. Some convective transport must be added, for instance by means of the Mixing Length Theory (MLT). However, time-independent MLT cannot predict the position of the red edge of the instability strip, which needs the additional introduction of a time-dependent dissipation introduced by the eddy viscosity. But time-dependent MLT models are not successful if they are too local in space. We therefore need at least a non-local time-dependent hydrodynamic pulsation code to correctly describe the coupling of pulsation and convection.
There are not so many codes available. Some linearize the equations (Yecko et al. y+98 ) while others solve the full non-linear equations (Bono & Stellingwerf bs94 , Feuchtinger f299 )). It seems that their results concerning metallicity dependences basically agree. The fact that they disagree with predictions of models based on purely radiative pulsation codes which neglect the coupling of pulsation with convection (Saio & Gautschy sg98 , Alibert et al. a+99 ) seems to us an effect of these simplifications. We will therefore basically follow the predictions of the full-amplitude (non-linear) models including a non-local and time-dependent treatment of stellar convection from Bono et al. (b1+99 ). But we are aware that these models depend on a number of not well constrained parameters, the adopted values of which may change the predictions to a significant level (see Figs. 12 and 13 in Yecko et al. y+98 ).
These models first predict that at a given metallicity (Y and Z fixed), the width of the instability strip changes from low- to high-mass Cepheids, therefore invalidating older model predictions, which assumed that the red edge was parallel to the blue edge. Now, for a given Cepheid mass (and therefore luminosity), an increase in Z (and Y) shifts the instability strip towards cooler effective temperatures, due to a decrease in the pulsation destabilization caused by the hydrogen ionization region; therefore, at a fixed period and assuming a uniformly populated instability strip, metal-poor pulsators are more luminous than metal-rich ones.
However, this prediction for bolometric magnitudes does not necessarily apply to all photometric bands, and differences in the adopted atmosphere models may generate differences in the magnitude of the effect for a given band. Bono et al. (b2+99 ) find that the dependence on metallicity is increased in the band, due to the dependence of the bolometric correction on effective temperature, while it is smaller in the band. But the effect is still that metal-poor pulsators are more luminous than metal-rich ones, when absolute magnitudes are derived from a PL relation. However, metallicity also affects colours, and an increase in Z at fixed period gives redder and colours. When using a PLC relation to derive the absolute magnitudes, both effects must be taken into account, and at fixed period and colour, metal-poor pulsators are still slightly more luminous in but less luminous in than metal-rich ones.
This theoretical model also predicts that the slopes of the PL relation vary with metallicity, in the sense that an increase in Z produces shallower slopes in the and bands, the effect being smaller in . We observe the opposite effect. Also, the slopes of the PC relations ( and ) are predicted to steepen when Z increases.
Observational point of view
On the observational side, let us start with differential studies. By this, we mean studies in different regions of a given galaxy showing a spatial variation in metallicity, to assess magnitude differences, at a given period, due to the variation of metallicity. The pioneering work of Freedman & Madore (fm90 ) compared Cepheids in three fields of M 31 at different galactocentric distances; it led to unconclusive results, varying from no significant metallicity effect according to the original authors to large effects according to Gould’s re-analysis (g94 ). A more accurate study was conducted in M 101 by Kennicutt et al. (k+98 ) who compared the derived distance moduli for 2 fields, located at different radial distances from the center of the galaxy having a difference of 0.7 dex in nebular [O/H]. They found some effect in the sense that distances to metal-rich galaxies are underestimated when derived by using the LMC Cepheid PL relation, but the share of effect between and bands is not specified.
In the same spirit, we have observed the Sculptor Group spiral NGC 300 in , and and discovered about 120 Cepheids, well distributed all over the galaxy (Pietrzyński et al. p+02 ). By measuring the stellar metallicity in different regions from B and A supergiants spectra, we plan to measure any differential effect due to metallicity. This work is in progress, and we believe that this will provide the as yet most stringent observational test on the metallicity sensitivity of the Cepheid PL relation. We have also observed outer disc Cepheids of our own galaxy (Pont et al. p+01 ), with the hope that the metallicity difference to the solar region would mimic the metallicity difference to the LMC. It appears, however, that the metallicity range only reaches the typical LMC metallicity ([Fe/H] ) at about 14 kpc, where very few Cepheids are known (Luck et al. lu+03 ). This makes evidencing metallicity effects in our own galaxy a difficult task. The task could seem easier when comparing Galactic to SMC Cepheids, as recently shown by Storm et al. (s+02 ), but here again disentangling metallicity effects from uncertain reddenings for SMC stars, depth and ridge line effects for such a small sample (5 stars) is quite a challenge.
Another approach was pioneered by Beaulieu et al. (b+97 ) and Sasselov et al. (s+97 ) in the Magellanic Clouds for and bands, and generalized by Kochanek (k97 ) to 17 galaxies in bands. From an analysis of 481 Cepheids detected by the EROS microlensing experiment in the LMC and SMC, and assuming that the slopes of the PL relations do not depend on metallicity, Beaulieu and Sasselov found that an SMC Cepheid is less luminous than a LMC Cepheid of same period by 0.06 mag in the blue EROS band (intermediate between Johnson and ) but more luminous by 0.01 mag in the red EROS band (intermediate between Cousins and ). The net effect is to overestimate the SMC distance modulus by 0.14 mag. Kochanek finds that metal-poor pulsators are more luminous than metal-rich ones in and , but less luminous in , with the difference increasing with the wavelength. These studies then translate the metallicity dependence into a distance modulus variation per dex of [Fe/H], but nothing proves so far that such a dependence is linear.
Finally, Udalski et al. (u+01 presented recently an analysis of PL relations in IC 1613, a galaxy of even lower metallicity than the SMC ([Fe/H] ), and showed that the slopes of the and relations were not significantly different from those found in the LMC, giving a strong observational hint that the slopes do not depend on metallicity, at least in the range to in [Fe/H]. They also argue that the zero points do not depend on metallicity, but this relies on comparison with other distance indicators which themselves depend upon metallicity, so this result currently lies on less stable grounds.
From all these theoretical and observational results on the metallicity effect on Cepheid absolute magnitudes currently available, it is our impression that if a metallicity dependence of the PL relations exists, it should be small, its sign is currently not well defined and may depend on the photometric band, and it may not be a linear function of [Fe/H].
4 Consequence for other distance indicators
At the time of this writing, no distance indicator can claim to be so accurate that other distance indicators become unnecessary. All distance indicators suffer, to some extent, from systematic uncertainties and the best way to constrain the Extragalactic Distance Scale seems to compare the results of various distance indicators for which previous work has shown that they provide relatively accurate measures of distances.
It is not the purpose of this review to compare in detail the calibrations of all the most promising distance indicators. Other review papers in this book deal with them. We just want to find out what our preferred Cepheid PL relation derived in this paper predicts for several other of the most common distance indicators.
For this purpose, we only need to know the difference in magnitude between a Cepheid of 10-day pulsation period and the following other distance indicators: Tip of the Red Giant Branch magnitude (TRGB), Red Giant Clump mean magnitude (RGC), and RR Lyrae magnitude. We adopt the following values of differences from Udalski (u00 ), based on several nearby galaxies and his adopted corrections for different metallicities:
| (19) | |||||
| (20) | |||||
| (21) | |||||
| (22) |
From these differences and the Galactic ISB zero points from Table 3, it is easy to predict expected values for other distance indicators. Our current Cepheid calibration corresponds to:
| (23) | |||||
| (24) | |||||
| (25) |
We leave to others the discussion of the importance of population effects on these differences to determine which precise value should be applied in any case, and the comparison of our predicted values to the range of published values in the literature. We just want to note the very good agreement with the RR Lyrae mean magnitude presented at this conference by C. Cacciari and G. Clementini, namely at , which corresponds to at .
5 Conclusions
We have used the infrared surface brightness technique to obtain a new absolute calibration of the Cepheid PL relation in optical and near-infrared bands from improved data on Galactic stars. The infrared surface brightness distances to the Galactic variables are consistent with direct interferometric Cepheid distance measurements, and with the PL calibration coming from Hipparcos parallaxes of nearby Cepheids, but are more accurate than these determinations. We find that in all bands, the Galactic Cepheid PL relation appears to be slightly, but significantly steeper than the corresponding relation defined by the LMC Cepheids. This systematic difference has recently been confirmed by Tammann et al. (t+03 ) and could be a signature of a metallicity effect on the slope of the PL relation. Since the slope of our LMC Cepheid sample is clearly better defined than the one of the much smaller Galactic sample, we fit the LMC slopes to our Galactic calibrating Cepheid sample (which introduces only a small uncertainty) to obtain our final, adopted and improved absolute calibrations of the Cepheid PL relations in the bands. Comparing the absolute magnitudes of 10-day period Cepheids in both galaxies which are only slightly affected by the different Galactic and LMC slopes of the PL relation, we derive values for the LMC distance modulus in all these bands which can be made to agree extremely well under reasonable assumptions for both, the reddening law, and the adopted reddenings of the LMC Cepheids. However, reddening remains an important and not satisfactorily resolved issue, and in order to obtain a LMC distance determination as independent of reddening as possible, we adopt as our final result a weighted mean of the values coming from the reddening-insensitive Wesenheit magnitude, and those derived from the near-infrared bands. This yields, as our current best estimate from Cepheid variables, a LMC distance modulus of .
A discussion of the effect of metallicity on Cepheid absolute magnitudes as provided by both, existing empirical and theoretical evidence makes us conclude that at the present time, it seems likely that there is some metallicity dependence of the PL relation, of small size, whose sign is not clear, and whose size may depend on the photometric band. It may also be a non-linear function of metallicity, with some indication that the metallicity effect on the Cepheid PL relation does not change basically between very low and LMC metallicities, but that the slope of the metallicity dependence may steepen when going from LMC to solar abundances. Clearly, more work from both theory and, particularly, from the observational side has to be done to improve the constraints on the metallicity effect. Until this is achieved, it may be the best choice to use our current, Galactic calibration in applications to the distance measurement of Cepheids in solar metallicity galaxies. Thanks to its accuracy provided by the infrared surface brightness technique, the Galactic calibration is now a true alternative to using the LMC calibration, with the added benefit of minimizing metallicity-related effects when studying Cepheid samples in metal-rich spiral galaxies.
6 Acknowledgements
The authors are indebted to Jean-Philippe Beaulieu for comments on the validity of theoretical predictions concerning the metallicity effects on the PL relations and for authorizing us to reproduce Figure 5. Giuseppe Bono also helped us to better understand the current differences among theories.
Some calculations would not have been possible without Martin Groenewegen’s kindness, who sent his list of magnitudes for OGLE2 Cepheids and basic data for Hipparcos-observed Cepheids.
Comments and corrections from Frédéric Pont and Daniel Cordier are very gratefully acknowledged, as well as valuable inputs from Sergei Andrievsky, David Bersier, Pierre Kervella, Francesco Kienzle, Lucas Macri, Barbara Mochejska, Georges Paturel, Eric Persson, and Grzegorz Pietrzyński.
WG gratefully acknowledges financial support for this work from the Chilean Center for Astrophysics FONDAP 15010003.
| ID | |||||||||||||
|---|---|---|---|---|---|---|---|---|---|---|---|---|---|
| BF Oph | 0.609329 | 9.271 | 0.034 | 32.0 | 0.5 | 0.247 | |||||||
| T Vel | 0.666501 | 9.802 | 0.060 | 33.6 | 0.9 | 0.281 | |||||||
| Cep | 0.729678 | 7.084 | 0.044 | 42.0 | 0.9 | 0.092 | |||||||
| CV Mon | 0.730685 | 10.988 | 0.034 | 40.3 | 0.6 | 0.714 | |||||||
| V Cen | 0.739882 | 9.175 | 0.063 | 42.0 | 1.2 | 0.289 | |||||||
| BB Sgr | 0.821971 | 9.519 | 0.028 | 49.8 | 0.6 | 0.284 | |||||||
| U Sgr | 0.828997 | 8.871 | 0.022 | 48.4 | 0.5 | 0.403 | |||||||
| Aql | 0.855930 | 6.986 | 0.052 | 48.1 | 1.1 | 0.149 | |||||||
| S Nor | 0.989194 | 9.908 | 0.032 | 70.7 | 1.0 | 0.189 | |||||||
| Z Lac | 1.036854 | 11.637 | 0.055 | 77.8 | 2.0 | 0.404 | |||||||
| XX Cen | 1.039548 | 11.116 | 0.023 | 69.5 | 0.7 | 0.260 | |||||||
| V340 Nor | 1.052579 | 11.145 | 0.185 | 67.1 | 5.7 | 0.315 | |||||||
| UU Mus | 1.065819 | 12.589 | 0.084 | 74.0 | 2.9 | 0.413 | |||||||
| U Nor | 1.101875 | 10.716 | 0.060 | 76.3 | 2.1 | 0.892 | |||||||
| BN Pup | 1.135867 | 12.950 | 0.050 | 83.2 | 1.9 | 0.438 | |||||||
| LS Pup | 1.150646 | 13.556 | 0.056 | 90.2 | 2.3 | 0.478 | |||||||
| VW Cen | 1.177138 | 12.803 | 0.039 | 86.6 | 1.5 | 0.448 | |||||||
| X Cyg | 1.214482 | 10.421 | 0.016 | 105.3 | 0.8 | 0.288 | |||||||
| VY Car | 1.276818 | 11.501 | 0.022 | 112.9 | 1.1 | 0.243 | |||||||
| RY Sco | 1.307927 | 10.516 | 0.034 | 100.0 | 1.5 | 0.777 | |||||||
| RZ Vel | 1.309564 | 11.020 | 0.029 | 114.7 | 1.5 | 0.335 | |||||||
| WZ Sgr | 1.339443 | 11.287 | 0.047 | 121.8 | 2.6 | 0.467 | |||||||
| WZ Car | 1.361977 | 12.918 | 0.066 | 112.0 | 3.4 | 0.384 | |||||||
| VZ Pup | 1.364945 | 13.083 | 0.057 | 97.1 | 2.5 | 0.471 | |||||||
| SW Vel | 1.370016 | 11.998 | 0.025 | 117.5 | 1.4 | 0.349 | |||||||
| T Mon | 1.431915 | 10.777 | 0.053 | 146.3 | 3.6 | 0.209 | |||||||
| RY Vel | 1.449158 | 12.019 | 0.032 | 139.9 | 2.1 | 0.562 | |||||||
| AQ Pup | 1.478624 | 12.522 | 0.045 | 147.9 | 3.1 | 0.512 | |||||||
| KN Cen | 1.531857 | 13.124 | 0.045 | 185.8 | 3.9 | 0.926 | |||||||
| l Car | 1.550855 | 8.989 | 0.032 | 201.7 | 3.0 | 0.170 | |||||||
| U Car | 1.589083 | 10.972 | 0.032 | 161.5 | 2.4 | 0.283 | |||||||
| RS Pup | 1.617420 | 11.622 | 0.076 | 214.7 | 7.5 | 0.446 |
References
- (1) Y. Alibert, I. Baraffe, P. Hauschildt, F. Allard: A&A 344, 551 (1999)
- (2) T.G. Barnes, D.S. Evans: MNRAS 174, 489 (1976)
- (3) J.-P. Beaulieu, D.D. Sasselov, C. Renault, P. Grison, R. Ferlet, A. Vidal-Madjar, E. Maurice, L. Prévot, E. Aubourg, P. Bareyre, S. Brehin, C. Coutures, N. Delabrouille, J. de Kat, M. Gros, B. Laurent, M. Lachièze-Rey, E. Lesquoy, C. Magneville, A. Milsztajn, L. Moscoso, F. Queinnec, J. Rich, M. Spiro, L. Vigroux, S. Zylberajch, R. Ansari, F. Cavalier, M. Moniez, C. Gry, J. Guibert, O. Moreau, F. Tajhmady: A&A 318, L47 (1997)
- (4) J.-P. Beaulieu, J.R. Buchler, Z. Kolláth: A&A 373, 164 (2001)
- (5) G.F. Benedict, B.E. McArthur, L.W. Fredrick, T.E. Harrison, C.L. Slesnick, J. Rhee, R.J. Patterson, M.F. Skrutskie, O.G. Franz, L.H. Wasserman, W.H. Jefferys, E. Nelan, W. van Altena, P.J. Shelus, P.D. Hemenway, R.L. Duncombe, D. Story, A.L. Whipple, A.J. Bradley: AJ 124, 1695
- (6) G. Bono, R.F. Stellingwerf: ApJS 93, 233 (1994)
- (7) G. Bono, M. Marconi, R.F. Stellingwerf: ApJS 122, 167 (1999)
- (8) G. Bono, F. Caputo, V. Castellani, M. Marconi: ApJ 512, 711 (1999)
- (9) J.A.R. Caldwell, I.M. Coulson: MNRAS 212, 879 (1985) and erratum in MNRAS 214, 639 (1985)
- (10) J.A.R. Caldwell, I.M. Coulson: AJ 93, 1090 (1987)
- (11) J.A.R. Caldwell, C.D. Laney: ‘The Magellanic Clouds’. In: IAU Symp. 148, ed. by R. Haynes, D. Milne (Kluwer, Dordrecht 1991) p. 249
- (12) J.A. Cardelli, G.C. Clayton, J.S. Mathis: ApJ 345, 245 (1989)
- (13) J.F. Dean, P.R. Warren, A.W.J. Cousins: MNRAS 183, 569 (1978)
- (14) M.W. Feast: PASP 111, 775 (1999)
- (15) M.W. Feast, R.M. Catchpole: MNRAS 286, L1 (1997)
- (16) M.W. Feast, A.R. Walker: ARA&A 25, 345 (1987)
- (17) J.D. Fernie: PASP 81, 707 (1969)
- (18) J.D. Fernie, B. Beattie, N.R. Evans, S. Seager: IBVS No. 4148 (1995)
- (19) M.U. Feuchtinger: A&AS 136, 217 (1999)
- (20) P. Fouqué, W.P. Gieren: A&A 320, 799 (1997)
- (21) W.L. Freedman, B.F. Madore: ApJ 365, 186 (1990)
- (22) W.L. Freedman, B.F. Madore, B.K. Gibson, L. Ferrarese, D.D. Kelson, S. Sakai, J.R. Mould, R.C. Kennicutt, Jr., H.C. Ford, J.A. Graham, J.P. Huchra, S.M.G. Hughes, G.D. Illingworth, L.M. Macri, P.B. Stetson: ApJ 553, 47 (2001)
- (23) W.P. Gieren, P. Fouqué: AJ 106, 734 (1993)
- (24) W.P. Gieren, P. Fouqué, M. Gómez: ApJ 488, 74 (1997)
- (25) W.P. Gieren, P. Fouqué, M. Gómez: ApJ 496, 17 (1998)
- (26) L. Girardi, M. Salaris: MNRAS 323, 109 (2001)
- (27) T. Gochermann, T. Schmidt-Kaler: A&A 391, 187 (2002)
- (28) K.D. Gordon, G.C. Clayton: ApJ 500, 816 (1998)
- (29) A. Gould: ApJ 426, 542 (1994)
- (30) M.A.T. Groenewegen: A&A 363, 901 (2000)
- (31) M.A.T. Groenewegen, R.D. Oudmaijer: A&A 356, 849 (2000)
- (32) J. Harris, D. Zaritsky, I. Thompson: AJ 114, 1933 (1997)
- (33) The Hipparcos and Tycho Catalogues, European Space Agency, SP-1200, Noordwijk (1997)
- (34) R.C. Kennicutt, Jr., P.B. Stetson, A. Saha, D. Kelson, D.M. Rawson, S. Sakai, B.F. Madore, J.R. Mould, W.L. Freedman, F. Bresolin, L. Ferrarese, H. Ford, B.K. Gibson, J.A. Graham, M. Han, P. Harding, J.G. Hoessel, J.P. Huchra, S.M.G. Hughes, G.D. Illingworth, L.M. Macri, R.L. Phelps, N.A. Silbermann, A.M. Turner, P.R. Wood: ApJ 498, 181 (1998)
- (35) C.S. Kochanek: ApJ 491, 13 (1997)
- (36) B.F. Lane, M.J. Creech-Eakman, T.E. Nordgren: ApJ 573, 330 (2002)
- (37) C.D. Laney, R.S. Stobie: MNRAS 263, 921 (1993)
- (38) C.D. Laney, R.S. Stobie: MNRAS 274, 337 (1995)
- (39) P. Lanoix, G. Paturel, R. Garnier: MNRAS 308, 969 (1999)
- (40) R.E. Luck, W.P. Gieren, S.M. Andrievsky, V.V. Kovtyukh, P. Fouqué, F. Pont, F. Kienzle: A&A in press (2003)
- (41) L.M. Macri, D. Calzetti, W.L. Freedman, B.K. Gibson, J.A. Graham, J.P. Huchra, S.M.G. Hughes, B.F. Madore, J.R. Mould, S.E. Persson, P.B. Stetson: ApJ 549, 721 (2001)
- (42) K.A. Misselt, G.C. Clayton, K.D. Gordon: ApJ 515, 128 (1999)
- (43) T.E. Nordgren, J.T. Armstrong, M.E. Germain, R.B. Hindsley, A.R. Hajian, J.J. Sudol, C.A. Hummel: ApJ 543, 972 (2000)
- (44) T.E. Nordgren, B.F. Lane, R.B. Hindsley, P. Kervella: AJ 123, 3380 (2002)
- (45) M.O. Oestreicher, J. Gochermann, T. Schmidt-Kaler: A&AS 112, 495 (1995)
- (46) M.O. Oestreicher, T. Schmidt-Kaler: A&AS 117, 303 (1996)
- (47) G. Pietrzyński, W. Gieren, P. Fouqué, F. Pont: AJ 123, 789 (2002)
- (48) F. Pont: ‘Harmonizing the Cosmic Distance Scale in the post-Hipparcos Era’. In: ASP Conf. Ser. vol. 167, ed. by D. Egret, A. Heck (ASP, San Francisco 1999) p. 113
- (49) F. Pont, F. Kienzle, W. Gieren, P. Fouqué: A&A 376, 892 (2001)
- (50) S.T. Ridgway, G.H. Jacoby, R.R. Joyce, M.J. Siegel, D.C. Wells: AJ 87, 680 (1982)
- (51) H. Saio, A. Gautschy: ApJ 498, 360 (1998)
- (52) D. Sasselov, J.-P. Beaulieu, C. Renault, P. Grison, R. Ferlet, A. Vidal-Madjar, E. Maurice, L. Prévot, E. Aubourg, P. Bareyre, S. Brehin, C. Coutures, N. Delabrouille, J. de Kat, M. Gros, B. Laurent, M. Lachièze-Rey, E. Lesquoy, C. Magneville, A. Milsztajn, L. Moscoso, F. Queinnec, J. Rich, M. Spiro, L. Vigroux, S. Zylberajch, R. Ansari, F. Cavalier, M. Moniez, C. Gry, J. Guibert, O. Moreau, F. Tajhmady: A&A 324, 471 (1997)
- (53) P.B.W. Schwering, F.P. Israel: A&A 246, 231 (1991)
- (54) J. Storm, B.W. Carney, W.P. Gieren, A.M. Fry, P. Fouqué: A&A in preparation (2002)
- (55) G.A. Tammann, A. Sandage, B. Reindl: A&A in press (2003)
- (56) D.G. Turner, J.F. Burke: AJ 124, 2931 (2002)
- (57) A. Udalski: Acta Astron. 50, 279 (2000)
- (58) A. Udalski, M. Szymański, M. Kubiak, G. Pietrzyński, I. Soszyński, P. Woźniak, K. Zebruń: Acta Astron. 49, 201 (1999)
- (59) A. Udalski, L. Wyrzykowski, G. Pietrzyński, O. Szewczyk, M. Szymański, M. Kubiak, I. Soszyński, K. Zebruń: Acta Astron. 51, 221 (2001)
- (60) ‘ftp://sirius.astrouw.edu.pl/ogle/ogle2/var_stars/lmc/cep/catalog/README.PL’
- (61) D.L. Welch: AJ 108, 1421 (1994)
- (62) P.A. Yecko, Z. Kolláth, J.R. Buchler: A&A 336, 553 (1998)