A Standard Kinetic Energy Reservoir in Gamma-Ray Burst Afterglows
Abstract
We present a comprehensive sample of X-ray observations of 41 -ray burst (GRB) afterglows, as well as jet opening angles, for a subset with measured jet breaks. We show that there is a significant dispersion in the X-ray fluxes, and hence isotropic X-ray luminosities (), normalized to hr. However, there is a strong correlation between and the beaming fractions, . As a result, the true X-ray luminosity of GRB afterglows, , is approximately constant, with a dispersion of only a factor of two. Since , the strong clustering of directly implies that the adiabatic blastwave kinetic energy in the afterglow phase, , is tightly clustered. The narrow distribution of also suggests that , that inverse Compton emission does not in general dominate the observed X-ray luminosity, and that radiative losses at hr are relatively small. Thus, despite the large diversity in the observed properties of GRBs and their afterglows the energy imparted by the GRB central engine to the relativistic ejecta is approximately constant.
1 Introduction
Gamma-ray bursts (GRBs) exhibit a remarkable diversity: Fluences range from to erg cm-2, peak energies range from 50 keV to an MeV, and possibly from the X-ray to the GeV band (Fishman & Meegan, 1995), and durations extend from about 2 to s (for the long-duration GRBs). This diversity presumably reflects a dispersion in the progenitors and central engine properties. Perhaps the most impressive feature of GRBs are their brilliant luminosities and isotropic energy releases approaching the rest mass of a neutron star, erg (Kulkarni et al., 1999; Andersen et al., 2000).
The quantity of energy imparted to the relativistic ejecta, , and the quality parameterized by the bulk Lorentz factor, , are the two fundamental properties of GRB explosions. In particular, extremely high energies push the boundaries of current progenitor and engine models, while low energies could point to a population of sources that is intermediate between GRBs and core-collapse supernovae.
The true energy release depends sensitively on the geometry of the ejecta. If GRB explosions are conical (as opposed to spherical) then the true energy release is significantly below that inferred by assuming isotropy. Starting with GRB 970508 (Waxman, Kulkarni & Frail, 1998; Rhoads, 1999) there has been growing observational evidence for collimated outflows, coming mainly from achromatic breaks in the afterglow lightcurves.
In the conventional interpretation, the epoch at which the afterglow lightcurves steepen (“break”) corresponds to the time at which decreases below , the inverse opening angle of the collimated outflow or “jet” (Rhoads, 1999). The break happens for two reasons: an edge effect, and lateral spreading of the jet which results in a significant increase of the swept up mass. Many afterglows have days, which are best measured from optical/near-IR lightcurves (e.g. Harrison et al. 1999; Kulkarni et al. 1999; Stanek et al. 1999), while wider opening angles are easily measured from radio lightcurves (e.g. Waxman, Kulkarni & Frail 1998; Berger et al. 2001).
Recently, Frail et al. (2001) inferred for fifteen GRB afterglows from measurements of and found the surprising result that is strongly correlated with the beaming factor, ; here, is the beaming fraction and is the -ray energy release inferred by assuming isotropy. In effect, the true -ray energy release, is approximately the same for all the GRBs in their sample, with a value of about erg (assuming a constant circumburst density, cm-3). In the same vein, broad-band modeling of several GRB afterglows indicates that the typical blastwave kinetic energy in the adiabatic afterglow phase is erg, with a spread of about 1.5 orders of magnitude (Panaitescu & Kumar, 2002). However, the general lack of high quality afterglow data severely limits the application of the broad-band modeling method.
Separately, Kumar (2000) and Freedman & Waxman (2001) noted that the afterglow flux at frequencies above the synchrotron cooling frequency, , is proportional to , where is the fraction of the shock energy carried by electrons and is the energy of the blastwave per unit solid angle. The principal attraction is that the flux above does not depend on the circumburst density, and depends only weakly on the fraction of shock energy in magnetic fields, . For reasonable conditions (which have been verified by broad-band afterglow modeling, e.g. Panaitescu & Kumar 2002), the X-ray band ( keV) lies above starting a few hours after the burst. Thus, this technique offers a significant observational advantage, namely the X-ray luminosity can be used as a surrogate for the isotropic-equivalent afterglow kinetic energy.
Piran et al. (2001) find that the X-ray flux, estimated at a common epoch (hr), exhibits a narrow distribution of , ; here is the variance of . Taken at face value, the narrow distribution of implies a narrow distribution of . This result, if true, is quite surprising since if the result of Frail et al. (2001) is accepted then should show a wide dispersion comparable to that of .
Piran et al. (2001) reconcile the two results by the following argument. The relation between and can be restated as . Thus, . Since (for a constant ) they express, . Given the diversity in (Frail et al., 2001) and the apparent narrowness in (above), it would then follow that should be very tightly distributed.
However, the approach of Piran et al. (2001) makes a key assumption, namely that and are uncorrelated. This is certainly true when is constant, but the assumption then pre-supposes the answer! In reality, a correlation between and can either increase or decrease , and this must be addressed directly. Finally, as appears to be the case (see §2), ) is dominated by bursts with the smallest opening angles, which results in a distinctly different value than the one used by Piran et al. (2001) based only on the observed values.
In this Letter, we avoid all these concerns by taking a direct approach: we measure the variance in rather than bounding it through a statistical relation. We show, with a larger sample, that is not as narrowly distributed as claimed by Piran et al. (2001), and in fact shows a spread similar to that of . On the other hand, we find that is strongly correlated with . It is this correlation, and not the claimed clustering of , that results in, and provides a physical basis for the strong clustering of and hence the blastwave kinetic energy, .
2 X-ray Data
In Table A Standard Kinetic Energy Reservoir in Gamma-Ray Burst Afterglows we provide a comprehensive list of X-ray observations for 41 GRB afterglows, as well as temporal decay indices, (), when available. In addition, for a subset of the afterglows for which jet breaks have been measured from the radio, optical, and/or X-ray emission, we also include the inferred (Frail et al., 2001; Panaitescu & Kumar, 2002). We calculate from using the circumburst densities inferred from broad-band modeling, when available, or a fiducial value of cm-3, as indicated by the best-studied afterglows (e.g. Yost et al. 2002). This normalization for is different from Frail et al. (2001) who used cm-3.
For all but one burst we interpolate the measured to a fiducial epoch of 10 hr (hereafter, ), using the measured when available, and the median of the distribution, when a measurement is not available. The single exception is GRB 020405 for which the first measurement was obtained hr, while the inferred jet break time is about hr (Berger et al. in prep). In this case, we extrapolate to hr using for hr and for hr. We list the values of in Table 2.
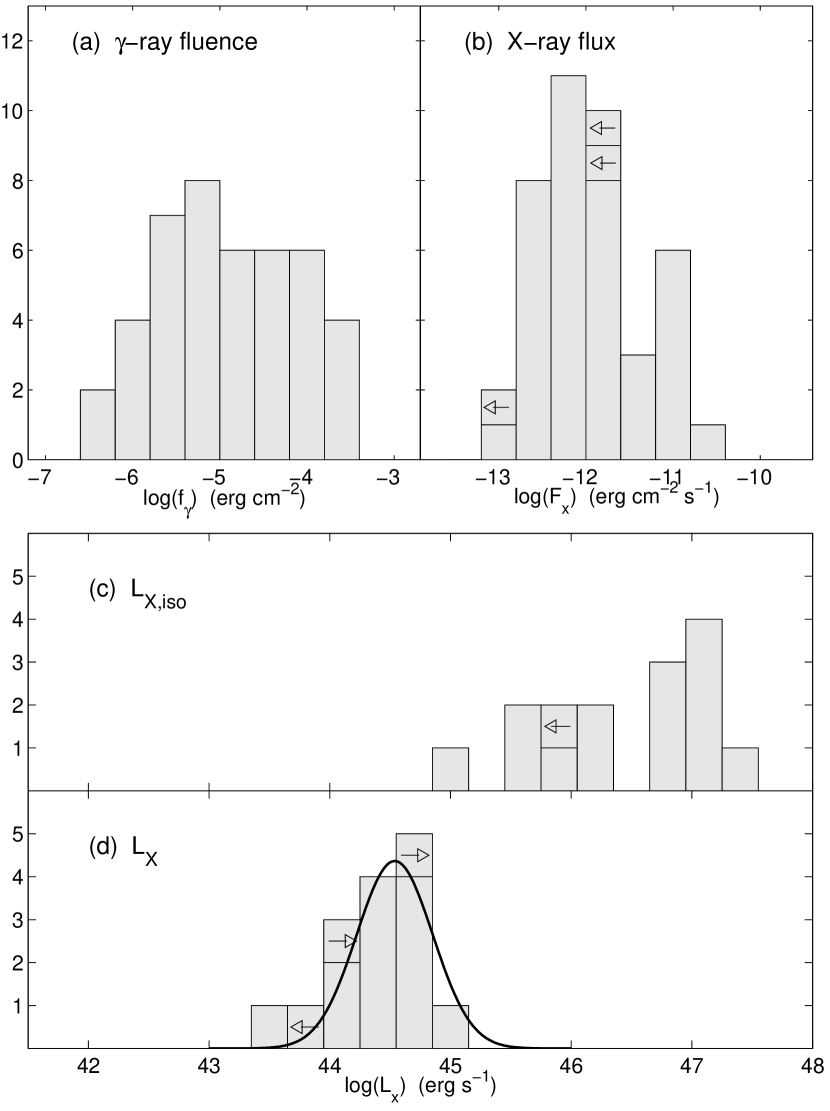
In Figure 1 we plot the resulting distribution of . For comparison we also show the distribution of -ray fluences from the sample presented by Bloom, Frail & Sari (2001) and updated from the literature. Clearly, while the distribution of X-ray fluxes is narrower than that of the -ray fluences, , it still spans orders of magnitude, i.e. . The value of , and all variances quoted below, are calculated by summing the Gaussian distribution for each measurement, and then fitting the combined distribution with a Gaussian profile.
We translate the observed X-ray fluxes to isotropic luminosities using:
| (1) |
We use , the weighted mean value for X-ray afterglows (De Pasquale et al., 2002), and the median redshift, , for bursts that do not have a measured redshift. The resulting distribution of , , is wider than that of due to the dispersion in redshifts. We note that this is significantly wider than the value quoted by Piran et al. (2001) of based on a smaller sample. Using the same method we find .
In the absence of a strong correlation between and , the above results indicate that the distribution of the true X-ray luminosities, , should have a wider dispersion than either or , for which we find (Frail et al., 2001). Instead, when we apply the individual beaming corrections for those bursts that have a measured and redshift111These do not include GRB 990705 which is poorly characterized; see §3. (see Table 2), we find a significantly narrower distribution, .
3 Beaming Corrections and Kinetic Energies
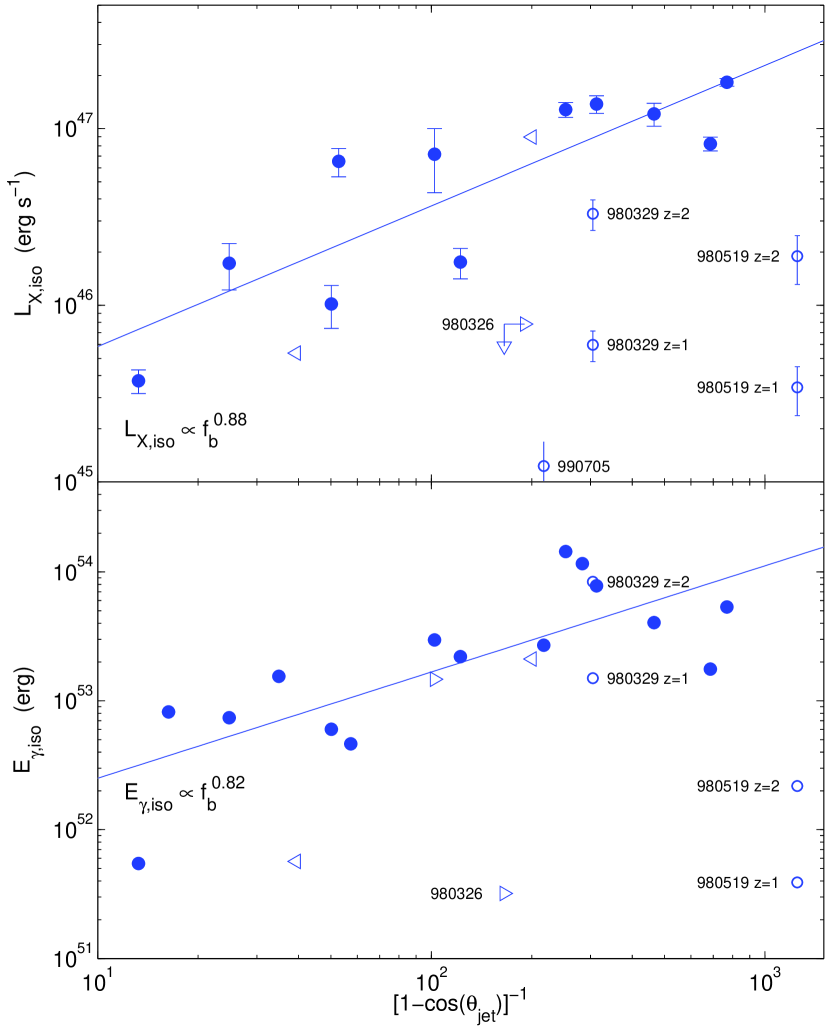
The reduced variance of compared to that of requires a strong correlation between and , such that bursts with a brighter isotropic X-ray luminosity are also more strongly collimated. Indeed, as can be seen from Figure 2 the data exhibit such a correlation. Ignoring the two bursts which are obvious outliers (980326 and 990705), as well as GRBs 980329 and 980519, which do not have a measured redshift, we find . The linear correlation coefficient between and indicates a probability that the two quantities are not correlated of only . For and we find a similar probability of that the two quantities are not correlated.
Thus, as with the -ray emission, the afterglow emission also exhibits strong luminosity diversity due to strong variations in . Therefore, the mystery of GRBs is no longer the energy release but understanding what aspect of the central engine drives the wide diversity of .
We note that there are four possible outliers in the correlation between and . The afterglows of GRBs 980326 and 980519 exhibit rapid fading (Groot et al., 1998; Vrba et al., 2000), which has been interpreted as the signature of an early jet break. However, it is possible that the rapid fading is instead due to a density profile, and in fact for GRB 980519 such a model indicates , times wider than in the constant density model. This is sufficient to bring GRB 980519 into agreement with the observed correlation. The redshift of GRB 980329 is not known, but with it easily agrees with the correlation. Finally, the X-ray flux and jet opening angle for GRB 990705 are poorly characterized due to contamination from a nearby source (De Pasquale et al., 2002) and a poor optical lightcurve (Masetti et al., 2000).
4 Discussion and Conclusions
We have presented a comprehensive compilation of early X-ray observations of 41 GRBs, from which we infer , the flux in the 2–10 keV band at 10 hr. As first pointed by Kumar (2000) and Freedman & Waxman (2001), the afterglow luminosity above the cooling frequency is where is the isotropic-equivalent explosion kinetic energy. More importantly, the flux is independent of the ambient density and weakly dependent on . For all well modeled afterglows, the cooling frequency at 10 hr is below the X-ray band. Thus, can be utilized to yield information about the kinetic energy of GRBs.
Earlier work (Piran et al., 2001) focussed on statistical studies of and found the very surprising result that it is narrowly clustered. By assuming that the true kinetic energy, , and (the beaming factor) are uncorrelated, the authors deduced that and thus are even more strongly clustered. However, this approach is weakened by assuming (in effect) the answer. Furthermore, the approach of Piran et al. (2001) which relies on subtracting variances is very sensitive to measurement errors. To illustrate this point, we note for the entire sample presented here, whereas . Thus, may be negative using the statistical approach.
In contrast to the statistical approach, we take the direct approach and estimate the true kinetic energy, , by using the measured and inferred . The advantage of our approach is that we do not make assumptions of correlations (or lack thereof) and more importantly we do not subtract variances. We directly compute the variance of the desired physical quantity, namely , and find that it is strongly clustered.
Even more importantly, with our direct approach we have uncovered the physical reason for the wide dispersion in and the clustering of , namely the dispersion in jet opening angles.
is related to the physical quantities as follows (Freedman & Waxman, 2001):
| (2) |
where
| (3) |
Here , as well as and depend to some extent on the details of the electron distribution (power law versus relativistic Maxwellian; the value of power law index, ).
There is no reason to expect that should be clustered. However, one can argue that the microphysics should be the same for each GRB afterglow, in particular and . The best studied afterglows appear to favor (e.g. Frail, Waxman & Kulkarni 2000; Galama et al. 1998), a value also favored by our current theoretical knowledge of shock acceleration (see Ostrowski & Bednarz 2002 and references therein). In addition, as already indicated by the -ray observations, there is evidence supporting strong clustering of explosion energies in GRBs (Frail et al., 2001).
Given these reasonable assumptions, a strong clustering of makes sense if the physical quantities that are responsible for are clustered. As can be seen from Equation 2, this would require that be linearly related to . Such a relation is possible if three conditions are met.
First, the afterglow X-ray emission on timescales of 10 hr must be primarily dominated by synchrotron emission (which is the basis of Equation 2). Contribution from inverse Compton (IC) emission, which depends strongly on and (Sari & Esin, 2001), is apparently not significant. A possible exception is GRB 000926 (Harrison et al., 2001), but even there the IC contribution is similar to that from synchrotron emission.
Second, the energy radiated by the afterglow from the time of the explosion to hr cannot be significant. This constrains the radiative losses at early time to at most a factor of few.
Third, must be relatively constant (as one may expect in any case from insisting that the microphysics should not be different for different bursts). For example, changing from a value of to results in ranging from 0.003 to 117, a factor of 39,000! Even small changes in , e.g. from to , result in a factor of 8 change in . In contrast, some afterglow models yield values of significantly below (e.g. Panaitescu & Kumar 2002), while others have approaching (Chevalier & Li, 2000). Our results, on the other hand, indicate that one should set and attribute apparent deviant values of to external environment or energy injection from the central source.
We end with an interesting conclusion from the results presented here. Since both the prompt and afterglow emission exhibit a strong correlation with , which is determined from late-time observations (hours to weeks after the burst), the resulting constancy of both and , indicates that GRB jets must be relatively homogeneous and maintain a simple conical geometry all the way from internal shocks ( cm) to the epoch of jet break ( cm). This rules out the idea that brighter bursts are due to bright spots along specific lines of sight (Kumar & Piran, 2000), or that GRB jets have a strong energy and/or Lorentz factor gradient across their surface (Rossi, Lazzati & Rees, 2002). It is indeed remarkable that the simplest description of jets is fully consistent with the observations.
References
- Amati et al. (2000) Amati, L. et al. 2000a, GRB Circular Network, 885, 1.
- Amati et al. (2000) Amati, L. et al. 2000b, Science, 290, 953.
- Andersen et al. (2000) Andersen, M. I. et al. 2000, A&A, 364, L54.
- Antonelli et al. (1999) Antonelli, L. A. et al. 1999, A&AS, 138, 435.
- Antonelli et al. (2000) Antonelli, L. A. et al. 2000, GRB Circular Network, 561, 1.
- Berger et al. (2001) Berger, E. et al. 2001, ApJ, 556, 556.
- Bloom, Frail & Sari (2001) Bloom, J. S., Frail, D. A., and Sari, R. 2001, AJ, 121, 2879.
- Bloom et al. (1999) Bloom, J. S. et al. 1999, Nature, 401, 453.
- Chevalier & Li (2000) Chevalier, R. A. and Li, Z. 2000, ApJ, 536, 195.
- De Pasquale et al. (2002) De Pasquale, M. et al. 2002, Submitted to ApJ; astro-ph/0212298.
- Feroci et al. (1998) Feroci, M. et al. 1998, A&A, 332, L29.
- Feroci et al. (2001) Feroci, M. et al. 2001, A&A, 378, 441.
- Feroci et al. (2000) Feroci, M. et al. 2000, GRB Circular Network, 685, 1.
- Fishman & Meegan (1995) Fishman, G. J. and Meegan, C. A. 1995, ARA&A, 33, 415.
- Frail et al. (2001) Frail, D. A. et al. 2001, ApJ, 562, L55.
- Frail, Waxman & Kulkarni (2000) Frail, D. A., Waxman, E., and Kulkarni, S. R. 2000, ApJ, 537, 191.
- Freedman & Waxman (2001) Freedman, D. L. and Waxman, E. 2001, ApJ, 547, 922.
- Frontera et al. (2000) Frontera, F. et al. 2000, ApJ, 540, 697.
- Frontera et al. (1999) Frontera, F. et al. 1999, GRB Circular Network, 401, 1.
- Frontera et al. (1998) Frontera, F. et al. 1998, ApJ, 493, L67.
- Frontera et al. (2001) Frontera, F. et al. 2001, GRB Circular Network, 950, 1.
- Galama et al. (1998) Galama, T. J., Wijers, R. A. M. J., Bremer, M., Groot, P. J., Strom, R. G., Kouveliotou, C., and van Paradijs, J. 1998, ApJ, 500, L97+.
- Groot et al. (1998) Groot, P. J. et al. 1998, ApJ, 502, L123+.
- Harrison et al. (1999) Harrison, F. A. et al. 1999, ApJ, 523, L121.
- Harrison et al. (2001) Harrison, F. A. et al. 2001, ApJ, 559, 123.
- in ’t Zand et al. (1998) in ’t Zand, J. J. M. et al. 1998, ApJ, 505, L119.
- in’t Zand et al. (2001) in’t Zand, J. J. M. et al. 2001, ApJ, 559, 710.
- Jaunsen et al. (2001) Jaunsen, A. O. et al. 2001, ApJ, 546, 127.
- Kulkarni et al. (1999) Kulkarni, S. R. et al. 1999, Nature, 398, 389.
- Kumar (2000) Kumar, P. 2000, ApJ, 538, L125.
- Kumar & Piran (2000) Kumar, P. and Piran, T. 2000, ApJ, 535, 152.
- Marshall & Takeshima (1998) Marshall, F. E. and Takeshima, T. 1998, GRB Circular Network, 58, 1.
- Marshall et al. (2000) Marshall, F. E., Takeshima, T., Kippen, T., and Giblin, R. M. 2000, GRB Circular Network, 519, 1.
- Masetti et al. (2000) Masetti, N. et al. 2000, A&A, 354, 473.
- Mirabal, Paerels & Halpern (2002) Mirabal, N., Paerels, F., and Halpern, J. P. 2002, ApJ (submitted), astro-ph/0209516.
- Murakami et al. (1997) Murakami, T., Ueda, Y., Ishida, M., Fujimoto, R., Yoshida, A., and Kawai, N. 1997, IAU Circ., 6722, 1.
- Nicastro et al. (1999) Nicastro, L. et al. 1999a, A&AS, 138, 437.
- Nicastro et al. (1999) Nicastro, L., Antonelli, L. A., Dadina, M., Daniele, M. R., Costa, E., and Pian, E. 1999b, IAU Circ., 7213, 2.
- Ostrowski & Bednarz (2002) Ostrowski, M. and Bednarz, J. 2002, A&A, 394, 1141.
- Panaitescu & Kumar (2002) Panaitescu, A. and Kumar, P. 2002, ApJ, 571, 779.
- Pian et al. (2001) Pian, E. et al. 2001, A&A, 372, 456.
- Piran et al. (2001) Piran, T., Kumar, P., Panaitescu, A., and Piro, L. 2001, ApJ, 560, L167.
- Piro (2001) Piro, L. 2001, in AIP Conf. Proc. 599: X-ray Astronomy: Stellar Endpoints, AGN, and the Diffuse X-ray Background, 295.
- Piro et al. (1998) Piro, L. et al. 1998, A&A, 331, L41.
- Piro et al. (2002) Piro, L. et al. 2002, ApJ (submitted), astro-ph/0201282.
- Price et al. (2002) Price, P. A., Bloom, J. S., Goodrich, R. W., Barth, A. J., Cohen, M. H., and Fox, D. W. 2002, GRB Circular Network, 1475, 1.
- Price & et al. (2002) Price, P. A. and et al. 2002, ApJ (submitted), astro-ph/0208008.
- Reeves et al. (2002) Reeves, J. N. et al. 2002, Nature, 416, 512.
- Rhoads (1999) Rhoads, J. E. 1999, ApJ, 525, 737.
- Rossi, Lazzati & Rees (2002) Rossi, E., Lazzati, D., and Rees, M. J. 2002, MNRAS, 332, 945.
- Sari & Esin (2001) Sari, R. and Esin, A. A. 2001, ApJ, 548, 787.
- Smith et al. (2002) Smith, D. A. et al. 2002, ApJS, 141, 415.
- Stanek et al. (1999) Stanek, K. Z., Garnavich, P. M., Kaluzny, J., Pych, W., and Thompson, I. 1999, ApJ, 522, L39.
- Takeshima et al. (1999) Takeshima, T., Markwardt, C., Marshall, F., Giblin, T., and Kippen, R. M. 1999, GRB Circular Network, 478, 1.
- Vanderspek et al. (2002) Vanderspek, R., Marshall, H. L., Ford, P. G., and Ricker, G. R. 2002, GRB Circular Network, 1504, 1.
- Vrba et al. (2000) Vrba, F. J. et al. 2000, ApJ, 528, 254.
- Vreeswijk et al. (1999) Vreeswijk, P. M. et al. 1999, ApJ, 523, 171.
- Watson et al. (2002) Watson, D., Reeves, J. N., Osborne, J. P., Tedds, J. A., O’Brien, P. T., Tomas, L., and Ehle, M. 2002, A&A, 395, L41.
- Waxman, Kulkarni & Frail (1998) Waxman, E., Kulkarni, S. R., and Frail, D. A. 1998, ApJ, 497, 288.
- Yost et al. (2002) Yost, S. A. et al. 2002, ApJ, 577, 155.
| GRB | Epoch | Flux | Ref. | |||
|---|---|---|---|---|---|---|
| (hrs) | ( erg cm-2 s-1) | |||||
| 970111 | 24.0 | 1,2 | ||||
| 30.7 | 2 | |||||
| 970228 | 0.695 | 8.5 | 2,3 | |||
| 12.7 | 2 | |||||
| 92.4 | 2 | |||||
| 970402 | 9.9 | 2 | ||||
| 16.8 | 2 | |||||
| 970508 | 0.835 | 13.1 | 0.391 | 4,5 | ||
| 72.3 | 2 | |||||
| 104 | 2 | |||||
| 970815 | 89.6 | 6 | ||||
| 970828 | 0.958 | 4.0 | 0.128 | 5,7 | ||
| 42.6 | 7 | |||||
| 971214 | 3.418 | 8.1 | 2,5 | |||
| 28.9 | 2 | |||||
| 971227 | 16.5 | 8 | ||||
| 980326 | 8.5 | 9 | ||||
| 980329 | 8.4 | 0.081 | 10,11 | |||
| 11.8 | 10 | |||||
| 16.4 | 10 | |||||
| 23.7 | 10 | |||||
| 43.6 | 10 | |||||
| 980515 | 11 | 12 | ||||
| 980519 | 10.9 | 0.040 | 13,14 | |||
| 15.3 | 13 | |||||
| 21.5 | 13 | |||||
| 27.2 | 13 | |||||
| 980613 | 1.096 | 9.9 | 2 | |||
| 23.4 | 2 | |||||
| 980703 | 0.966 | 34.0 | 0.200 | 2,15 | ||
| 981226 | 14.0 | 16 | ||||
| 990123 | 1.600 | 6.4 | 0.089 | 2,5 | ||
| 23.4 | 2 | |||||
| 990217 | 11 | 12 | ||||
| 990510 | 1.619 | 8.7 | 0.054 | 5,14,17 | ||
| 10.1 | 17 | |||||
| 11.7 | 17 | |||||
| 13.4 | 17 | |||||
| 15.3 | 17 | |||||
| 17.1 | 17 | |||||
| 19.1 | 17 | |||||
| 24.0 | 17 | |||||
| 26.3 | 17 | |||||
| 29.4 | 17 | |||||
| 990627 | 11.9 | 18 | ||||
| 990704 | 10.1 | 19 | ||||
| 13.4 | 19 | |||||
| 23.3 | 19 | |||||
| 26.8 | 19 | |||||
| 990705 | 0.840 | 14.5 | 0.096 | 5,20 | ||
| 990806 | 13.6 | 21 | ||||
| 34.3 | 21 | |||||
| 990907 | 11 | 12 | ||||
| 991014 | 11 | 12 | ||||
| 991216 | 1.020 | 4.0 | 0.051 | 5,14,22 | ||
| 10.9 | 22 | |||||
| 000115 | 2.9 | 23 | ||||
| 000210 | 0.846 | 11 | 24 | |||
| 000214 | 14.9 | 25 | ||||
| 22.1 | 25 | |||||
| 000528 | 11 | 12 | ||||
| 000529 | 9.0 | 26 | ||||
| 000926 | 2.037 | 54.9 | 0.140 | 14,27 | ||
| 66.5 | 27 | |||||
| 001025 | 50.4 | 28 | ||||
| 001109 | 19.3 | 29 | ||||
| 010214 | 7.7 | 30 | ||||
| 24.1 | 30 | |||||
| 010220 | 20.8 | 0.33 | 28 | |||
| 010222 | 1.477 | 8.9 | 0.080 | 14,31 | ||
| 32.7 | 31 | |||||
| 54.4 | 31 | |||||
| 011211 | 2.14 | 11.0 | 32 | |||
| 020322 | 18.8 | 33 | ||||
| 020405 | 0.698 | 41.0 | 0.285 | 34,35,36 | ||
| 020813 | 1.254 | 31.9 | 0.066 | 37,38 | ||
| 021004 | 2.323 | 31.4 | 0.240 | 39,40 |
Note. — The columns are (left to right): (1) GRB name, (2) redshift, (3) mid-point epoch of X-ray observation, (4) X-ray flux, (5) temporal decay index (), (6) jet opening angle, and (7) references for the X-ray flux and jet opening angle. a Due to the large uncertainty in the value of we use the median value for the sample, . b The redshift is based on matching the optical lightcurve of SN 1998bw to the red excess reported by Bloom et al. (1999). c The redshift limit is based on a detection of the afterglow in the optical -band (Jaunsen et al., 2001). d The inferred jet break is at , prior to the X-ray observation — we use the model fit to extrapolate the flux to hr (Berger et al. in prep.)
References. — (1) Feroci et al. (1998); (2) Piro (2001); (3) Frontera et al. (1998); (4) Piro et al. (1998); (5) Frail et al. (2001); (6) Murakami et al. (1997); (7) Smith et al. (2002); (8) Antonelli et al. (1999); (9) Marshall & Takeshima (1998); (10) in ’t Zand et al. (1998); (11) Yost et al. (2002); (12) De Pasquale et al. (2002); (13) Nicastro et al. (1999); (14) Panaitescu & Kumar (2002); (15) Vreeswijk et al. (1999); (16) Frontera et al. (2000); (17) Pian et al. (2001); (18) Nicastro et al. (1999); (19) Feroci et al. (2001); (20) Amati et al. (2000); (21) Frontera et al. (1999); (22) Takeshima et al. (1999); (23) Marshall et al. (2000); (24) Piro et al. (2002); (25) Antonelli et al. (2000); (26) Feroci et al. (2000); (27) Harrison et al. (2001); (28) Watson et al. (2002); (29) Amati et al. (2000); (30) Frontera et al. (2001); (31) in’t Zand et al. (2001); (32) Reeves et al. (2002); (33) Watson et al. (2002); (34) Price & et al. (2002); (35) Mirabal, Paerels & Halpern (2002); (36) Berger et al. (in prep); (37) Price et al. (2002); (38) Vanderspek et al. (2002); (39) Fox et al. (in prep); (40) Frail et al. (in prep).
| GRB | |||||
|---|---|---|---|---|---|
| ( erg cm-2 s-1) | ( erg s-1) | ( erg s-1) | |||
| 970111 | |||||
| 970228 | 0.695 | ||||
| 970402 | |||||
| 970508 | 0.835 | ||||
| 970815 | |||||
| 970828 | 0.958 | ||||
| 971214 | 3.418 | ||||
| 971227 | |||||
| 980326 | |||||
| 980329 | |||||
| 980515 | |||||
| 980519 | |||||
| 980613 | 1.096 | ||||
| 980703 | 0.966 | ||||
| 981226 | |||||
| 990123 | 1.600 | ||||
| 990217 | |||||
| 990510 | 1.619 | ||||
| 990627 | |||||
| 990704 | |||||
| 990705 | 0.840 | ||||
| 990806 | |||||
| 990907 | |||||
| 991014 | |||||
| 991216 | 1.020 | ||||
| 000115 | |||||
| 000210 | 0.846 | ||||
| 000214 | |||||
| 000528 | |||||
| 000529 | |||||
| 000926 | 2.037 | ||||
| 001025 | |||||
| 001109 | |||||
| 010214 | |||||
| 010220 | |||||
| 010222 | 1.477 | ||||
| 011211 | 2.14 | ||||
| 020322 | |||||
| 020405 | 0.698 | ||||
| 020813 | 1.254 | ||||
| 021004 | 2.323 |
Note. — The columns are (left to right): (1) GRB name, (2) redshift, (3) X-ray flux at hr, (4) X-ray luminosity at hr, (5) jet opening angle, and (6) beaming-corrected X-ray luminosity at hr.