The z0.1 Surface Brightness Distribution
The surface brightness distribution (SBD) function describes the number density of galaxies as measured against their central surface brightness. Because detecting galaxies with low central surface brightnesses is both time-consuming and complicated, determining the shape of this distribution function can be difficult. In a recent paper Cross, et al. suggested a bell-shaped SBD disk-galaxy function which peaks near the canonical Freeman value of 21.7 and then falls off significantly by 23.5 B mag arcsec-2. This is in contradiction to previous studies which have typically found flat (slope=0) SBD functions out to 24 – 25 B mag arcsec-2 (the survey limits). Here we take advantage of a recent surface-brightness limited survey by Andreon & Cuillandre which reaches considerably fainter magnitudes than the Cross, et.al sample (MB reaches fainter than 12 for Andreon & Cuillandre while the Cross, et.al sample is limited to MB 16) to re-evaluate both the SBD function as found by their data and the SBD for a wide variety of galaxy surveys, including the Cross, et al. data. The result is a SBD function with a flat slope out through the survey limits of 24.5 B mag arcsec-2, with high confidence limits.
1 Introduction
The Surface Brightness Distribution (SBD) function – a measure of the number density of galaxies broken into bins of decreasing central surface brightness – provides a quantitative description of the galaxy population within the Universe. The first attempt at quantifying the local (z0.1) disk-galaxy SBD was done by Freeman (1970) who found a Gaussian distribution with = 21.65 0.30 mag arcsec-2. In the years since Freeman’s distribution was published a significant quantity of galaxies have been found with central surface brightnesses more than 10 from Freeman’s canonical value, showing that Freeman’s distribution clearly underestimated the number of galaxies at faint surface brightness. Indeed it is fairly certain that the distribution seen by Freeman was due to selection effects imposed by the considerable noise inherent in imaging techniques at the time, which effectively eliminated the possibility of seeing galaxies with 23 mag arcsec-2.
In the thirty years since Freeman’s (1970) results were published, a number of attempts have been made to describe the local SBD. Adding on to the work done first by Disney (1976) and then McGaugh (1996), O’Neil & Bothun (2000) found that the SBD of galaxies at is described by a curve which rises steeply from 20 to 22 B mag arcsec-2 and then remains flat through the survey limits of 25.0 B mag arcsec-2. This implies that the majority of galaxies in the local Universe are low in surface brightness, and that LSB galaxies should play a significant role in studies of the local baryon density, damped Lyman- systems, and in theories of galaxy formation and evolution.
Recently, though, the belief in a flat SBD out to 25 mag arcsec-2 has been questioned. Using a subsample of galaxies taken from the 2dF Galaxy Redshift Survey, Cross, et al. (2001) found the local SBD to be best represented by a broadened version of Freeman’s (1970) original SBD. If this is correct it would have far-reaching implications. First, a SBD which falls off before = 24.0 mag arcsec-2, as the Cross, et al. distribution does, would imply that LSB galaxies are extremely rare and thus are rarely the cause of phenomenon such as damped Lyman- systems. Additionally, though, the Cross, et al. distribution suggests that, as surveys can now readily reach surface brightnesses fainter than 25.0 B mag arcsec-2, we have now seen the entire range of galaxies which exist at this epoch.
As the Cross, et al. (2001) results are both highly significant and seem in contradiction to the studies done by, e.g. O’Neil & Bothun (2000) and McGaugh (1996), further investigation is clearly warranted. With this in mind we have taken the recent results from a Canada-France-Hawaii Telescope (CFHT) deep survey of the Coma cluster (Andreon & Cuillandre 2002) to obtain an independent measure of the local SBD. Our results are then combined with previous SBD measurements and compared with that given by Cross, et al.
2 The Data
B, V, and R observations of the Coma Cluster using the CFHT were obtained by Andreon & Cuillandre (2002), and details about the observations and data reduction are given within that reference. All observations were taken on 12 January, 1999 with the Canada-France-Hawaii Telescope and CFH12K instrument (Cuillandre, et al. 2002). The fields were centered on the Coma cluster and had a usable area (observed field minus vignetting, etc.) of 0.29 degrees sq. in V and R, and 0.20 degrees sq. in B. The total integration time was 720s for the B and V images, and 480s for the R image. The seeing was found to be 0.88′′, 1.23′′ and 1.04′′ for the B, V, and R images, respectively.
For completeness, the sample was cut at central surface brightnesses 1.0 – 1.5 mag arcsec-2 brighter than the lowest detectable objects. That is, the sample is complete to the cutting central surface brightnesses of 23.75, 24.25, and 23.75 mag arcsec-2, where the limiting detection brightnesses are = 25.0, 25.5, 24.5 mag arcsec-2 in and , respectively. At the cut-off limits the measured signal-to-noise ratio is 20.
Foreground and background galaxies were eliminated from the sample by comparing counts of galaxies within the observed field and within a control field which crosses the Coma supercluster. Errors incurred in this method are discussed in detail in Andreon & Cuillandre (2002) and are included in the error estimates for this data with the minor difference that possible over–Possonian number galaxy fluctuations are not taken into account for lack of knowledge on the fluctuation amplitudes.
As described in Andreon & Cuillandre (2002), central surface brightnesses were determined by finding the magnitude within the 0.25 kpc aperture and dividing that by the area (in arcsec) of that aperture. (All analysis was done on images convolved with the seeing disk.) For the purpose of this article, the galaxies were then separated into bins 0.5 mag arcsec-2 wide, and counts were made to the number of objects in each bin. The band image proved to be the most reliable, having a definitive counts of 1000 galaxies (after elimination of background sources, etc.), with bins containing between 16 – 200 galaxies/bin in the = 20 – 23.5 mag arcsec-2 range. The and images had total counts of 404 and 157 galaxies, respectively, with bins containing 13 – 26 galaxies/bin in = 20 – 24 mag arcsec-2 and 8 – 40 galaxies/bin in = 20.5 – 23.5 mag arcsec-2, respectively. The considerably higher counts in the band are due to a combination of lower sky noise, high CCD quantum efficiency, low galaxy background contamination, and larger field size. As a result, the SBD determined for the band is by far the most reliable.
3 Finding the Surface Brightness Distribution
3.1 The Andreon & Cuillandre Data
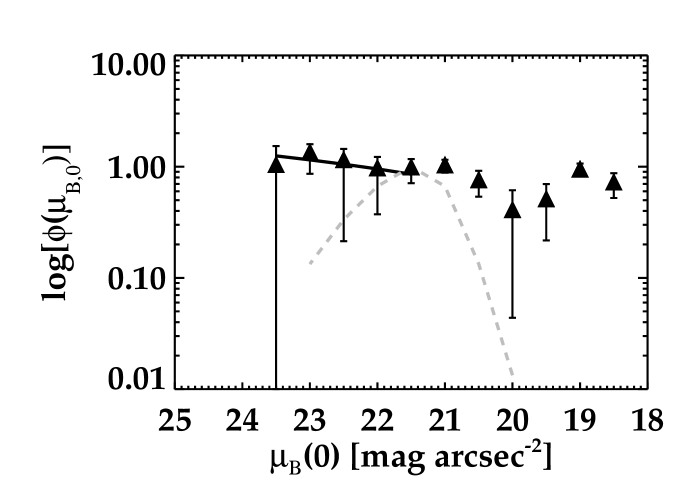
Unlike many previous SBD studies (bar that of Cross, et al. 2001), the data from Andreon & Cuillandre (2002) contains not just disk systems, but galaxies ranging from E and S0 through pure disk systems. As a result, at the bright end (e.g. between 18–21 B mag arcsec-2) the sample is predominantly bulge-dominated (Figure 1). Fortunately, the contribution of bulge-dominated galaxies at the surface brightness regime of interest (e.g. 21.5 mag arcsec-2) is extremely small. To account for this, all subsequent analysis of the Andreon & Cuillandre (2002) data will take into account only those data points with 21.5 mag arcsec-2 or 20.0 mag arcsec-2.
Obtaining a best-fit line to the 21.5 mag arcsec-2 data of Andreon & Cuillandre (2002) gives a line whose slope is marginally increasing with decreasing central surface brightness (slope = 0.08). This is in marked difference to the results shown by Cross, et al. (2001) which shows an almost Gaussian distribution to the SBD (Figure 1). As the error bars for the Andreon & Cuillandre (2002) distribution are fairly large, though, it is conceivable that the Cross, et al. distribution could describe Andreon & Cuillandre’s band data.
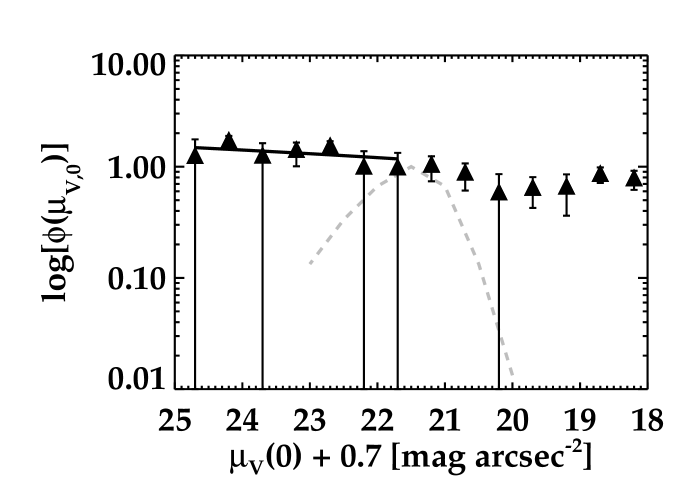
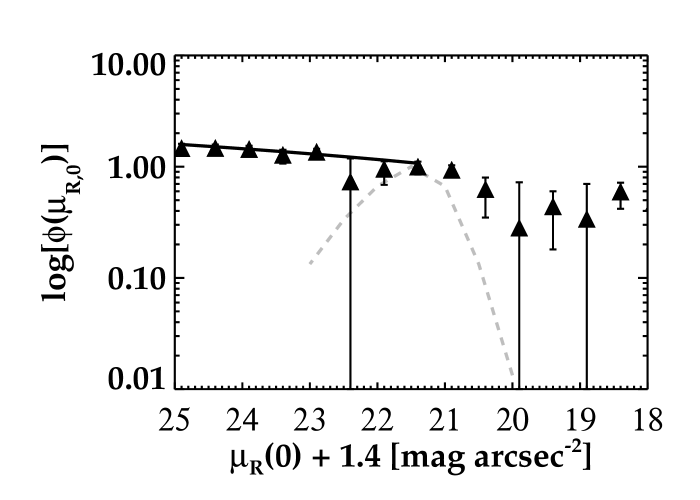
Strong support can be given to the argument that Andreon & Cuillandre’s band data is best fit by a roughly horizontal line by looking at the SBD in and (the more reliable datasets) – Figure 2. As discussed above, the errors for Andreon & Cuillandre’s V and R SBD are considerably smaller than for their band data. In particular, the band data has 200 galaxies/bin in the lower ( mag arcsec-2) bins. As can be seen, both the and band data have similar fits to the band fit, giving strong credence to the argument that the Cross, et al. curve is not an accurate description of the Andreon & Cuillandre data.
3.2 Combining Datasets
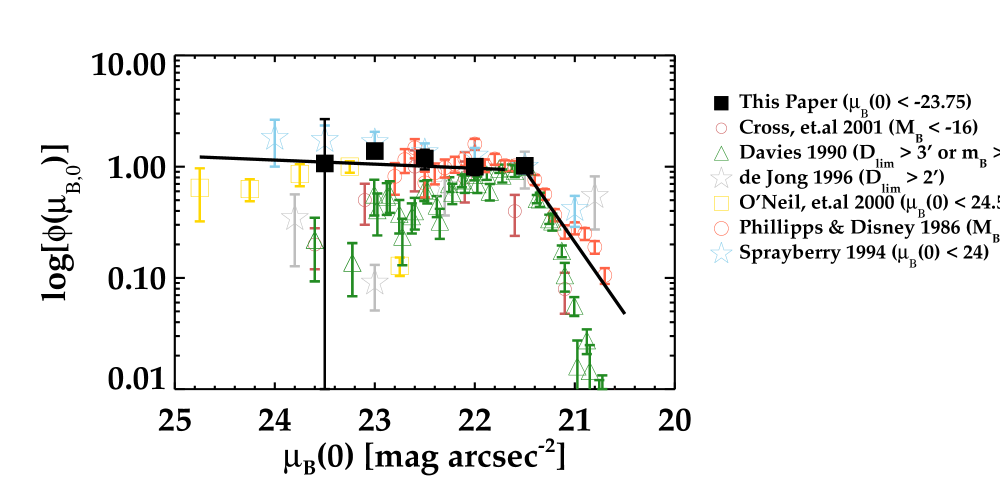
Another simple way to determine whether the Cross, et al. (2001) distribution represents the true galaxy population at z0.1 is to combine all previous data sets obtained for studying the local SBD function, and then obtain a best-fit curve to the data. Figure 3 shows all data points used for the SBD functions of McGaugh (1996), O’Neil & Bothun (2000), and Cross, et al. (2001) with the 21.5 mag arcsec-2 points from Andreon & Cuillandre (2002) overlaid. A best-fit line, weighted by the errors of the data points, is also shown. To allow for the natural fall-off in central surface brightness at 21.7 mag arcsec-2, two different lines were fit to the data – one for 21.7 mag arcsec-2 and one for 21.7 mag arcsec-2. In this case the distribution again shows a slight upwards slope at lower surface brightnesses (slope=0.03).
Finally, perhaps the most accurate fit to the data is obtained by re-binning and statistically averaging the data points from all previous studies, and obtaining a best-fit line to this new data set. In this case, the data was placed into 0.5 mag arcsec-2 bins. The mean (and error) were calculated, with each data point weighted inversely by its own variance. The results of this re-binning are shown in Figure 5. Two best-fit lines, again separated at the 21.7 mag arcsec-2 mark, are shown. In this case, the slope for the lower surface brightness regime has a slightly downward angle (slope=0.1). To insure that limiting the fit to a line did not force an artificial flattening of the SBD function, we also attempted to fit a second order function to the data. Not surprisingly, given the shape of the data, attempting to fit a bell-shaped curve to the seemingly flat data was unsuccessful.
3.3 Magnitude and Measurement Differences
One possible reason for the discrepancy between the Cross, et al. (2001) SBD and that presented in this paper is that the selection criterion and method for determining for the two surveys are quite different. The Cross, et.al survey uses an absolute magnitude cut-off at M and determines by assuming an exponential profile and extrapolating from the measured isophotal magnitudes and areas. In contrast, the Andreon & Cuillandre (2001) sample uses a surface brightness limit and obtains all surface brightness measurements through finding the total magnitude within a central 0.25 kpc aperture and dividing that by the area of that aperture (Section 2).

In the Coma sample, only 30 galaxies out of the 405 with 23.5 mag arcsec-2 also have MB 16. As a result it is not practical try to mimic the Cross, et.al survey limits (Figure 4). Instead, we can look at a variety of surveys undertaken and the limits inherent in those surveys. Figure 3 shows the SBD for a number of surveys, each having different survey limits. As with the Andreon & Cuillandre data, the majority of these surveys do not have explicit magnitude limits but instead have a surface brightness and diameter limit. We can, though, determine a rough magnitude limit for the surveys. Having done so (Figure 3), it is notable that no trend is clearly seen between the fall-off in the SBD and the magnitude limit of the survey. This re-emphasizes the idea that any complete survey of galaxies is defined not by a limiting magnitude, but by the combination of a limiting magnitude and diameter. That is, by a surface brightness limit.
4 Discussion
The SBD described herein, obtained though combining a wide variety of survey data (including that of Cross, et al. 2001), is in clear agreement with the studies of both McGaugh (1996) and O’Neil & Bothun (2000). That is, up to the general survey limits of 24.5 mag arcsec-2, our data conclusively shows that the SBD for the Andreon & Cuillandre sample does not decrease significantly between the canonical Freeman (1970) value of 21.7 and the survey limits of 24.5 mag arcsec-2. Within the errors of this data, the line can be best described as have a slope of 0.0 0.1. This is in clear contrast to the SBD determined by Cross, et al. (2001). It is possible that the reason for the difference in the two surveys is due to a much higher magnitude cut-off for the Cross, et al. sample than that of Andreon & Cuillandre. If this is correct it would imply that although low surface brightness galaxies may numerically dominate the number counts of galaxies in the local Universe, they do not play an important role in measures of either the total light or mass at z 0.1. It is important to note, though, that by combining a wide variety of survey data, we attempted to minimize systematic errors induced by individual surveys and techniques. That is, we have included both samples which are purely volume limited (e.g. the Andreon & Cuillandre sample) and samples which are magnitude and/or diameter limited (e.g. Sprayberry 1994) and no trend is clearly seen between the fall-off in the SBD and the magnitude limit of the survey.

It seems plausible that the SBD given in Figure 5 is an accurate representation of the SBD in the z 0.2 Universe. Due to a dearth of data, though, the shape of the SBD in the 25.5 mag arcsec-2 range cannot currently be determined, as finding the true form of the SBD at lower central surface brightnesses will only happen as survey sensitivities increase. We can gain a hint of what be be found through examining some recent findings in the literature. There have been a number of discoveries over the past few years of galaxies detected at 21-cm which which cannot be identified down to optical limits of 2527 mag arcsec-2 (Boyce, et al. 2001; Ryder, et al. 2001; Kilborn, et al. 2000; Rosenberg & Schneider 2000). Although none of these detections can make any statement as to the number density of extremely low surface brightness galaxies, the fact that any galaxies have been found so far below current survey limits argues that we still are not seeing a complete picture of the local galaxy population.
References
- Andreon & Cuillandre (2002) Andreon, S. & Cuillandre (2002) ApJ, 569, 144
- Boyce, et al. (2001) Boyce, P., et al. 2001 ApJ 560, 127
- Cross, et al. (2001) Cross, N. et al. 2001 MNRAS 324, 825
- Cuillandre, et al. (2002) Cuillandre, J-C., et al. 2002 in prep
- Davies (1990) Davies, J. 1990 MNRAS 244, 8
- de Jong (1996) de Jong, R. 1996 A&A 313, 46
- Disney (1976) Disney, M. 1976 Nature 263, 573
- Freeman (1970) Freeman, K. 1970 ApJ 160, 811
- Garilli, Maccagni, & Andreon (1999) Garilli, B., Maccagni, D., & Andreon, S. 1999 A&A 342, 408
- Impey, Bothun, & Malin (1988) Impey, C., Bothun, G., & Malin, D. 1988 ApJ 330, 634
- Kilborn, et al. (2000) Kilborn, V. A., et al. 2000 AJ, 120, 1342
- McGaugh (1996) McGaugh, S. 1996 MNRAS 280, 337
- O’Neil & Bothun (2000) O’Neil, K. & Bothun, G. 2000 ApJ, 529, 811
- O’Neil, Bothun, & Schombert (2000) O’Neil, K., Bothun, G., & Schombert, J. 2000 AJ 119, 136O
- O’Neil, Bothun, & Cornell (1997) O’Neil, K., Bothun, G., & Cornell, M. 1997 AJ 113, 1212
- Phillips & Disney (1986) Phillips, S. & Disney, M. 1986 MNRAS 221, 1039
- Rosenberg & Schneider (2000) Rosenberg, J. & Schneider, S. 2000 ApJS 130, 177
- Ryder, et al. (2001) Ryder, S.D., et al. 2001 ApJ, 555, 232
- Sprayberry (1994) Sprayberry, D. 1994 PhDT, The University of Arizona