Spectropolarimetry of GRB 021004 - Evidence for High Velocity Absorptions 111Based on observations collected at the European Southern Observatory, Chile (ESO Progr. No. 68.D-0571(A)).
Abstract
We present spectropolarimetry observations of GRB 021004 obtained at the ESO VLT. We detect a remarkable increase of the degree of polarization blueward of the host galaxy rest frame to about 5-10% that corresponds to a decrease in the continuum flux below the extrapolation of a power law. An increase of the degree of polarization is also recorded in some narrow lines, but of lower statistical significance. The broad polarization feature blueward of the absorption line at 4040 Å is at least partially produced by hydrogen-rich material with velocities approaching 40,000 km s-1 located beyond the front of the afterglow shock, rather than due entirely to intergalactic absorption systems on the line of sight to the -ray burst. The presence of the broad absorption provides evidence that the -ray burst occurred inside the ejecta from a hydrogen-rich supernova that exploded before the -ray burst.
1 Introduction
Polarization measurements have been reported for a few -ray bursts such as GRB 990510 (Covino et al. 1999; Wijers et al. 1999), GRB 990712 (Rol et al., 2000), GRB 011211 (Covino, et al. 2002a) GRB 020813 (Barth et al. 2002; Covino et al. 2002b), and GRB 021004 (Covino et al. 2002c, 2002d, Rol et al. 2002). A highly significant variation in the polarization level is observed for GRB 020813 with constant polarization position angle.
Several models for -ray burst polarization have been proposed. Gruzinov & Waxman (1999) argued that if the magnetic field is globally random but with a large number of patches where the magnetic field is locally coherent, polarization of up to is expected, especially at early times. Ghisellini & Lazzati (1999) and Sari (1999) considered a geometrical configuration in which a collimated fireball is observed slightly off-axis, and found that this break of symmetry results in significant polarization.
GRB 021004 was discovered by HETE II satellite at 12:06 UT on 2002 October 4 (Shirasaki et al., 2002). Prompt discovery of the optical transient by (Fox et al., 2002a) allowed rapid response of spectroscopic observations. (Fox et al., 2002b) obtained the first spectra and identified two intervening systems at z = 1.38 and 1.60 from Mg I and Mg II absorption. Eracleous et al. (2002) confirmed those features, noted several Fe II absorptions at these redshifts, and pointed out four absorption lines at 4633, 4664, 5109, and 5152 Å (see also Sahu et al. 2002; Castander et al. 2002). These were identified by (Chornock & Filippenko, 2002) as C IV and Si IV features at red shift of . Chornock & Filippenko also identified Ly emission at z = 2.323 and absorption components and perhaps Ly at similar red shifts. Salamanca et al. (2002) identified four absorption components of C IV at z = 2.295, 2.298, 2.230 and 2.237, noting that the total spread is about 3000 km s-1. The existence of various components in the lines shows that this -ray burst is associated with a star forming region and, very likely, is associated with the explosion of a massive star (Schaefer et al. 2002, Mirabal et al. (2002), Savaglio et al. (2002)). The lines could be formed in the wind of the progenitor, which could be an O star, or a Wolf-Rayet (WR) star which both show typical expansion velocities of the order of 1,000 to 3,000 km s-1. Alternatively, Salamanca et al. (2002) suggested that the lines could be produced in a supernova shell that preceeded the explosion by several months. This velocity dispersion would be difficult to interpret as due to a single cluster of galaxies. For a more detailed discussion see Schaefer et al. (2002).
Here we report polarization spectra obtained with the ESO-VLT about 5 days after the -ray burst which sheds new light on the origin and relation between massive stars and -ray bursts.
2 Observations and Data Reductions
The observations were made on 2002 Oct. 5 using the Very Large Telescopes (UT3) of the European Southern Observatory. Four exposures of 30 minutes each with the Wollaston Prism at position angles at 0, 45, 22.5, and 65.5 were obtained using the ESO grism GRISV at UT Oct 5.202, 5.225, 5.248, and 5.269. No order sorting filter was applied. We used Melipal (= UT3) with FORS1 (Wang, el al., 1996). FORS1 employs a TK2048EB4-1 20482048 backside-illuminated thinned CCD. The cooling of the CCD is performed by a standard ESO bath cryostat. This system uses a FIERA controller for CCD readout. The grism GRIS-300V (ESO number 10) was used for all observations. The range 360 to 850 nm was covered.
The data reduction package follows the descriptions given in the ESO user manual. The Stokes parameters Q and U are converted to the degree of polarization using the formula given in Wang et al (1996) which corrects observational biases due to statistical noise. Systematic errors are expected to be small ().
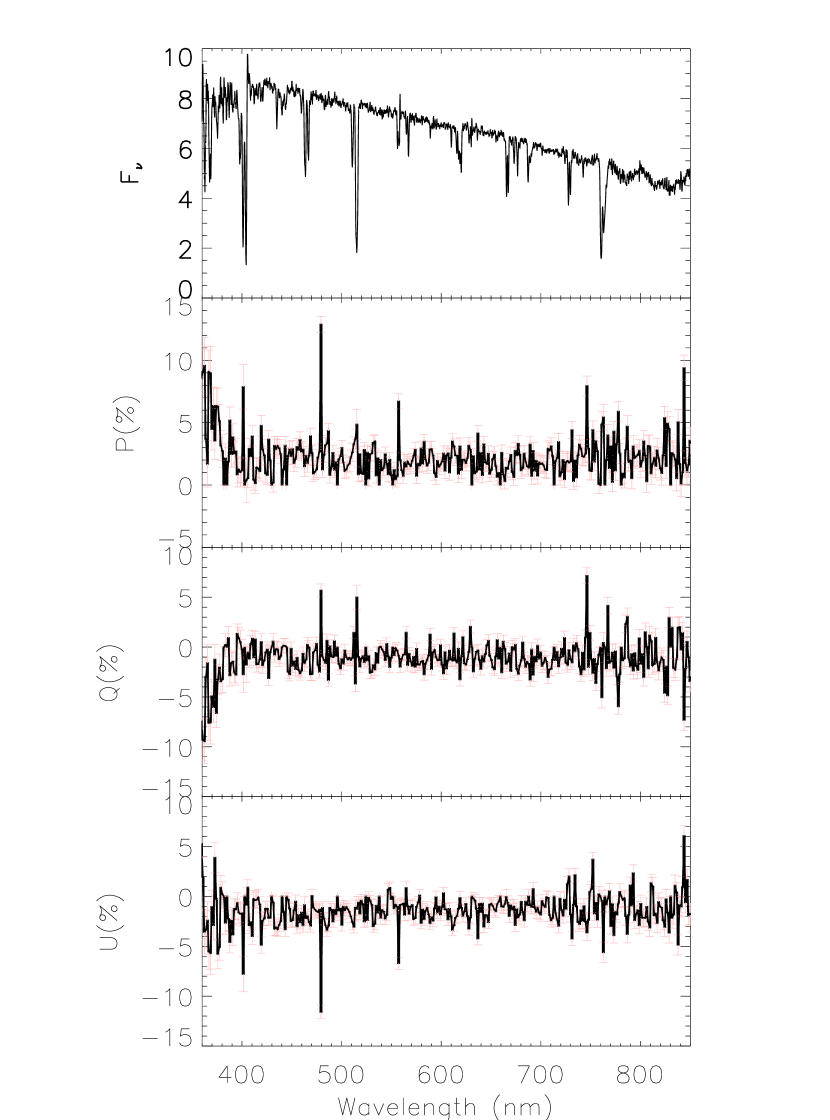
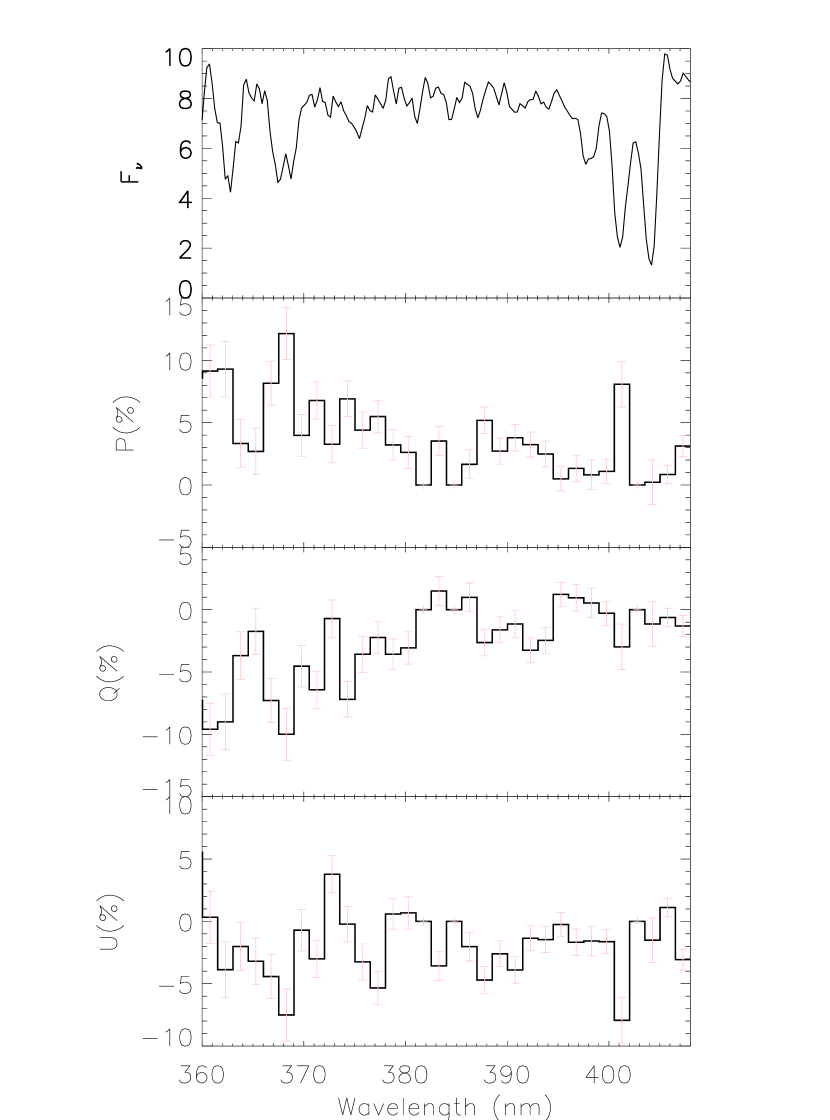
The flux spectrum and the Stokes and parameters are shown in Figure 1, where the data were binned to 15Å to eliminate the effect of correlations of the data values due to finite spectral resolution.
3 Results from Observations
3.1 The Continuum Polarization
Broad band polarization of GRB 021004 obtained at the ESO VLT-UT3 on October 5.080 to 5.149 was reported by Covino et al (2002c) where it was found that the band polarization is with a position angle of . Another set of broad band polarimetry was obtained on Oct. 5.175 and the resulting polarization was found to be with position angle (Rol, et al. 2002). About 3 days after these polarization measurement, ESO VLT-UT3 obtained yet another measurement and found the -ray burst to be polarized at with position angle (Covino et al. 2002d). These observations show marginal evolution of the degree of polarization.
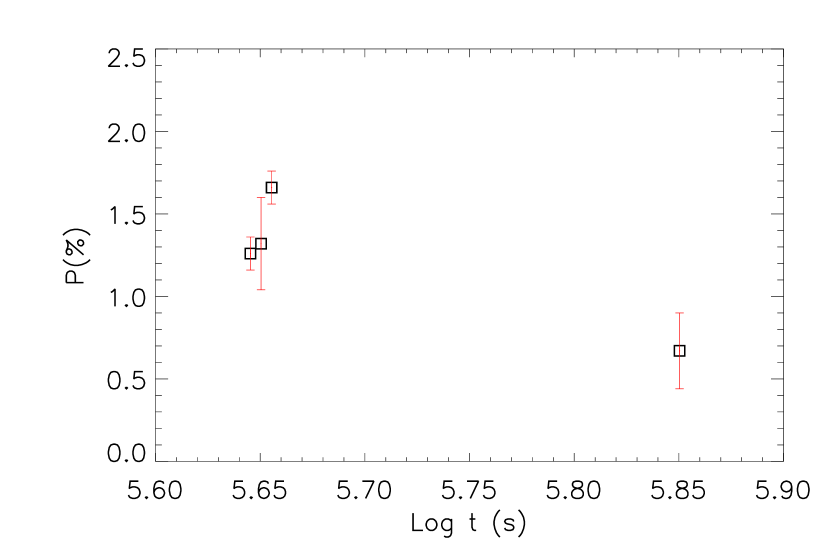
Out spectropolarimetry data was obtained on Oct 5.202 - 5.269, soon after the observations of Rol et al (2002). The continuum polarization in the -band synthesized from these observations is position angle of . The errors of the position angle of our measurement are obtained directly from the RMS scatter of the polarization position angle at different wavelengths. Despite the fact that the polarization position angle is consistent with those reported in Covino et al (2002c, 2002d) and Rol (2002), the degree of polarization is considerably higher than the corresponding reported values. This suggest a rapid evolution of the degree of polarization in the early phases. It is interesting to note that spectropolarimetry and the broad band polarimetry reported in Covino et al (2002c) and Rol (2002) were obtained right at the tail of a big bump in the light curve of the -ray burst (e.g. Schaefer et al., 2002). The time evolution of the -band polarimetry is shown in Figure 2.
3.2 The Polarization across the Strongest Narrow Absorption Lines
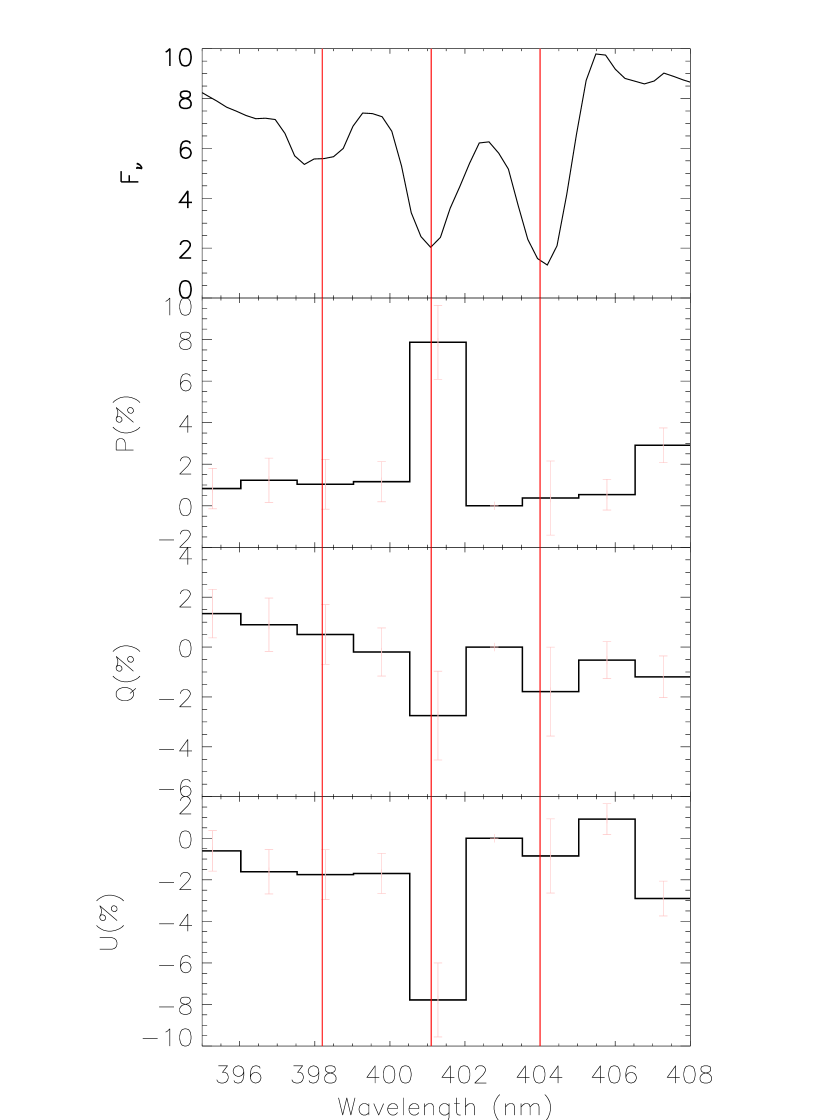
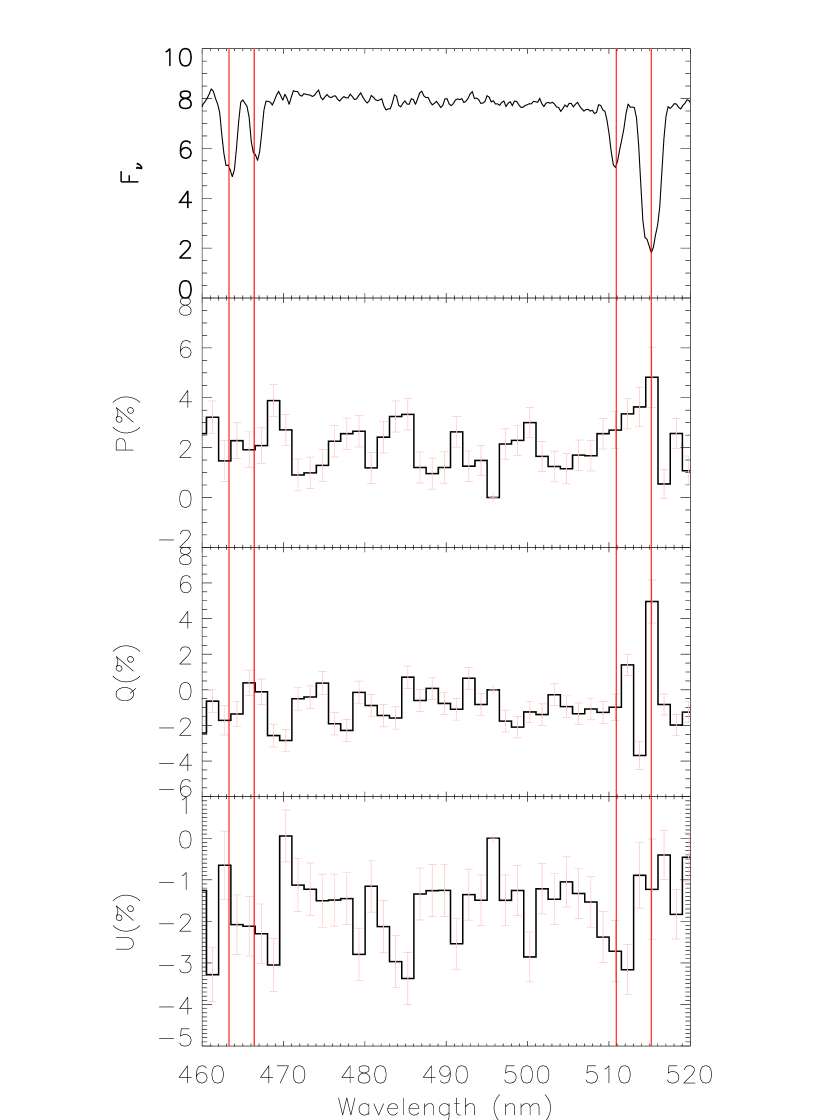
The absorption lines are sharp and strong, and the noise at the line dips becomes much larger than neighboring wavelength regions. The instrumental resolution also makes correlations between neighboring pixels significant in the statistical analysis of the polarization data. The data are thus re-sampled to bins comparable to the spectral resolution which is 12Å. The re-sampling is done using the weighted integration methods described in Wang et al. (1996) which takes into account the photon statistical errors due to each pixel. The binned data are shown in Figure 3a for the lines and in Figure 3b for the Si IV and C IV lines. An apparent increase of the degree of polarization is observed at the 2 level across the narrow line at 401.1 nm, as shown in Figure 3. A similar change is also seen across the C IV 515.2 nm line, but with even lower significance. No such sharp change is observed for the stronger line at 404.0 nm, or any other strong lines.
3.3 The Polarization Blueward of 4040A
We show in Figure 4 the polarization blueward of the absorption line at 404.0 nm. A gradual increase of the mean degree of polarization toward the blue end of the spectrum is observed. Despite the loss of sensitivity of the instrument at the very blue end, polarization as high as 5% is detected at levels above 2.
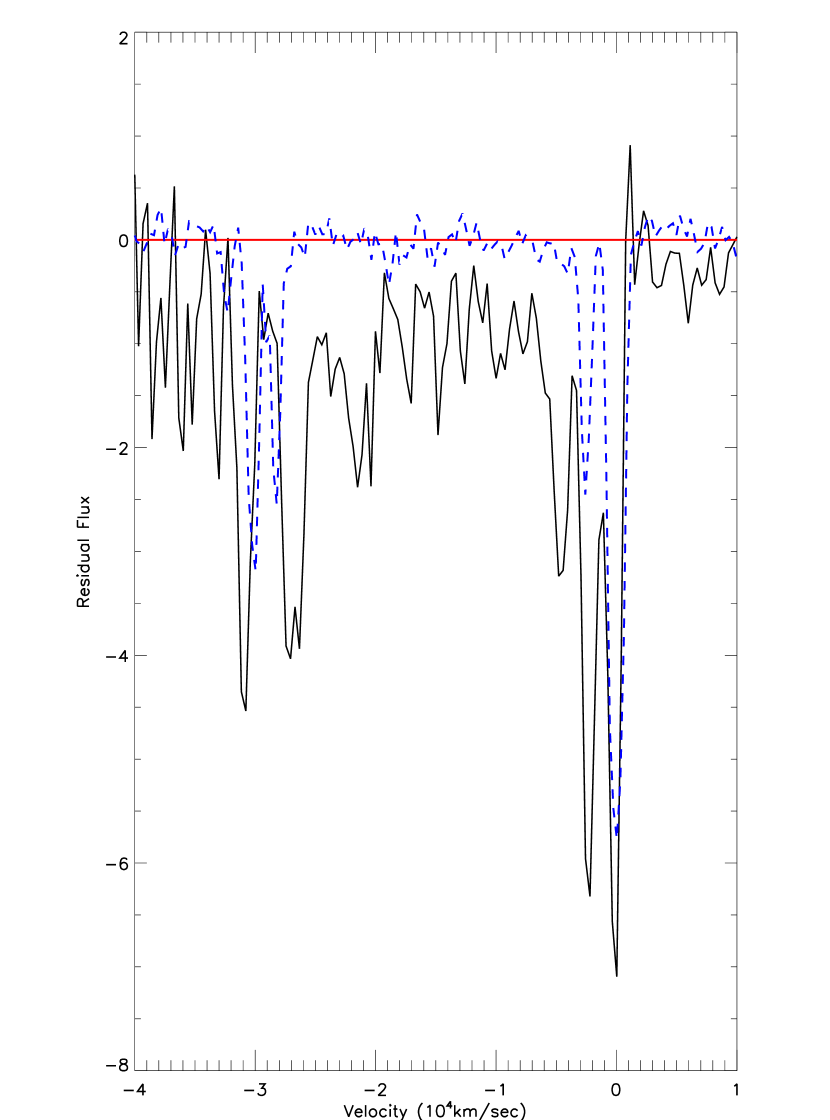
In Figure 5, we show the absorption lines after subtracting a power-law fit to longer wavelengths. With the high signal to noise of these data, essentially all the features in the total flux spectrum are real. If we interpret all these features as , it can be seen that the spectrum consists of many narrow absorption features 1 nm wide to a velocity as high as 40,000 km s-1 from the rest frame defined at z=2.326. Typical separation of the lines is around 2000-3000 km s-1. Two especially strong absorptions are seen at 362 and 368 nm that we interpret as at 27,000 km s-1 and 31,000 km s-1. In principle, these features could be attributed to a large number of intergalacitic clouds forming the forest, or to high velocity clumps/shells in the direct neighborhood of the -ray burst.
The argument in favor of an intimate connection of the multiple L absorption features to the -ray burst comes from the polarization. Since the increase in the polarization shown in Figure 4 sets in right at the rest frame , it is reasonable to assume that is directly responsible for the change in polarization (see §4.2). This supposition finds further support in the polarization change over in the three strongest components at 3000, 27,000 and 30,000 km s-1. Since intergalactic absorption systems are incapable of producing polarization, it thus seems likely that the absorptions blueward of are associated with material of corresponding velocity: material/clumps surrounding the -ray burst with velocity far in excess of that to be expected from stellar winds.
Figure 5 also shows portion of the spectrum from about 450 to 520 nm that contains the strong absorption lines of C IV and Si IV with the velocity rest frame chosen to be that of the rest frame of C IV 154.9 nm. Note that the two strongest components of C IV nearly line up with those of . Also note that there no strong high velocity (20,000 – 30,000 km s-1) components to the C IV and Si IV lines are observed. This suggests that the broad decrease in flux and rise in polarization blueward of are due to hydrogen.
4 Discussions and Conclusions
4.1 Implications for Published Models for -Ray Burst Polarization
The optical emission from a -ray burst is produced by synchrotron emission which is usually highly polarized. The degree of the polarization depends on the scale of the fluctuations of the magnetic field in the -ray burst source. When the spatial scales of the fluctuations are about times smaller than the extent of the -ray burst source, the degree of polarization is reduced by times that of the polarization of each single magnetic patch. Gruzinov & Waxman (1999) studied this case, and found that the integrated degree of polarization can be around . The continuum and the -band polarization was observed to be around 1% for GRB 021004. It thus seems that and the typical scale of the magnetic field is around 1.6% of that of the -ray burst source. This means there are about 3,600 patches on the surface of the -ray burst optical afterglow.
In the case of the collimated fireballs of Ghisellini & Lazzati (1999) and Sari (1999), the polarization has a more complex behavior related to the break time of the total flux light curve. The polarization is zero at jet break out. GRB 021004 is obviously associated with very complicated circum-burst matter where several bumps are observed in the broad band light curves. The polarization measurements reported here were obtained at a time corresponding to the end of a bump of the broad band light curve. It is not clear if this is merely a coincidence, or of more fundamental significance.
4.2 Why Would Any Absorption Features be Polarized ?
Questions then arise as to why the broad absorption feature blueward of is polarized, and why the polarization varies across any narrow absorption features? No such variations are expected within the context of published models for -ray burst polarization.
We propose a very simple model for the observed polarization variation across spectral lines. For illustrative purposes, we start with the patchy models described above and as in Ghisellini & Lazzati (1999). We assume the surface of the -ray burst optical afterglow consists of patches each polarized at around . The unabsorbed wavelength regions will then be polarized at around . The absorbing circum-burst matter may not be uniform, but could be patchy clouds with varying opacity. The patchy structure of the clouds is expected to absorb different parts of the surface of the optical afterglow differently. Assuming there are absorption patches covering the -ray burst and for simplicity that the patches are completely opaque, the degree of polarization from such a configuration would be of the order for . For , the patchiness of the surrounding medium would have little effect on the polarization of the -ray burst. We see from these equations that should be of the same order of for it to have a significant effect and to account for the observed polarization in the lines.
It is likely that the patchiness of the circum-burst matter is related to the -ray burst event itself. The intense high energy photons from the -ray burst ionize the material ahead of the blast wave. Both inhomogeneities of the GRB shock and the density fluctuations in the circum-burst matter would affect the opacity patterns. The patchiness of the emitting surface of the afterglow shock implies that the opacity of the clouds reflects the emission patterns of the -ray burst, but from an epoch earlier than when the optical afterglow becomes prominent. The difference is caused by the fact that the ionization starts immediately after the -ray burst event, which is earlier than the actual epoch when these observations were made, and the absorption is produced after the denser part of the circum-burst material recombines to form neutral hydrogen.
This brings us to the question of the nature of -ray bursts. To form blue absorption lines, the absorbing clumps must be outside the region that produces the afterglow. Expansion velocities of the order of 30,000 km s-1 far exceed those expected from winds of massive stars or WR stars. Either the matter is accelerated by the -ray burst or the material was accelerated by a stellar explosion (there could be some radiative acceleration in the latter case). According to Schaefer et al. (2002), radiative acceleration to such high velocities would require a location of the clouds with the highest velocities at cm. Even if a wind could be radiatively accelerated to a velocity of 30,000 km s-1 a Wolf-Rayet star is not a likely candidate. If our interpretation of the absorption features blueward of the rest frame as high velocity is correct, then the high-velocity hydrogen lines are representative of the explosion of a massive star – a Type II supernova, with a hydrogen-rich envelope or wind.
The nature of the high-velocity polarized matter blueward of can be further constrained by the afterglow light curves. Assuming, as found by Schaefer et al. (2002) that the after glow is produced at distances between to 1017 cm about 1 day after the burst. The particle densities of the surrounding medium are of the order of 30 to 100 cm-3. For those densities, the -ray burst would fully ionize the matter and, using standard recombination theory, hardly any H I, C IV, or Si IV lines would be observable. Note that the standard recombination theory may be not be appropriate in this context because the electron gas is highly non-thermal, thus violating a basic assumption for calculating the recombination cross sections. These caveats aside, it is thus difficult to see how a circum-burst medium consisting only of a stellar wind could account for both the high-velocity, high-ionization lines and for the even higher velocity hydrogen suggested by the polarization. Rather, it seems that there must be some rather high-density matter in the vicinity of the burst that would allow rapid recombination of some high-velocity hydrogen into the ground state.
The overall smooth variation of the polarization blueward of the rest frame suggests that the opacity of the absorbing clumps is affected by the -ray burst, and that the material responsible for the absorption is at least partially due to matter in the vicinity of the -ray burst. In contrast to the density expected for a stellar wind at distances for which some ions could survive the burst, a supernova envelope could provide both the very high velocities deduced for some of the and sufficiently high densities that recombination could be rapid. For supernova envelopes, we expect densities of about to 109 particles cm-3 at a distance of cm resulting in very small recombination times.
The scenario that emerges to account for the polarization is the presence of the ejecta of a Type II supernova with a thin layer of hydrogen ejected to velocities as high as 40,000 km s-1. Such high velocity material is not unprecedented, but is indeed observed in some Type II supernovae. In order for the supernova material that causes the high-velocity absorption and the polarization blueward of the rest frame , the supernova material must lie outside the afterglow shock when the observations were made about 1 day after the -ray burst. To reach a distance in excess of cm, the supernova explosion must have preceded the -ray burst by several weeks. But note again that this conclusion is based on the assumption that the after glow was produced at a distance about cm from the the center of the GRB.
If this picture is correct, the resulting densities at cm are of order cm-3, i.e. in contradiction to the densities derived from the light curve. This may suggest a medium that has both low and high densities at about the same distance. This and the intrinsic line widths of the high-velocity components (1000 km s-1) that are small compared to the overall velocity (30,000 km s-1) indicate a very clumpy medium. Alternatively, high velocity bullets penetrating the ISM prior to the classical supernova shell may also be possible.
Our polarization observations have thus led to the suggestion that a supernova preceded GRB 021004 by weeks to months. This is very reminiscent of the “supernova” hypothesis of Vietri & Stella (1998, 1999) in which a neutron star with mass above the non-rotating limit eventually loses its rotational support and collapses to make a black hole. This model has been invoked to account for transient X-ray Fe lines in GRB 991216 by Vietri et al. (2001; see also Lazzati, Campana & Ghisellini 1999), Böttcher & Fryer(2001), and Böttcher, Fryer, & Dermer(2002), and in the context of pulsar wind models for -ray bursts by Königl & Granot(2002) and Wang, Dai & Lu (2002). One drawback of this model is the uncertainty in the initial rotation state and hence the plausibility of the initial “supermassive” neutron star rotation state and the uncertainty of the resulting time to collapse. Nevertheless, our interpretation of the behavior of the flux blueward of the rest frame and its polarization in GRB 021004 has led us to a similar conclusion, that a hydrogen-rich supernova exploded several weeks to months prior to the -ray burst..
Our spectropolarimetry has raised the intriguing possibility that GRB 021004 is associated with a supernova. Whether or not this picture ultimately prevails, these observations clearly show that prompt spectropolarimetry is a powerful tool in the quest to resolve the mystery of the origin of -ray bursts.
References
- Barth et al. (2002) Barth, A. J., Cohen, M. H., Goodrich, R. W., Price, P. A., Bloom, J. S., & Fox, D. W. 2002, GRB Circular Network, 1477, 1
- Böttcher & Fryer (2001) Böttcher, M. & Fryer, C. L. 2001, ApJ, 547, 338
- Böttcher, Fryer, & Dermer (2002) Böttcher, M., Fryer, C. L., & Dermer, C. D. 2002, ApJ, 567, 441
- Castander et al. (2002) Castander, F. J., et al. 2002, GCN Circ. 1599
- Chornock & Filippenko (2002) Chornock, R., & Filippenko, A. V. 2002, GCN Circ. 1605
- Covino et al. (1999) Covino, S. et al. 1999, A&A, 348, L1
- Covino et al. (2002a) Covino, S. et al. 2002a, A&A, 392, 865
- Covino et al. (2002b) Covino, S. et al. 2002b, GRB Circular Network, 1498, 1
- Covino et al. (2002c) Covino, S. et al. 2002c, GRB Circular Network, 1431, 1
- Covino et al. (2002d) Covino, S. et al. 2002d, å, in press (astro-ph/0211245)
- Eracleous et al. (2002) Eracleous, M., et al. 2002, GCN Circ. 1579
- Fox et al. (2002a) Fox, D. W., et al. 2002a, GCN Circ. 1564
- Fox et al. (2002b) Fox, D. W., et al. 2002b, GCN Circ. 1569
- Ghisellini & Lazzati (1999) Ghisellini, G. & Lazzati, D. 1999, MNRAS, 309, L7
- Gruzinov & Waxman (1999) Gruzinov, A. & Waxman, E. 1999, ApJ, 511, 852
- Königl & Granot (2002) Königl, A. & Granot, J. 2002, ApJ, 574, 134
- Lazzati, Campana, & Ghisellini (1999) Lazzati, D., Campana, S., & Ghisellini, G. 1999, MNRAS, 304, L31
- Mirabal et al. (2002) Mirabal, N., Halpern, J. P., Chornock, R., & Filippenko, A. V. 2002b, GCN Circ. 1618 5
- Piro et al. (2000)
- Rol et al. (2000) Rol, E. et al. 2000, ApJ, 544, 707
- Rol et al. (2002) Rol, E., Salamanca, I., van den Berg, M., Homan, J., Kaper, L., Tanvir, N., Levan, A., & Burud, I. 2002, GRB Circular Network, 1512, 1
- Sahu et al. (2002) Sahu, D. K., et al. 2002, GCN Circ. 1587
- Salamanca et al. (2002) Salamanca, I., Rol., E., Wijers, R., Ellison, S., Kaper, L., & Tanvir, N. 2002, GCN Circ. 1611
- Savaglio et al. (2002) Savaglio, S., et al. 2002, GCN Circ. 1633
- Sari (1999) Sari, R. 1999, ApJ, 524, L43
- Shirasaki et al. (2002) Shiraski, Y., et al. 2002, GCN Circ. 1565
- Schaefer et al. (2002) Schaefer B. et al. 2002, ApJ, submitted
- Vietri & Stella (1998) Vietri, M. & Stella, L. 1998, ApJ, 507, L45
- Vietri & Stella (1999) Vietri, M. & Stella, L. 1999, ApJ, 527, L43
- Vietri et al. (2001) Vietri, M., Ghisellini, G., Lazzati, D., Fiore, F., & Stella, L. 2001, ApJ, 550, L43
- Wang, el al. (1996) Wang, L., Baade, D., Höflich, Khokhlov, A., Wheeler, J. C., Kasen, D., Nugent, P. E., Fransson, C., & Lundqvist, P. 2002, ApJ, submitted
- Wang, et al. (1996) Wang, L., Wheeler, J. C., Li, Z., & Clocchiatti, A. 1996, ApJ, 467, 435
- Wang, Dai, & Lu (2002) Wang, X. Y., Dai, Z. G., & Lu, T. 2002, MNRAS, 336, 803
- Wijers et al. (1999) Wijers, R. A. M. J. et al. 1999, ApJ, 523, L33