Candidate Tidal Dwarf Galaxies in the Compact Group CG J1720-67.8111Partly based on data collected at the European Southern Observatory, La Silla, Chile (Proposal 63.N-0737) and at the Anglo Australian Telescope, Siding Spring, Australia (Proposal PATT/02A/24).
Abstract
This is the second part of a detailed study of the ultracompact group CG J1720-67.8: in the first part we have focused the attention on the three main galaxies of the group and we have identified a number of candidate tidal dwarf galaxies (TDGs). Here we concentrate on these candidate TDGs. Absolute photometry of these objects in bands confirms their relatively blue colors, as we already expected from the inspection of optical and near-infrared color maps and from the presence of emission-lines in the optical spectra. The physical conditions in such candidate TDGs are investigated through the application of photoionization models, while the optical colors are compared with grids of spectrophotometric evolutionary synthesis models from the literature. Although from our data self-gravitation cannot be proved for these objects, their general properties are consistent with those of other TDG candidates. Additionally we present the photometry of a few “knots” detected in the immediate surroundings of CG J1720-67.8 and consider the possibility that these objects might belong to a dwarf population associated with the compact group.
1 INTRODUCTION
An often neglected aspect of interaction-induced galaxy evolution is the possibility of formation of dwarf galaxies out of interaction debris. The formation of self-gravitating objects in tidal tails was already announced by Zwicky (1956). However some interest in these objects has started growing only in recent years. Numerical simulations of galaxy encounters support two possible scenarios of tidal dwarf formation. The first one predicts the formation of massive bound condensations dominated by the stellar component along tidal tails and a subsequent infall of gas from the tail into the dwarf’s potential well (Barnes & Hernquist, 1992, 1996). The second one, based on numerical simulations including dissipation for the gaseous component, proposes that the gas condenses first (Elmegreen et al., 1993). Actually, both the stellar and gaseous component are observed in tidal tails and condensations along them. The formation of condensations of gas and stars has been observed especially at the tips of tidal tails. A spectacular example is the one of the “Antennae” (NGC4038/4039, Schweizer, 1978; Mirabel, Dottori & Lutz 1992), but other examples are shown e.g. in Duc et al. (2000) and Weilbacher et al. (2000). These “condensations” in tidal tails of interacting galaxy systems are commonly known as Tidal Dwarf Galaxies (TDGs). They usually share the typical properties of dwarf irregulars and blue compact dwarfs, concerning their surface brightness, blue colors, and strong bursts of star formation, but show somewhat higher metallicities confined in the narrow range 12+(O/H) 8.4 - 8.6 (Duc et al., 2000). This is consistent with their formation from material already processed and chemically enriched in the outer disk of the progenitor galaxies and can be a clue to disentangle dwarf galaxies born as TDGs from the population of field dwarf galaxies. A more restrictive definition of TDGs has been proposed by Duc et al. (2000), who consider a TDG “an object which is a self-gravitating entity, formed out of the debris of a gravitational interaction”. This restricts such a category of objects to the ones having their own dynamics and a potential well deep enough to allow them to survive disruption for at least 1 Gyr.
Actually N-body simulations suggest that a substantial fraction of the material ejected during an interaction and accumulated in the tidal tails will slowly fall back into the remnant, allowing only for the outermost part (e.g., amounting to 20% in the simulation of NGC7252 by Hibbard & Mihos (1995)) to gain enough kinetic energy to escape and evolve independently for a long time. Studies of poor galaxy groups have revealed the presence of a population of dwarf galaxies in them (Zabludoff & Mulchaey, 1998), sometimes considerably increasing the number of group members. Also isolated elliptical galaxies that are considered to be relics of compact groups (CGs) are surrounded by a population of dwarf galaxies (Mulchaey & Zabludoff, 1999). A possible explanation is that part of the dwarf galaxies observed in groups is generated in the groups themselves as a by-product of galaxy interactions in these dense environments. A search for TDGs in CGs led Hunsberger, Charlton, & Zaritsky (1996) to suppose that up to half of the total dwarf population in CGs may be the product of interaction between galaxies. However the study of Hunsberger et al. (1996) suffers from the lack of kinematic information, which makes it difficult to distinguish “real” TDGs from non-self-gravitating condensations in tidal debris. More restrictive identification criteria applied by Iglesias-Páramo & Vílchez (2000) led to the detection of a much lower number of TDGs in CGs. However the study with most complete information on compact groups’ TDGs until present is the one by Mendes de Oliveira et al. (2001), which relies on both photometry and kinematics, but is limited to HCG 92. They identified in HCG 92 seven candidate TDGs, at least two of which are thought to be able to survive fall-backs into or disruption by the parent galaxy.
In this paper we focus our attention on the brightness enhancements and/or blue condensations we identified as possible TDG candidates during a detailed analysis of the compact galaxy group CG J1720-67.8 (Weinberger, Temporin, & Kerber 1999 (Paper I); Temporin et al. 2003 –hereafter Paper II). In particular we perform optical and near-infrared aperture photometry and investigate the physical properties of the identified knots and candidate TDGs through photoionization models calculated with the code Cloudy 90.04 (Ferland, 1996). Considerations about the tidal-tail kinematics are expressed on the bases of spectroscopic data obtained for discrete regions along the tail in addition to integral field spectra sampling its northern part. The optical colors of the candidate TDGs are compared with the grids of spectrophotometric evolutionary synthesis models by Weilbacher et al. (2000).
2 PRIOR OBSERVATIONS AND NEW DATA
Most of the data, on which the present study is based, have already been presented in Paper II, therefore we only briefly list here the observational material at our disposal. Broad band , , and images (900 s, 600 s, and 3600 s exposures, respectively) have been obtained in June 1999 at the ESO 3.6 m telescope in La Silla. A number of broad band images was obtained in the near-infrared (NIR) regime in June 2000 at the 1 m Swope telescope in Las Campanas. The total integration times were 1800 s in the band, 2000 s in and 2500 s in -short (). Details about the reduction steps and the photometric calibration are given in Paper II. The NIR photometric system is described in detail in Persson et al. (1998). For clarity we show in Fig. 1 the identification of the candidate TDGs and knots onto the contour maps of the and -band images of CG J1720-67.8. Spectra of the candidate TDGs were obtained at the 2.5 m Du Pont telescope of Las Campanas with the Modular Spectrograph and at the ESO 3.6 m telescope in La Silla, with EFOSC2, in multi-object mode (MOS). They all show emission lines with radial velocities in agreement with those of the three main galaxies and H II-region like diagnostic ratios (see Table 6 and Fig. 10 in Paper II), although high values of the [S II]/H ratio suggest that shock heating might also be important. Candidate TDGs’ fluxes, the extinction corrected intensities and the estimates of the internal extinction obtained from the Balmer decrement were reported in Table 3 of Paper II (but see also § 4 below). The highest extinction value was found for object no. 3, the candidate TDG at the northern tip of the group’s tidal arc (E(B V) = 0.78 0.42).
Additionally, we make use of velocity information about object 3+9 obtained from recent observations (June 2002) at the 3.9 m Anglo-Australian Telescope with the integral field unit SPIRAL (Segmented Pupil/Image Reformatting Array Lens) and a 600 g/mm grating in the wavelength range 6500 - 7120 Å in combination with the 20484096 13.5 -sized pixels EEV chip.
3 PHOTOMETRIC ANALYSIS
From an examination of the contour maps in Fig. 1, we note that objects 3, 7, 10, and 12 along the tidal arc –selected for showing peaks of intensity over the tidal feature where they are embedded– show some sort of boundaries. No. 9 appears like a secondary peak inside the boundaries of no. 3 –although this could be an effect of insufficient spatial resolution– therefore we consider it as part of object 3 and we will refer to it as object 3+9. No. 8 appears like a secondary peak adjacent to no. 7 and, although it does not show a clear brightness enhancement with respect to the tidal tail, it emerges as a sort of separated knot in the -band image after the application of an adaptive Laplacian filter (Fig. 2), which has the effect of suppressing the noise and enhancing faint structures222The position of faint structures revealed in close proximity of bright sources appears slightly shifted in the filtered image with respect to the original because of boundary effects and depending on the size of the filter adaptive box. Therefore object positions were defined only on the original images. (Richter et al., 1991; Lorenz et al., 1993). No. 5 emerges more clearly as a knot in Fig. 2, while it appears as a diffuse structure connected to galaxy 4 in the contour maps of Fig. 1. This object could be a star-forming small tidal tail or perhaps a vestige of a spiral arm. Its color does not differ from that of galaxy 4, as can be seen in the B Vcolor map of Fig. 3 (obtained as described in Paper II). Finally, no. 11 appears as a knot inside a ring-like (Fig. 2) diffuse structure without any obvious connection with tidal tails. In Fig. 3 all the objects identified along the tidal arc appear bluer than the underlying tidal tail and the adjacent galaxy 4.
Since the features under investigation have irregular elongated shapes, we did not apply traditional circular aperture photometry, which would include too much flux from the surrounding parts of the tidal tail. Instead, we adopted a procedure analogous to the one applied by Weilbacher et al. (2000) and measured total magnitudes inside polygonal apertures. The apertures were defined on the contour plot of the calibrated -band image following the faintest contour, which still allowed to separate each clump from the underlying tidal tail. Therefore the surface brightness level at which the aperture was defined was different for each object and the values are listed in Table 1, together with peak surface brightnesses. The same surface brightness levels were taken as reference to measure the size of the clumps. Due to the elongated shape of the objects, instead of a typical radius we list in Table 1 their minor and major dimensions in kpc, adopting H0 = 75 km s-1 Mpc-1. The same polygonal apertures were applied to the aligned images in the , , , , and bands. The NIR images were first re-binned to match the pixel scale of the optical ones. We chose not to subtract the tidal tail contribution from the objects’ fluxes, but only the sky-background evaluated in several positions as near as possible to the objects of interest. This choice will allow us to compare our photometric data with the evolutionary synthesis models by Weilbacher et al. (2000), which take into account also the old stellar population present in the underlying tidal tail.
The total magnitudes and average surface brightnesses inside the polygonal apertures and the optical and NIR colors of the clumps are listed in Table 2. All the values are corrected for Galactic extinction (E(B V) = 0.088). We find optical colors ( 0.65 - 0.85) consistent with those of HCG 92’s TDG candidates (Mendes de Oliveira et al., 2001). Due to the difficulty to define a clear boundary for the knot no. 5 we give only its surface brightness and colors, but not its total magnitude. For comparison purposes we list also the average surface brightness and colors of two portions of the tail measured between the clumps. The brightness of the tail increases slightly from North to South. Typical photometric errors in total optical magnitudes range from 0.002 to 0.01 mag, therefore the calibration error ( 0.05, see Paper II) is dominating. In the NIR photometric errors are typically 0.1 - 0.2 mag but reach 0.6 mag for the faintest objects, nos. 8 and 11, which could not be measured in the Ks frame.
Although for the candidate TDGs nos. 3+9 and 7 we could estimate a significant amount of internal extinction from the Balmer decrement (see Paper II, Table 3), the error in this extinction measurement is high, therefore we preferred not to apply any internal extinction correction to the magnitudes of these objects. We obtained the following luminosities of the candidate TDGs (including the light from the underlying tidal tail): MB(3+9) = 17.46, MB(7) = 17.06, MB(8) = 13.93, MB(10) = 15.86, MB(12) = 15.35, and MB(11) = 14.39. We note that the above luminosities are comparable or higher than those found by Mendes de Oliveira et al. (2001) in the candidate TDGs’ sample of Stephan’s Quintet and those of TDG candidates in interacting systems identified by Weilbacher et al. (2000). The two brightest TDG candidates have luminosities higher than the brightest H II regions measured in Sc galaxies by Bresolin & Kennicutt (1997) and more typical of giant extragalactic H II regions (Mayya, 1994). However, the comparison with H II region properties is made difficult by the different methods of measurement used in the present work and in the literature. In particular, we need to emphasize that, unlike most published photometric measurements of extragalactic H II regions, we have used interactively defined polygonal apertures and we did not subtract the flux contributed by the tidal tail, where the knots are embedded, as explained above. We will further discuss this point later, in § 5.
3.1 Other “Knots” in the Close
Environment of the Group
A number of additional irregularly shaped, faint knots have been identified in the close environment of CG J1720-67.8, and in particular inside its halo. Their nature is unclear and we have not yet obtained spectral information on them. However, at least for part of them, we could measure aperture magnitudes in the optical images. In this case we used circular apertures and evaluated the sky background in an annulus around each object. These knots are labeled with small-case letters onto the Laplacian filtered R-band image in Fig. 2. Their optical magnitudes and colors are listed in Table 3.
Some of these objects might belong to a population of dwarf galaxies associated with the compact group, however deeper data and spectral information are necessary to understand it. At present, the group’s members among these cannot be distinguished from background objects due to the lack of radial velocity information, although their colors could be consistent with background galaxies (see § 6).
4 SPECTRAL PROPERTIES AND
PHOTOIONIZATION MODELS
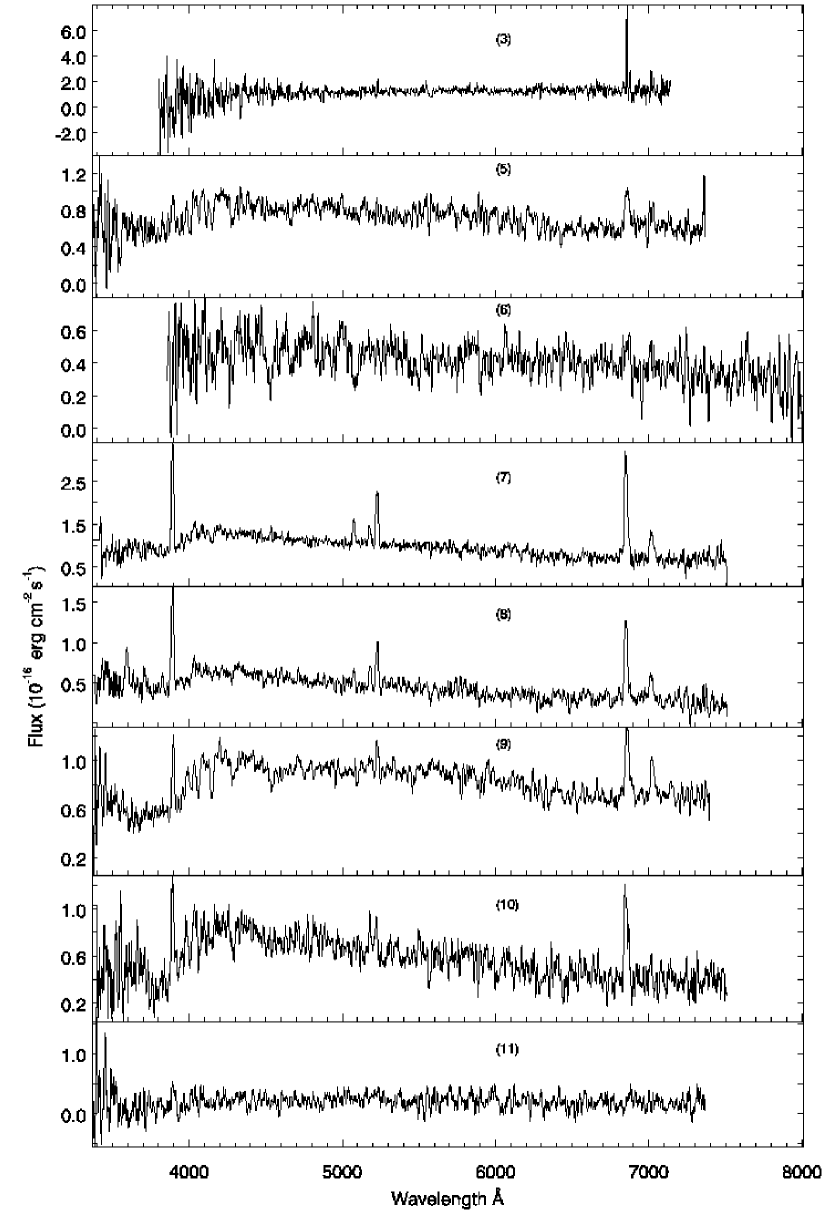
The spectra of the candidate TDGs (nos. 3, 7, 8, 9, 10) and of additional knots of CG J1720-67.8 (nos. 5, 11) all show a blue continuum (Fig. 4), and some of them exhibit remarkable Balmer absorption lines in addition to the emission lines typical of H II regions. Therefore all their spectral properties agree to indicate a dominating young stellar population and an activity of current/recent star formation. As already noticed in Paper II, Veilleux & Osterbrock’s (1987) (VO-)diagnostic diagrams applied to these objects confirm that their gas is photoionized by thermal sources –although a certain degree of ionization by shock-heating cannot be excluded. Also the spectrum of the portion no. 6 of the arc shows Balmer absorption lines and weak emission lines (H, [N II], and [S II]), indicating that a low level of star formation is present in the tidal tail as well, together with an older stellar population.
Given the thermal nature of the ionizing source, the H emission-line luminosity, after correction for internal extinction, could be used to evaluate the star formation rate (SFR) of these objects. In the spectra nos. 5 and 6, only a few emission lines were detected, i.e. the blend H-[N II], the [S II] doublet, and –for object 5– [O II] 3727. These were insufficient to locate the regions in the VO-diagnostic diagrams and the lack of a measurable H prevented the estimate of the internal extinction. In this case we used the uncorrected H luminosities for the SFR estimate. The star formation rates calculated following Hunter & Gallagher (1986) are listed in Table 4. They range from 0.004 to 0.82 M⊙ yr-1, with star formation rate densities (SFRD) of 0.05 to 14.15 M⊙ yr-1 pc-2, the highest value being found for the candidate TDG no. 3333The emission line fluxes of object no. 3, as well as the extinction value, are the ones reported in Paper II, Table 3. These values are somewhat different from those reported in Paper I, Table 1 because of a redefinition of the aperture in which they were measured. Additionally, we point out a mistake in Paper I, Table 2, by which all the values referred to this object are too low. and the lowest for knot no. 5. These SFR values are comparable to those of the TDGs identified in HCG 92 (Mendes de Oliveira et al., 2001).
The observed emission-line ratios were used to infer the physical and chemical properties of the ionized gas.
TDGs are expected to have higher metallicities than typical field dwarf galaxies, since they form out of already enriched material ejected by the parent galaxies. Since in none of the candidate TDGs the [O III] 4363 emission-line was detected, a direct measurement of the electronic temperature of the emitting gas –necessary for the calculation of the metal abundances of the gaseous component– was not possible. Therefore, in analogy with the method adopted for the three main galaxies of CG J1720-67.8 (Paper II), we obtained a first estimate of the metal abundances of the candidate TDGs by comparing their emission line ratios with the empirical diagrams of McGaugh (1991) and Denicoló et al. (2002). From the comparison with the grid of models of McGaugh (1991) in the plane [O III]/[O II] vs R23 (R23 = [([O II] 3727 + [O III] 4959,5007)/H]) we found that all the candidate TDGs have an ionization parameter in the range 3.5 U 3. The metal abundances, represented by the O/H ratio, result in the range 3.9 (O/H) 3.5 for objects nos. 7, 8, and 9 and have the two possible values (O/H) 4.1 or (O/H) 3.2 for no. 10. Object no. 3 could not be compared with these model grids, because the [O II] 3727 was not detected in its spectrum. All the candidate TDGs could be compared with the monotonic relation 12+(O/H) vs ([N II] 6583/H) (Denicoló et al., 2002). By referring to the model track with U = 3.0 (Denicoló et al., 2002, Fig. 1), we found metallicity values in rough agreement with the lowest values given above –i.e. with the lower branch of the R23 - (O/H) relation in McGaugh (1991)– namely (O/H) 3.7 for objects 3, 8, and 9, (O/H) 3.8 for object 7, and (O/H) 3.9 for object 10, or, in other words, Z 0.2 - 0.3 Z☉444As values for solar abundances we used O/H = 7.4110-4, N/H = 9.3310-5, and S/H = 1.6210-5.. These estimates were further refined by fitting the observed emission line ratios with photoionization models by use of the code Cloudy 90.04 (Ferland, 1996). During the fits the hydrogen density NH and the ionization parameter U were let free to vary, while as a typical temperature of the thermal ionizing continuum we assumed T = 4104 K. Several models were tried with slightly different metallicity values, until the reproduction of the observed line ratio was satisfactory (we chose the models with lowest ). The final photoionization model parameters are given in Table 5, while in Table 6 the observed and modeled emission-line intensities relative to H are compared. However, also with this procedure the metal abundances of objects 7, 8, and 9 could not be uniquely determined. Actually photoionization models with physical parameters similar to those given in Table 5 but somewhat lower metal abundances would offer a comparably good, or even better fit to the observed line ratios. The parameters of these alternative models are shown in Table 7.
To summarize, our candidate TDGs show recent/present star formation activity, and their gaseous component exhibits an ionization parameter U in the range 410-4 - 710-4, a hydrogen density NH in the range 1 - 2102 cm-3, and metal abundances Z 0.1 Z☉ for object 10 and Z 0.3 Z☉ for objects 3, 7, 8, and 9, although somewhat lower abundances for the last three might be possible. Especially object 7 could have Z 0.1 Z☉, but with an overabundance of oxygen and sulphur, which appear to be roughly a third of the solar value. As a comparison we recall here the metal abundances obtained for the three main galaxies of CG J1720-67.8 (Paper II): Z 0.2 Z☉ for galaxy 1, Z 0.5 Z☉ for galaxy 2, and Z 0.1 Z☉ for galaxy 4.
4.1 Velocity Field of the Northern Tip of the Tidal Arc
During June 2002 observations at the Anglo-Australian Telescope equipped with SPIRAL we obtained integral field spectra of the upper part of the tidal arc, where the candidate TDG 3+9 is located. The object was covered with an array of 1415 microlenses giving a field of view of 9′′.810′′.5 with a spatial scale of 0.7 arcsec per microlens per pixel. The position of the array onto the R-band image of the group is shown in Fig. 5 (left). The observations were carried out with the nod and shuffle technique in order to provide an optimal subtraction of the sky-background. The total exposure time was 1 hour, half of which was spent on target and the other half on sky. The wavelength range was centered on the redshifted H line. The 600R grating combined with the EEV CCD-chip gave a dispersion of 0.612 Å pixel-1. The average spectral resolution was in the range 1.8 - 2.3 Å with the lowest values in the central part of the array and highest values at the borders. The basic reduction steps –involving the tracing of the fibres by use of a flat-field frame, bias subtraction, flat-fielding, wavelength calibration, sky subtraction, and combination of subsequent exposures– were done with the dedicated software 2dfdr555Available at http://www.aao.gov.au/2df/software.html, Version 2.3, provided by the Anglo-Australian Observatory. This software allows also the image reconstruction at a specified wavelength or in a specified wavelength range and was used to reconstruct an Hcontinuum image of the field in the range 6800 – 6900 Å for object identification purposes. This image was resampled onto a grid of 5660 pixels (i.e. 4 times larger than the original) and smoothed with a 44 pixel box for viewing purposes (Fig. 5, right).
Further analysis of the data was carried out within IRAF. Specifically, for each spectrum where the H emission line was detected we obtained a radial velocity measurement (through Gaussian fit of the emission-line) in order to reconstruct the velocity field of the source. The average calibration error, evaluated from position measurements of OH night-sky lines (Osterbrock et al., 1996), is 2.9 km s-1. No systematic trends of the error were detected across the 1415 array of spectra. The result is shown in Fig. 6. On the left-hand panel the original reconstructed continuum image (without resampling) shows object 3+9 in the center and portions of galaxies 2 and 4 at the right edge. On the central image the velocity field, with indicated the maximum and minimum measured radial velocities of the object 3+9, shows a velocity gradient in direction NE-SW (the north-eastern part being the receding one) across the object, with a maximum velocity difference of 200 km s-1 over an extent of 5 kpc. The velocity field is shown also after magnification and resampling (Fig. 6, right-hand panel) and can be compared with Fig. 5. There might be several possible explanations for such a gradient (see e.g. Weilbacher, Duc, & Fritze-v. Alvensleben, 2002), like streaming motion along the tidal tail, projection effects, or even rotational motion. We lack detailed information on the radial velocity gradient along the tidal tail, apart from the discrete measurements in correspondence of objects 7, 8, and 10 that indicate that the southern part of the tail is approaching us (radial velocity 13200 km s-1) and showing a velocity difference 400 km s-1 between the tips of the tail. However, the TDG candidate 3+9 is located at the base of the tail, where tidal streaming and geometric effects are most extreme (see e.g. the case of the merger remnant NGC 7252 Hibbard & Mihos, 1995, their Fig. 1). Such effects are likely to be responsible for the observed gradient. Even though, the presence of a rotational motion cannot be ruled out. If the velocity gradient of object 3+9 was actually entirely caused by rotation, it would imply a dynamical mass M 6109 M⊙, comparable to the mass estimated for the group’s galaxy no. 1 (Temporin & Fritze-von Alvensleben, 2002). This mass, combined with the -band luminosity given in § 3, would yield a mass-to-light ratio Mdyn/LB 4. However, also in case of self-gravitation, the object is unlikely to be in a relaxed state, therefore the application of the virial theorem could lead to a considerable overestimate of its mass.
5 COMPARISON WITH PROPERTIES
OF EXTRAGALACTIC
H II REGIONS
In the attempt to understand the real nature of the knots in CG J1720-67.8 and to investigate alternative possibilities to the TDG candidate hypothesis, we compare their optical properties with those of normal and giant extragalactic H II regions (GEHR) present in the literature. As already stated in § 3, some difficulties in such a comparison arise as a consequence of different methods of measurement. In particular the background subtraction is critical when comparing photometric properties. Since most of the published optical photometry of H II regions is obtained by subtracting the contribution of the underlying galaxy components (i.e. disk, spiral arms), we have estimated the contribution of the tidal tail to the light of our TDG candidates in the bands and subtracted it from the measured fluxes of the knots. The new set of background-subtracted magnitudes and colors is shown in Table 8. The background of each knot was estimated by averaging the mean value inside a number of 1010 pixel boxes selected all around the polygonal aperture used for the photometry, taking care to avoid the inclusion of adjacent knots. We stress that the background around the knots has strong gradients, especially at the tips of the tidal tail. Therefore, although an as large as possible number of boxes was used for its estimate, the final values we adopted have uncertainties in the range 12 – 40 per cent. We found that the tidal tail contributes to the flux in the clumps by 45 to 60 per cent in , 55 to 68 per cent in , and 52 to 70 per cent in . The highest percentages are found in the central parts of the arc, while the lowest at the tips of the arc. The maximum contribution from the tail is observed in the band and the minimum in the band. Such a differential contribution determines the difference between the colors given in Table 2 and those in Table 8.
The B Vand V R colors given in Table 8 can be compared with those measured by Mayya (1994) for GEHR in a sample of nearby spiral and irregular galaxies. Median colors of GEHRs and GEHR groups in Mayya’s sample are B V= 0.21, V R= 0.48 and B V= 0.30, V R= 0.44, respectively, which are consistent with the values we found for our clumps. Actually in Mayya (1994, Table 3) there are several examples of GEHRs with colors very similar to those in our Table 8. However, their H equivalent widths (WHα) are much higher than the ones we measured in the spectra of our clumps (Table 4). Furthermore the sizes of GEHRs are 1.5 kpc, while the clumps in CG J1720-67.8 are considerably more extended (see Table 1).
The properties of the first ranked H II regions in a sample of nearby spiral and irregular galaxies were studied by Kennicutt (1988) through H photometry. The brightest (“giant” or “supergiant”) H II regions in Kennicutt’s sample were found almost exclusively in late-type normal galaxies or in peculiar galaxies, and the question “whether they simply represent the high-luminosity tail of the normal H II region luminosity function or are a physically distinct class of objects formed under special conditions” appears to remain unanswered. H luminosities of these regions are in the range 1039–1041 ergs s-1 and the masses of the embedded star clusters, calculated assuming a Salpeter IMF and including only stars with masses 10–100 M⊙, were expressed as M★ = 3600 L39 M⊙ (where L39 is the H luminosity in units of 1039 ergs s-1), while the ionized gas mass was found to scale roughly linearly with H luminosity (at least for the largest H II regions), although the actual value depends on the density according to the relation Mgas = 2.3106 L39/.
By applying the above relations to our TDG candidates –using their extinction-corrected, spectroscopically determined, H luminosities given in Table 4 and the hydrogen densities given in Table 5– we find masses of the embedded clusters ranging from 4104 M⊙ (object 10) to 5105 M⊙ in the brightest knots at the tips of the tail and ionized gas masses ranging from (object 10) to 4 M⊙ (object 3+9). These are only rough estimates and the actual mass values could be larger, since we have used here H luminosities from long-slit spectra, which covered big fractions, but not the full extent of the objects. For comparison, the H luminosity of the position 6 along the tidal tail would yield M★ 104 M⊙ and Mgas of order 105 M⊙ (in this case the density could not be determined and the ionized gas mass is estimated through Kennicutt (1988) empirical relation). The equivalent ionizing luminosity of object 3+9 reaches 1053 photons s-1 (after correction for internal extinction).
The properties of the knots along (and especially at the tips of) the tidal arc are comparable to those of the giant and supergiant extragalactic H II regions of Kennicutt’s sample. We note that H luminosities given in Kennicutt (1988) are not corrected for internal extinction, unlike those in our Table 4. However, also before the extinction correction our TDG candidates have H ergs s-1.
A comparison of H equivalent widths given in Kennicutt, Keel, & Blaha (1989, their Fig. 6) with those in Table 4 shows that our TDG candidates are located at the lower limit of the range found for disk H II regions. Furthermore the value measured in the spectrum no. 9 is extremely low and similar to the values measured in spectra nos. 5 and 6. This could indicate a non-negligible contribution to the stellar continuum from an underlying evolved stellar population.
6 COMPARISON WITH TDG
EVOLUTIONARY SYNTHESIS
MODELS
The lack of detailed kinematic information (except for the low-resolution velocity field of the ionized gas in object 3+9) prevent us from establishing which, if any, of the candidate TDGs we have identified are actually self-gravitating objects –i.e. TDGs in the most rigorous meaning of the term– or simply clumps of gas and stars, which are still bound to the tidal tail where they have formed and might eventually evolve into TDGs. Even though, evolutionary synthesis models have proved useful to discriminate between candidate TDGs or TDG progenitors and background objects, and also to estimate the ratio of old to young stellar mass in them (Weilbacher et al., 2000). Therefore we compare here the observational properties of our candidate TDGs with the grids of evolutionary synthesis models published in Weilbacher et al. (2000). They have obtained models for two different metallicities, in the range expected for TDGs, i.e. Z1 Z☉/18 and Z3 Z☉/2.3, by use of an evolutionary code based on the work of Krüger, Fritze-v. Alvensleben, & Loose (1995). Their models assume for TDGs the same undisturbed evolutionary history of the parent galaxies until the onset of the interaction-induced starburst. A Scalo (1986) initial mass function is assumed. In the burst the SFR is set to a maximum value and decreases exponentially with a timescale .
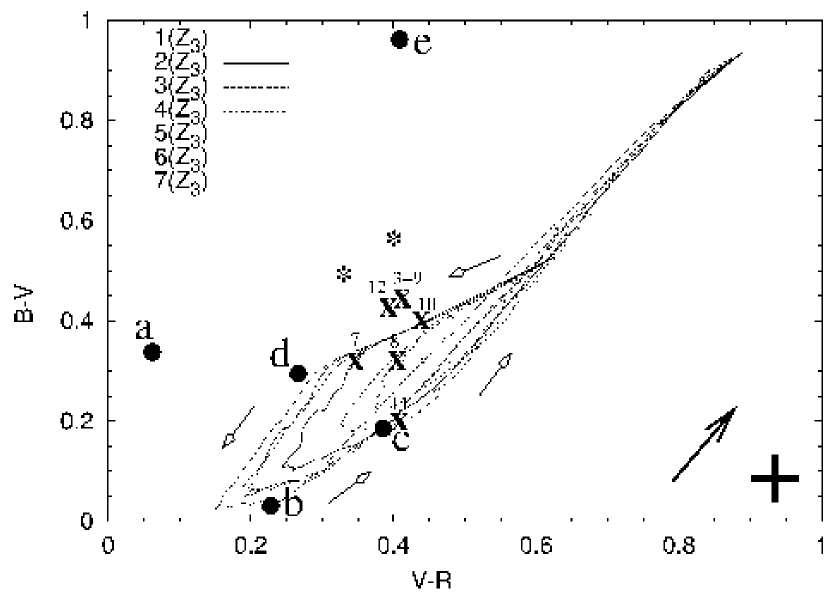
The grids of evolutionary models obtained by Weilbacher et al. (2000) for different burst strengths are represented by counter-clockwise loops in the B V V R two-color diagram. Since we have found that our candidate TDGs have metallicities in the range 0.1 Z☉ Z 0.3 Z☉, and in particular oxygen abundances O/H 0.35 (O/H)☉, we have compared their optical colors with the Z3 models from Weilbacher et al. (2000). The observed colors of our candidate TDGs are marked in Fig. 7 onto the two-color diagram adapted from Fig. 1c of Weilbacher et al. (2000). Values corrected only for foreground Galactic extinction are marked with crosses. Artificial data-points (labeled “a”, “b”, “c”, “d”, and “e”) from Weilbacher et al. (2000) are plotted, as well (full circles). In particular point “b” corresponds to a burst strength 0.1 and a burst age 20 Myr, point “c” indicates a medium to strong burst of much higher age ( 80 Myr), while point “d” corresponds to a burst age of 7 Myr or less, depending on the metallicity. Most of our data-points fall into a region of the two-color diagram where tracks of different models overlap, namely the part of the tracks with burst ages of only a few Myrs. This would indicate that such objects have just started their bursts of star formation. However, the application of a correction for internal extinction would move the points in the diagram toward older burst ages, reaching the region occupied by the artificial data-point “b”, or it would imply stronger bursts. Older burst ages would be in agreement with the observed H equivalent widths (Table 4), which are not as high as expected and observed in case of very young (age 2 - 3 Myr) H II regions (see e.g. Bresolin & Kennicutt, 1997). However, the Balmer emission-line equivalent width could be lowered as an effect of the presence of an underlying population of stars older than those responsible for the ionization and contributing to the stellar continuum. Internal extinction affecting the emission lines but not the continuum could also play a role in lowering the equivalent width (e.g. Mayya & Prabhu, 1996).
Although it is not possible to establish the appropriate duration and strength of the bursts due to the similarity of models with in the range 0.05 – 0.18 and 5105 – 1106 yr, object 8 appears consistent with a weaker burst with respect to the other TDG candidates. Object 11, a condensation in a ring-like structure on the west side of the group, falls near the artificial datapoint “c”, suggesting a much higher burst age. This could be a condensation formed in an already fading tidal tail.
Supposing that these TDG candidates will evolve following the tracks in Fig. 7, they will become still bluer during the next few Myr, then they will become progressively redder, reaching after 1 Gyr the pre-burst colors. Unless new bursts of star formation are triggered, the objects will progressively fade during their evolution. Their fading can be quantified by comparison with the luminosity evolution modeled by (Weilbacher et al., 2000), which shows a rapid luminosity decrease in the first 50 Myrs after the maximum of the burst. In the hypothesis that they have reached the maximum luminosity at the present epoch, they will fade by about 3.5 mag within 2 Gyr. Therefore the brightest clump, no. 3+9, would reach MB 14 and it would be still observable, with an apparent magnitude 22.3. In the same time, the faintest object, no. 8, would fade to 25.9 mag and would be visible only in very deep exposures. Object, no. 11, according to its estimated burst age of 80 Myr, should have already faded by 2.2 mag with respect to the luminosity peak reached during the burst phase and its luminosity is expected to decrease by another 1.3 mag in the next 1.9 Gyr, down to 23.2 mag.
7 DISCUSSION AND CONCLUSION
We have presented photometric and spectroscopic observational data of a number of knots and candidate TDGs previously identified (Paper I and Paper II) at the ends of and along the tidal features and in the halo of the ultracompact group CG J1720-67.8. Although we are not able to establish whether the clumps along the tidal tail are already self-gravitating objects because of the lack of kinematic information –with the possible exception of object 3+9 whose velocity field shows a regular velocity gradient– we have found that their properties are consistent with those expected for TDGs or TDG progenitors. Namely, they show blue colors, recent and/or present-day star formation activity, and relatively high oxygen abundances with respect to field dwarf galaxies. The same properties would also be consistent with star formation within the tail. Indeed we have detected a low level of star formation in a region of the tail where no visible knots are present (position no. 6) and the moderately blue colors of the tail suggest that some degree of star formation is present all along it. However the star-forming clumps we have identified as candidate TDGs clearly appear as substructures and condensations within the tail and have colors significantly bluer than the surrounding regions. Moreover their luminosities are considerably higher than those typical of normal H II regions in spiral galaxies and more typical of GEHRs. Optical colors as well, once a correction for contamination from the tidal tail material has been applied, are in agreement with those of GEHRs (Mayya, 1994). Actually, optical colors are not sufficient to discriminate between (giant) H II regions and TDGs.
The sizes of most of our candidate TDGs are considerably larger than those of the most extended GEHRs, which reach at most 1.5 kpc (e.g. Kennicutt, 1988). Instead they have dimensions typical of dwarf galaxies (see e.g. Elmegreen et al., 1996) and comparable to those of the candidate TDGs in Stephan’s Quintet (Mendes de Oliveira et al., 2001). Only object no. 8, judging from its size, might be interpreted as a giant H II region. At the seeing of our observations, the spatial resolution element is 1 kpc, which means that a giant H II region would barely be resolved, while the clumps we observe appear clearly extended. Some of them –e.g. nos. 10 and 12 that appear less concentrated than the objects at the tips of the tail– could be complexes of H II regions, which appear as an individual clump due to insufficient spatial resolution. However, if such complexes form in the tail, their potential well might result deep enough for them to become bound objects that eventually can evolve as dwarf galaxies, provided their mass is sufficient. In such a case they could be considered as TDGs in the process of formation. The presence itself of structures in the tail suggests that self-gravitation might play some role. Whether or not the clumps of stars and ionized gas are to become bound objects and even accrete more matter from their surroundings, depends on their having enough mass to survive fall-back into the parent galaxies and tidal disruption (Hibbard et al., 1994).
The measured optical colors of our candidate TDGs are consistent with evolutionary synthesis tracks calculated for TDGs in the expected metallicity range (Weilbacher et al., 2000). The positions in the two-color diagrams, when compared with evolutionary tracks, suggests that the objects identified along the group’s tidal arc have burst ages of a few Myr, while the blue knot no. 11 embedded in a ring-like structure in the group’s halo is consistent with a much older burst age ( 80 Myr). However, the location of the objects in the two-color diagram might be strongly affected by internal extinction, which has not been taken into account due to the high uncertainty in its determination. The effect could be relevant especially for the objects at the tips of the tail, where indications of higher extinction are found. The application of an internal extinction correction would move the observational points toward higher burst ages (up to 20 Myr) in the model tracks, thus offering a possible explanation to the relatively low observed H equivalent widths.
If a luminosity evolution analogous to the one modeled by Weilbacher et al. (2000) is assumed, the identified TDG candidates should fade to values of the luminosity still detectable after 2 Gyr of evolution, provided they survive as bound objects.
A comparison of the metallicities of the candidate TDGs with those of the three main galaxies in the group does not easily allow to understand which one is the parent galaxy. Actually object no. 10 is the one with lowest metallicity, in agreement with the metal abundances of galaxy 4 (Paper II). For the other objects the metallicity value is uncertain, although it seems established that their oxygen abundance is approximately a third of the solar one, therefore higher than that of galaxy 4. Their parent galaxy might be no. 1, which exhibits somewhat higher abundances.
A quantitative estimate of the possibility for these objects to survive as individual galaxies against internal motion and tidal forces exerted by the parent galaxies would require an estimate of their virial and tidal masses (Mendes de Oliveira et al., 2001). The first cannot be derived with the presently available data, the latter would require knowledge of the mass interior to their orbit. Since this mass is not known, we limit ourselves to a few qualitative considerations. We have found that the object composed of no. 3 and no. 9 (considered together) is the brightest of the proposed candidate TDGs. It’s velocity gradient, if actually due to rotation, would imply a mass comparable to the one estimated for galaxy 1 (Temporin & Fritze-von Alvensleben, 2002). If this was the case, its mass could be sufficient for it to escape tidal disruption, despite its unfavorable position in the tidal feature, very nearby to the parent galaxies. However, the observed velocity gradient could be an effect of streaming motion in combination with projection effects, which can be extreme at the base of the tidal tail. Therefore, no conclusive argument can be given at present. Object no. 7, although less bright and therefore presumably less massive, seems to be in a more favorable location to survive tidal disruption.
In principle NIR photometry, when combined with optical photometry and equivalent width measurements, should help at least to understand whether the modest luminosity enhancements of our TDG candidates with respect to the surrounding regions of the tidal tail indicate an actual increase of the underlying mass density –as expected in case of distinct dynamical entities– and not only an increase of the luminosity as a consequence of the burst of star formation. However the question cannot be addressed in a straightforward manner. Not only the optical (especially ) luminosity is influenced by the recent star formation activity with consequent changes in the M/L ratio, but also the NIR luminosity is affected, although in smaller measure. Therefore accurate evolutionary synthesis models, with adequate time resolution, are necessary for a meaningful interpretation of the data. Additionally, the uncertainty in the burst strength and age determination, partly caused by uncertainty in the internal extinction determination as explained above, further complicates the matter. We will attempt to address this question in a future work.
At present, on the base of the analysis presented here, we can only conclude that the two objects at the tips of the tidal tail (3+9 and 7) appear to be the most promising TDG candidates of the galaxy group.
References
- Barnes & Hernquist (1992) Barnes, J. E. & Hernquist, L. 1992, Nature, 360, 715
- Barnes & Hernquist (1996) Barnes, J. E. & Hernquist, L. 1996, ApJ, 471, 115
- Bresolin & Kennicutt (1997) Bresolin, F. & Kennicutt, R. C. Jr. 1997, AJ, 113, 975
- Elmegreen et al. (1996) Elmegreen, B. G., Elmegreen, D. M., Salzer, J. J., & Mann, H. 1996, ApJ, 467, 579
- Elmegreen et al. (1993) Elmegreen, B. G., Kaufman, M., & Thomasson, M. 1993, ApJ, 412, 90
- Denicoló et al. (2002) Denicoló, G., Terlevich, R., & Terlevich, E. 2002, MNRAS, 330, 69
- Duc et al. (2000) Duc P. A., Brinks, E., Springel, V., Pichardo, B., Weilbacher, P., & Mirabel, I. F. 2000, AJ, 120, 1238
- Ferland (1996) Ferland, G. 1996, Hazy, a Brief Introduction to Cloudy 90.04, Univ. of Kentucky, Department of Physics and Astronomy, Internal Report
- Hibbard et al. (1994) Hibbard, J. E., Guhathakurta, P., van Gorkom, J. H., & Schweizer, F. 1994, AJ, 107, 67
- Hibbard & Mihos (1995) Hibbard, J. E. & Mihos, J. C. 1995, AJ, 110, 140
- Hunsberger et al. (1996) Hunsberger, S. D., Charlton, J. C., & Zaritsky, D. 1996, ApJ, 462, 50
- Hunter & Gallagher (1986) Hunter, D., A. & Gallagher, J. S. 1986, PASP, 98, 5
- Iglesias-Páramo & Vílchez (2000) Iglesias-Páramo, J. & Vílchez, J. M. 2001, ApJ, 550, 204
- Kennicutt (1988) Kennicutt, R. C. Jr. 1988, ApJ, 334, 144
- Kennicutt, Keel, & Blaha (1989) Kennicutt, R. C. Jr., Keel, W. C., & Blaha, C. A. 1989, AJ, 97, 1022
- Krüger, Fritze-v. Alvensleben, & Loose (1995) Krüger, H., Fritze-v. Alvensleben, U., & Loose, H.-H. 1995, A&A, 303, 41
- Lorenz et al. (1993) Lorenz, H., Richter, G. M., Capaccioli, M., Longo, G. 1993, A&A, 277, 321
- Mayya (1994) Mayya, Y. D. 1994, AJ, 108, 1276
- Mayya & Prabhu (1996) Mayya, Y. D. & Prabhu, T. P. 1996, AJ, 111, 1252
- McGaugh (1991) McGaugh, S. S. 1991, ApJ, 380, 140
- Mendes de Oliveira et al. (2001) Mendes de Oliveira, C., Plana, H., Amram, P., Balkowski, C., & Bolte, M. 2001, AJ, 121, 2524
- Mirabel et al. (1992) Mirabel, I. F., Dottori, H., & Lutz, D. 1992, A&A, 256, L19
- Mulchaey & Zabludoff (1999) Mulchaey, J. S., & Zabludoff, A. I. 1999, ApJ, 514, 133
- Osterbrock et al. (1996) Osterbrock, D. E., Fulbright, J. P., Martel, A. R., Keane, M. J., Trager, S. C., & Basri, G. 1996, PASP, 108, 277
- Persson et al. (1998) Persson, S. E., Murphy, D. C., Krzeminski, W., Roth, M., & Rieke, M. J. 1998, AJ, 116, 2475
- Richter et al. (1991) Richter, G. M., Lorenz, H., Böhm, P., & Priebe, A. 1991, Astron. Nachr., 312, 345
- Scalo (1986) Scalo, J. M. 1986, Fund. Cosmic Phys., 11, 1
- Schweizer (1978) Schweizer, F. 1978, in IAU Symp. No. 77, The Structure and Properties of Nearby Galaxies, ed. E. M. Berkhuijsen and R. Wielebinski (Reidel, Dordrecht), 279
- Temporin & Fritze-von Alvensleben (2002) Temporin, S. & Fritze-von Alvensleben, U. 2002, ApJ, submitted
- Temporin et al. (2003) Temporin, S., Weinberger, R., Galaz, G., & Kerber, F. 2003, ApJ, 584, in press (ApJ Preprint doi:10.1086/345535; Paper II)
- Veilleux & Osterbrock (1987) Veilleux, S. & Osterbrock, D. E. 1987, ApJS, 63, 295
- Weilbacher, Duc, & Fritze-v. Alvensleben (2002) Weilbacher, P. M., Duc, P.-A., Fritze-v. Alvensleben, U. 2002, A&A, in press (astro-ph/0210393)
- Weilbacher et al. (2000) Weilbacher, P. M., Duc, P.-A., Fritze von Alvensleben, U., Martin, P., & Fricke, K. J. 2000, A&A, 358, 819
- Weinberger, Temporin, & Kerber (1999) Weinberger, R., Temporin, S., & Kerber, F. 1999, ApJ, 522, L17 (Paper I)
- Zabludoff & Mulchaey (1998) Zabludoff, A. I., & Mulchaey, J. S. 1998, ApJ, 496, 39
- Zwicky (1956) Zwicky, F. 1956, Ergeb. d. exakten Naturwiss., 29, 344


| Object ID | Aperture | Peak | |
|---|---|---|---|
| 39 | 22.35 | 21.80 | 6.52.0 |
| 5 | 22.47 | 2.01.1 | |
| 7 | 22.24 | 21.780 | 4.92.5 |
| 8 | 22.48 | 22.35 | 1.30.6 |
| 10 | 22.25 | 22.03 | 3.51.4 |
| 11 | 23.54 | 2.21.7 | |
| 12 | 22.26 | 22.14 | 4.51.7 |
Note. — Aperture and peak are in mag arcsec-2, and are the major and minor dimension of the clumps expressed in kpc; all surface brightness values are corrected for Galactic extinction.
| Object ID | B V | V R | ||||||||||
|---|---|---|---|---|---|---|---|---|---|---|---|---|
| 39 | 18.72 | 0.44 | 0.41 | 2.16 | 0.66 | 0.25 | 22.07 | 21.63 | 21.22 | 20.13 | 19.47 | 19.22 |
| 5 | 0.58 | 0.43 | 2.22 | 0.74 | 0.21 | 22.40 | 21.81 | 21.38 | 20.33 | 19.59 | 19.38 | |
| 7 | 19.22 | 0.31 | 0.35 | 1.87 | 0.68 | 0.05 | 22.04 | 21.74 | 21.39 | 20.55 | 19.86 | 19.81 |
| 8 | 22.35 | 0.31 | 0.40 | 2.12 | 0.88 | 22.44 | 22.14 | 21.73 | 20.90 | 20.02 | ||
| 10 | 20.42 | 0.41 | 0.43 | 2.01 | 0.73 | 0.25 | 22.17 | 21.76 | 21.32 | 20.49 | 19.75 | 19.50 |
| 11 | 21.89 | 0.19 | 0.41 | 1.87 | 0.90 | 23.36 | 23.17 | 22.75 | 22.20 | 21.30 | ||
| 12 | 20.93 | 0.43 | 0.39 | 1.99 | 0.55 | 0.54 | 22.22 | 21.79 | 21.40 | 20.41 | 19.80 | 19.26 |
| arc1 | 0.56 | 0.40 | 1.74 | 0.73 | 0.29 | 22.47 | 21.91 | 21.51 | 20.42 | 19.69 | 19.40 | |
| arc2 | 0.50 | 0.33 | 1.28 | 0.62 | 0.55 | 22.34 | 21.81 | 21.51 | 20.67 | 20.05 | 19.50 |
Note. — All values are corrected for Galactic extinction. The measurements of two positions along the arc between the clumps are indicated with arc1 and arc2 from North to South.
| Object ID | B V | V R | |||
|---|---|---|---|---|---|
| a | 24.33 | 22.03 | 21.22 | 2.30 | 0.82 |
| b | 20.06 | 19.32 | 18.85 | 0.74 | 0.46 |
| c | 21.89 | 20.75 | 20.21 | 1.13 | 0.54 |
| d | 21.64 | 20.59 | 20.09 | 1.05 | 0.50 |
| e | 21.49 | 20.48 | 19.88 | 1.01 | 0.60 |
Note. — The listed values are corrected for Galactic extinction.
| Object ID | LHα | WHα | Qion | N(O5) | SFR | SFRD | ||||
|---|---|---|---|---|---|---|---|---|---|---|
| (1040erg s-1) | (Å) | (1052 phot. s-1) | (M⊙ yr-1) | (10-8 M⊙ yr-1 pc-2) | ||||||
| 3 | 11. | 56 | 198 | 8. | 44 | 1688 | 0. | 82 | 14. | 15 |
| 5aaQuoted values for objects 5 and 6 are not corrected for internal extinction because of the lack of a measurable H line in their spectra. | 0. | 06 | 28 | 0. | 05 | 9 | 0. | 004 | 0. | 05 |
| 6aaQuoted values for objects 5 and 6 are not corrected for internal extinction because of the lack of a measurable H line in their spectra. | 0. | 32 | 24 | 0. | 23 | 46 | 0. | 02 | 0. | 31 |
| 7 | 5. | 34 | 90 | 3. | 90 | 780 | 0. | 38 | 3. | 46 |
| 8 | 1. | 30 | 94 | 0. | 95 | 190 | 0. | 09 | 1. | 41 |
| 9 | 2. | 14 | 26 | 1. | 56 | 313 | 0. | 15 | 1. | 67 |
| 10 | 1. | 03 | 59 | 0. | 75 | 150 | 0. | 07 | 0. | 71 |
| Model Parameter | Object 3 | Object 7 | Object 8 | Object 9 | Object 10 |
|---|---|---|---|---|---|
| T∗ (104 K) | 4.0 | 4.0 | 4.0 | 4.0 | 4.0 |
| Z/Z⊙ | 0.34 | 0.30 | 0.34 | 0.30 | 0.10 |
| N/N⊙ | 0.34 | 0.20 | 0.34 | 0.18 | 0.08 |
| O/O⊙ | 0.34 | 0.36 | 0.34 | 0.36 | 0.08 |
| S/S⊙ | 0.34 | 0.36 | 0.34 | 0.36 | 0.10 |
| U (10-4) | 4.22 | 6.59 | 6.93 | 4.66 | 3.92 |
| NH (102cm-3) | 0.94 | 1.31 | 1.32 | 0.57 | 2.27 |
| Line | Object 3 | Object 7 | Object 8 | Object 9 | Object 10 |
|---|---|---|---|---|---|
| OII 3727 | 6.060.19 | 4.370.40 | 6.320.42 | 2.570.57 | |
| 4.70, 2.3E+0 | 4.16, 1.7E-2 | 5.11, 3.2E-1 | 2.64, 2.5E-3 | ||
| H | 0.580.38 | ||||
| 0.48, 3.3E-1 | |||||
| OIII 4959 | 0.530.89 | 0.830.28 | 1.010.61 | ||
| 0.37, 2.4E-1 | 0.72, 3.3E-1 | 0.69, 5.7E-1 | |||
| OIII 5007 | 1.000.57 | 2.330.20 | 1.830.41 | 1.710.55 | 0.590.69 |
| 1.07, 1.4E-2 | 2.07, 4.1E-1 | 1.99, 4.8E-2 | 1.35, 2.4E-1 | 0.60, 1.2E-3 | |
| NII 6548 | 0.310.89 | 0.171.07 | 0.241.54 | 0.221.68 | |
| 0.43, 1.8E-1 | 0.20, 2.3E-2 | 0.35, 9.5E-2 | 0.23, 2.2E-4 | ||
| H | 2.850.46 | 2.850.19 | 2.850.40 | 2.850.36 | 2.850.50 |
| 2.86, 2.9E-5 | 2.85, 7.2E-5 | 2.85, 1.6E-5 | 2.86, 3.7E-5 | 2.88, 4.3E-4 | |
| NII 6583 | 0.710.60 | 0.490.46 | 0.720.69 | 0.640.75 | 0.390.95 |
| 1.26, 1.7E+0 | 0.58, 1.7E-1 | 1.04, 4.2E-1 | 0.67, 2.8E-3 | 0.50, 9.5E-2 | |
| SII 6716 | 0.961.00 | 0.660.36 | 0.620.59 | 0.930.55 | |
| 0.62, 3.1E-1 | 0.53, 4.4E-1 | 0.48, 2.6E-1 | 0.65, 5.8E-1 | ||
| SII 6731 | 0.571.3 | 0.570.41 | 0.530.69 | 0.550.64 | |
| 0.46, 3.1E-1 | 0.41, 8.6E-1 | 0.37, 4.0E-1 | 0.47, 5.4E-2 |
Note. — Line intensities are relative to H. For every emission line, the observed values with relative errors are in the first row and the modeled values with the of the fit to the line are in the second row, in boldface type.
| Model Parameter | Object 7 | Object 8 | Object 9 |
|---|---|---|---|
| T∗ (104 K) | 4.0 | 4.0 | 4.0 |
| Z/Z⊙ | 0.10 | 0.15 | 0.15 |
| N/N⊙ | 0.10 | 0.23 | 0.15 |
| O/O⊙ | 0.34 | 0.38 | 0.05 |
| S/S⊙ | 0.34 | 0.38 | 0.05 |
| U (10-4) | 5.91 | 6.45 | 4.66 |
| NH (102cm-3) | 1.11 | 0.95 | 0.57 |
| Object ID | Object | Object | B V | V R | MB | MV | MR | |
|---|---|---|---|---|---|---|---|---|
| 3+9 | 19.37 | 19.12 | 18.67 | 0.26 | 0.45 | 16.9 | 17.2 | 17.6 |
| 7 | 19.87 | 19.81 | 19.33 | 0.06 | 0.47 | 16.4 | 16.5 | 16.9 |
| 8 | 23.27 | 23.30 | 22.69 | 0.03 | 0.60 | 13.0 | 13.0 | 13.6 |
| 11 | 22.54 | 22.87 | 22.26 | 0.32 | 0.61 | 13.7 | 13.4 | 14.0 |
| 10 | 21.27 | 21.07 | 20.46 | 0.20 | 0.61 | 14.2 | 14.4 | 14.9 |
| 12 | 22.05 | 21.84 | 21.42 | 0.21 | 0.42 | 15.0 | 15.2 | 15.8 |